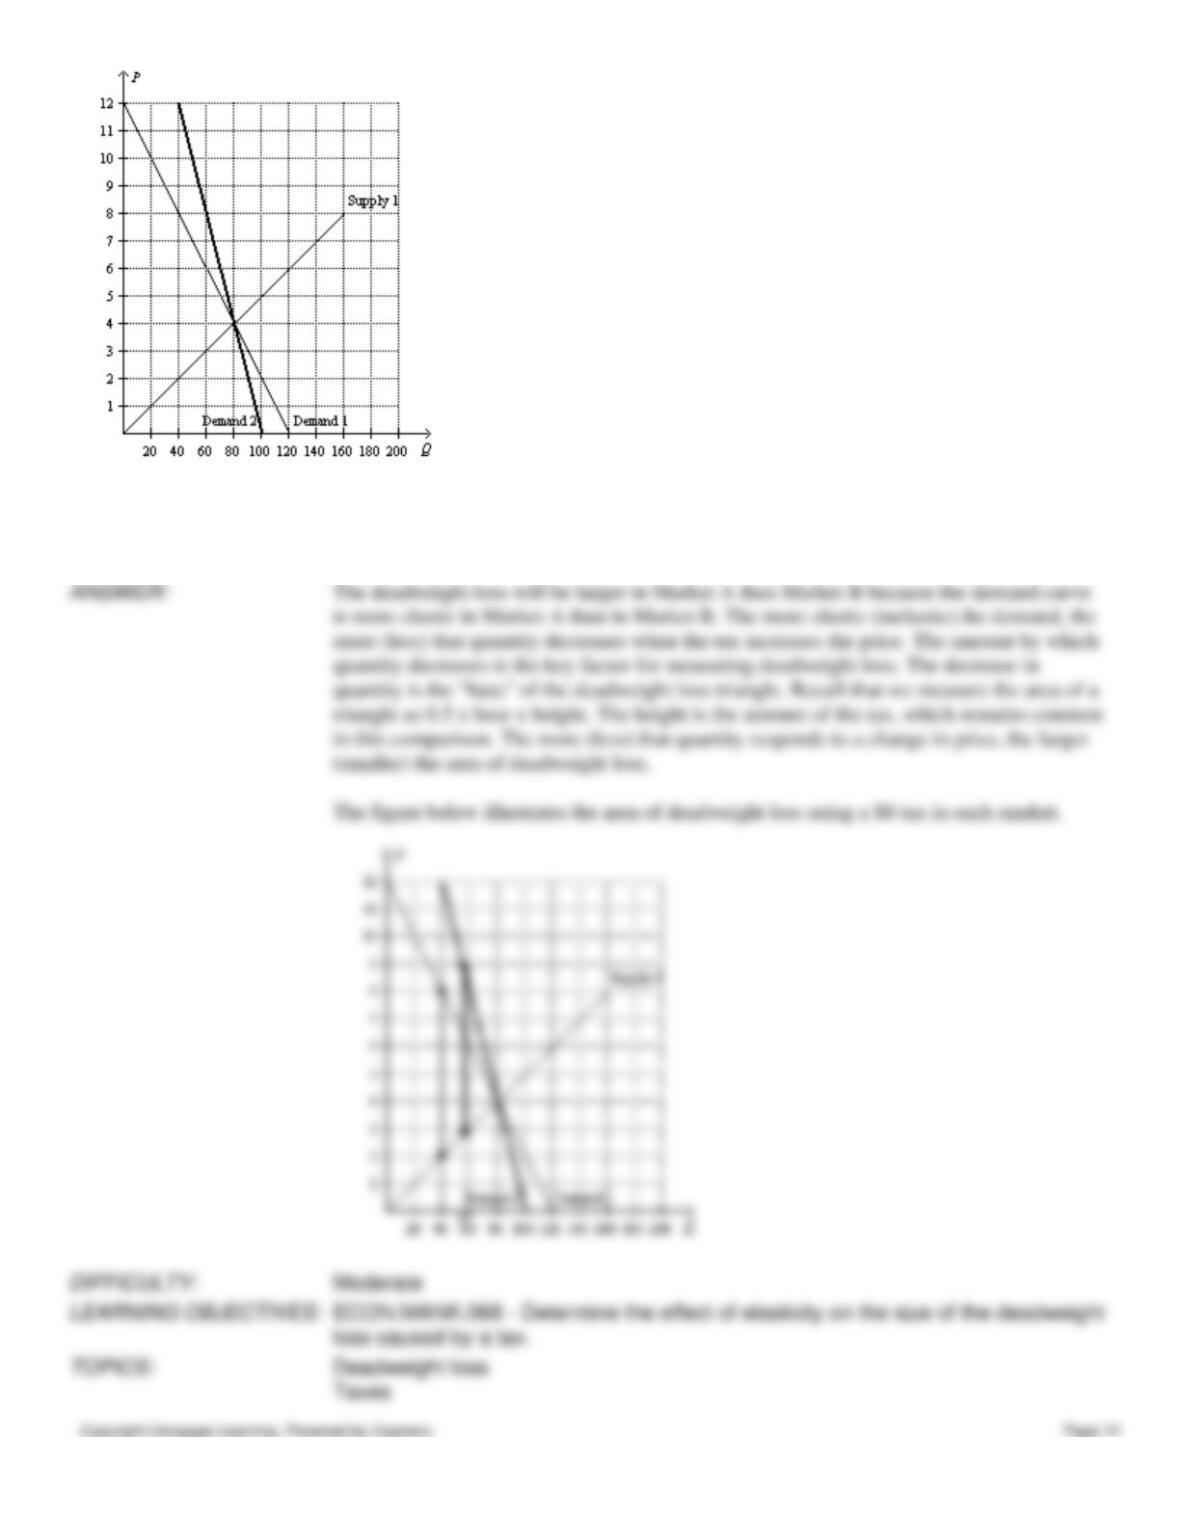
39. Refer to Figure 8-27. Suppose that Market A is characterized by Demand 1 and Supply 1, and Market B is
characterized by Demand 2 and Supply 1. If an identical tax is imposed on each market, the tax will create a larger
deadweight loss in which market? Explain.
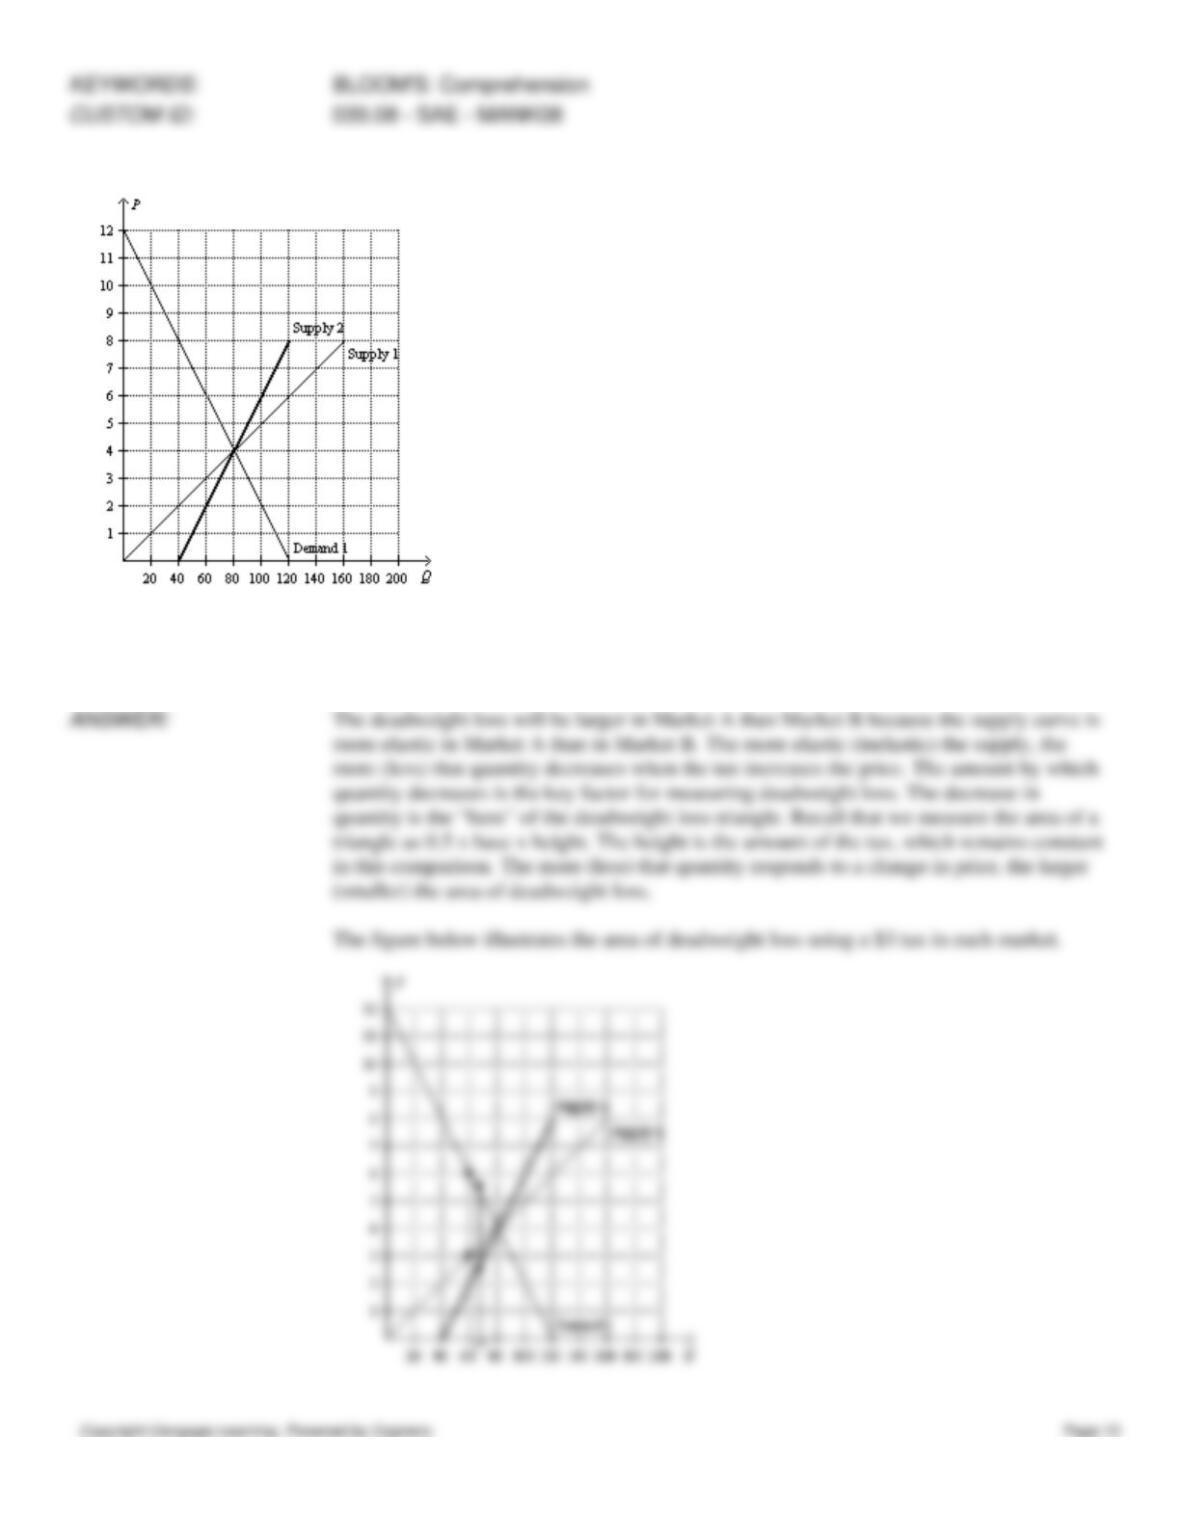
Figure 8-28
40. Refer to Figure 8-28. Suppose that Market A is characterized by Demand 1 and Supply 1, and Market B is
characterized by Demand 1 and Supply 2. If an identical tax is imposed on each market, the tax will create a larger
deadweight loss in which market? Explain.
41. Provide several examples of important taxes on labor in the United States. For a typical worker, what is the marginal
tax rate on labor income once all the labor taxes are summed?
42. Is the United States’ labor supply more inelastic or more elastic? Briefly summarize the competing theories.
43. The demand for energy drinks is more elastic than the demand for milk. Would a tax on energy drinks or a tax on milk
have a larger deadweight loss? Explain.
44. Suppose that the market for product X is characterized by a typical, downward-sloping, linear demand curve and a
typical, upward-sloping, linear supply curve. Suppose the price elasticity of supply is 0.7. Will the deadweight loss from a
$3 tax per unit be smaller if the absolute value of the price elasticity of demand is 0.6 or if the absolute value of the price
elasticity of demand is 1.5?
45. Suppose the demand curve and the supply curve in a market are both linear, and suppose the price elasticity of supply
is 0.5. Will the deadweight loss from a $3 tax per unit be larger if the price elasticity of demand is 0.3 or if the price
elasticity of demand is 0.7?
46. Suppose that the market for product X is characterized by a typical, downward-sloping, linear demand curve and a
typical, upward-sloping, linear supply curve. If a $2 tax per unit results in a deadweight loss of $200, how large would be
the deadweight loss from a $4 tax per unit?
47. Suppose that the market for product X is characterized by a typical, downward-sloping, linear demand curve and a
typical, upward-sloping, linear supply curve. If a $2 tax per unit results in a deadweight loss of $200, how large would be
the deadweight loss from a $6 tax per unit?
CUSTOM ID:
047.08 – SAE – MANK08
48. Suppose the demand curve and the supply curve in a market are both linear. If a $2 tax per unit results in a deadweight
loss of $200, how large would be the deadweight loss from a $3 tax per unit?
CUSTOM ID:
048.08 – SAE – MANK08
49. Suppose the demand curve and the supply curve in a market are both linear. To begin, there was a $5 tax per unit, and
the $5 tax resulted in a deadweight loss of $1,500. Now, the tax per unit is higher, with the higher tax resulting in a
deadweight loss of $6,000. What is the amount of the new tax per unit?
LEARNING OBJECTIVES:
CUSTOM ID:
049.08 – SAE – MANK08
Figure 8-29
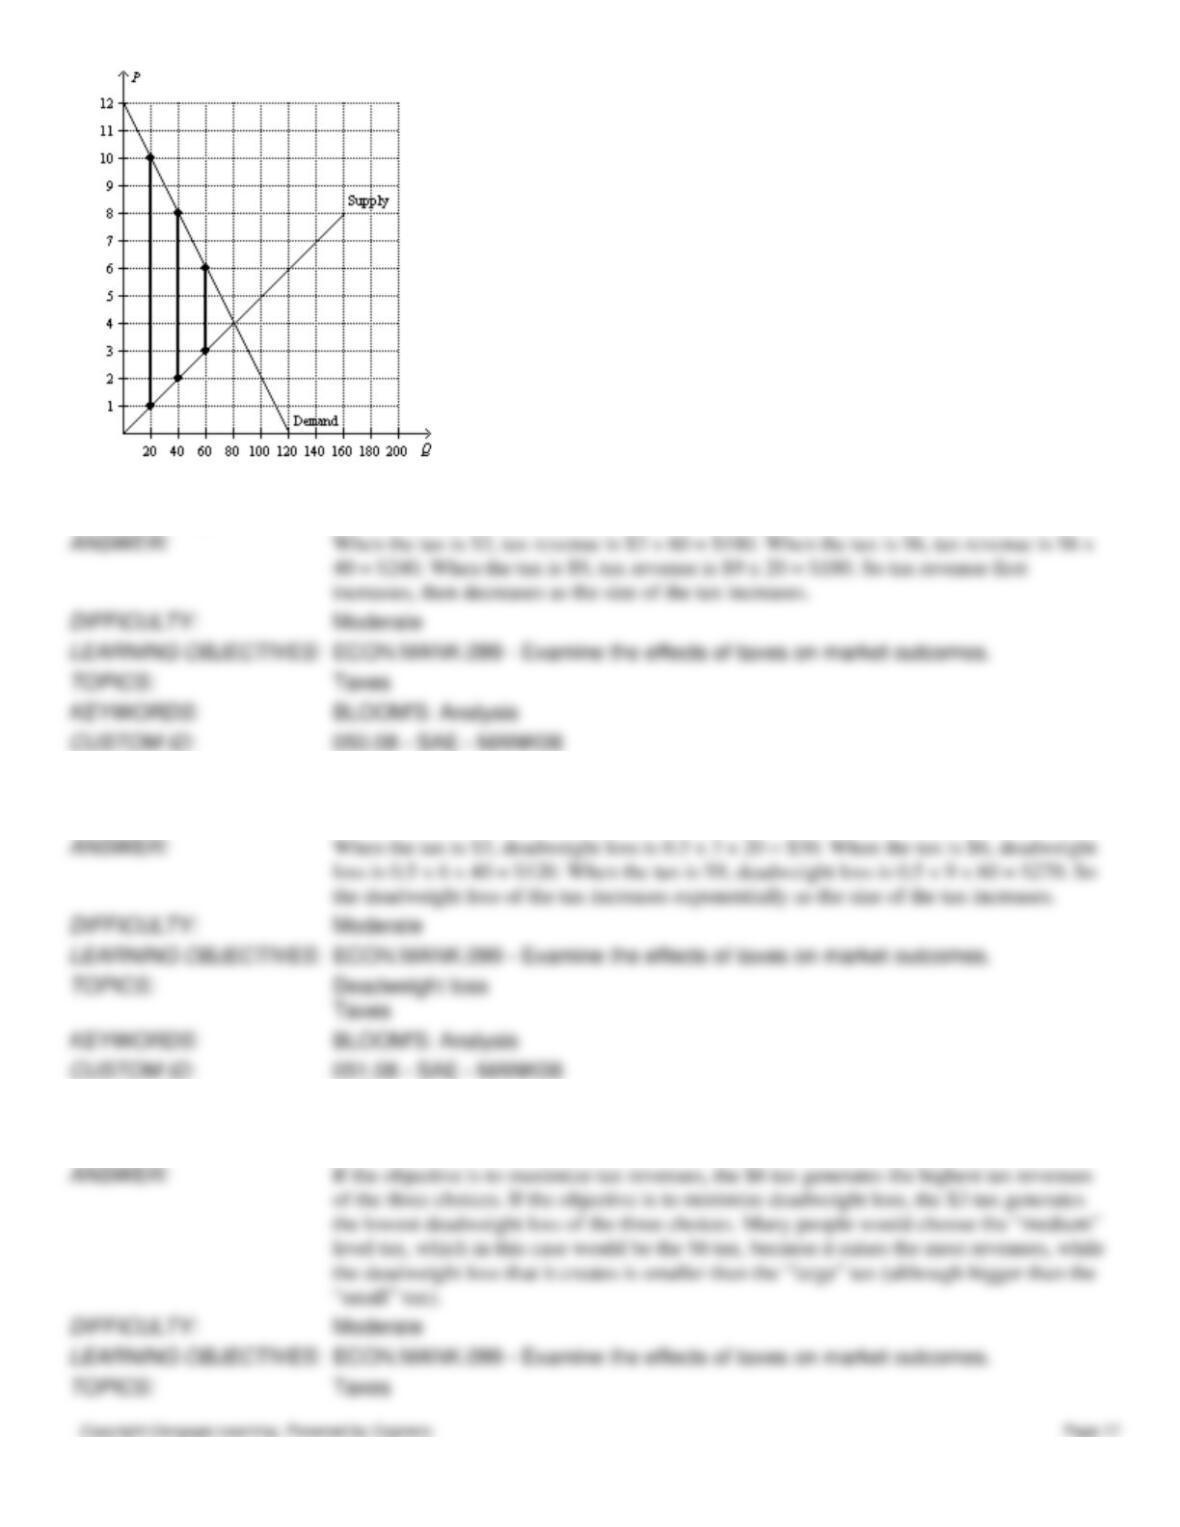
50. Refer to Figure 8-29. As the size of the tax increases from $3 to $6 to $9, what happens to tax revenues?
51. Refer to Figure 8-29. As the size of the tax increases from $3 to $6 to $9, what happens to the deadweight loss from
the tax?
52. Refer to Figure 8-29. If you were a policymaker choosing between a $3, $6, or $9 tax, which would you choose and
why?
53. Describe the Laffer curve.
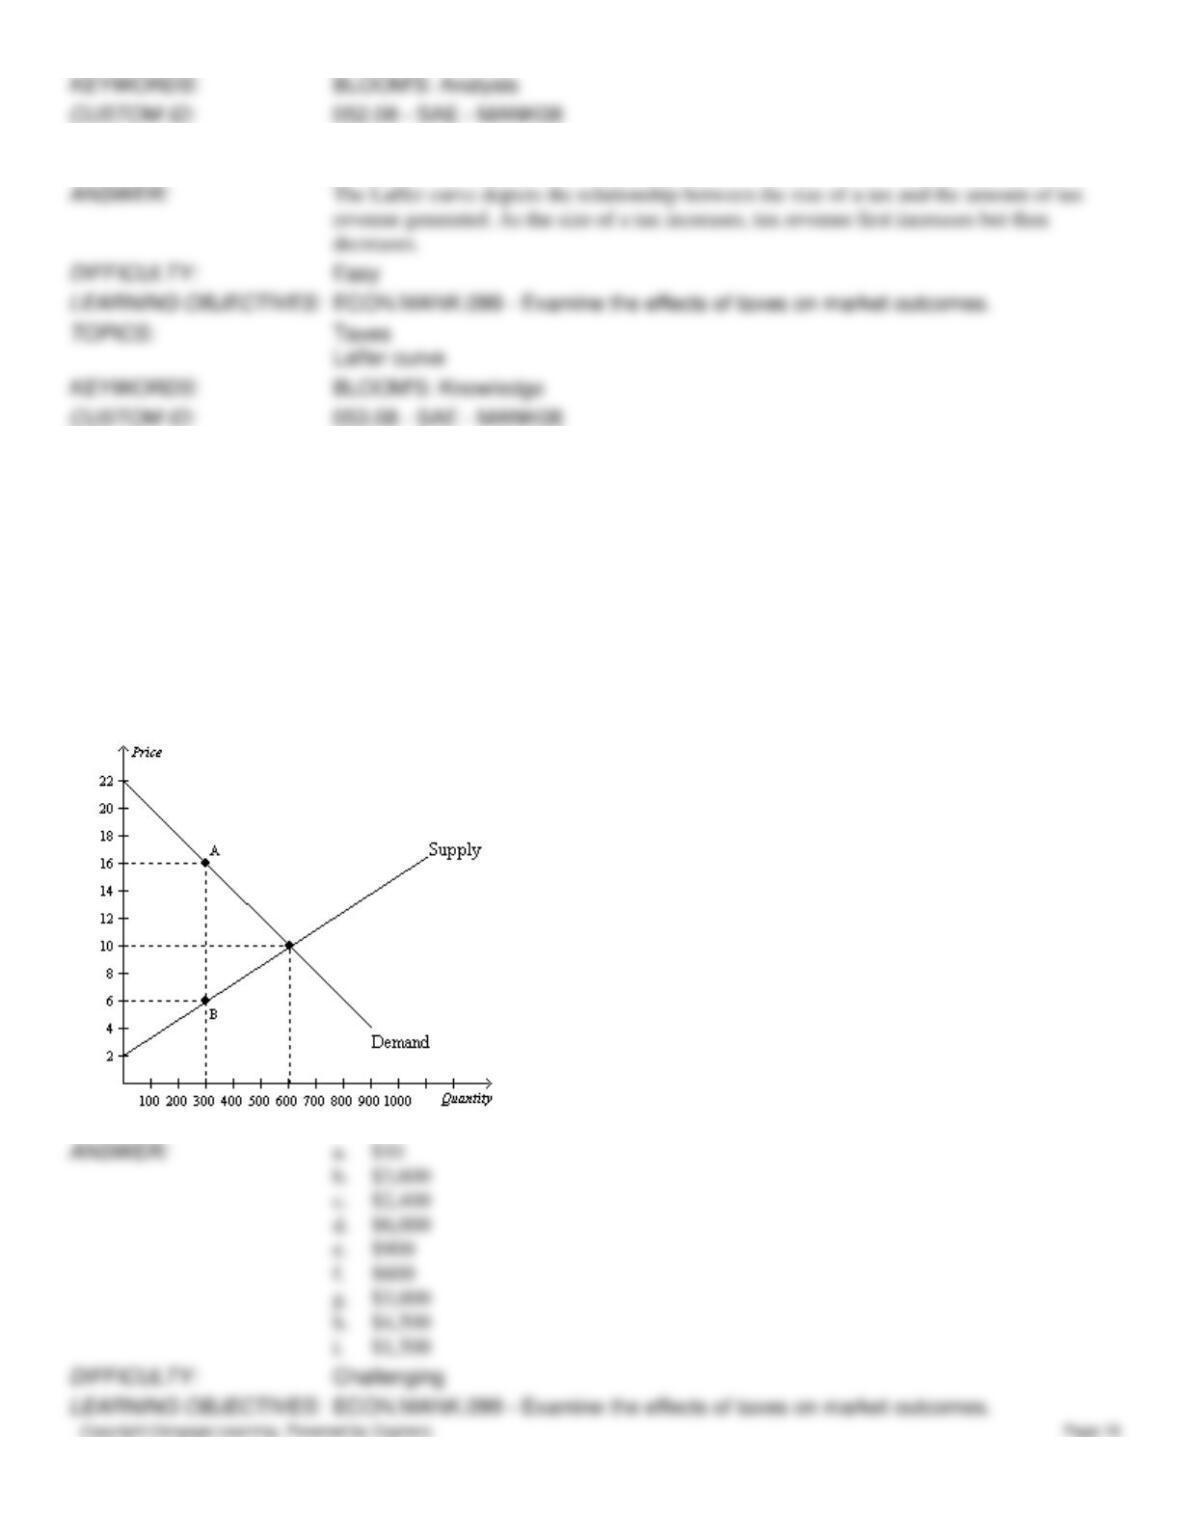
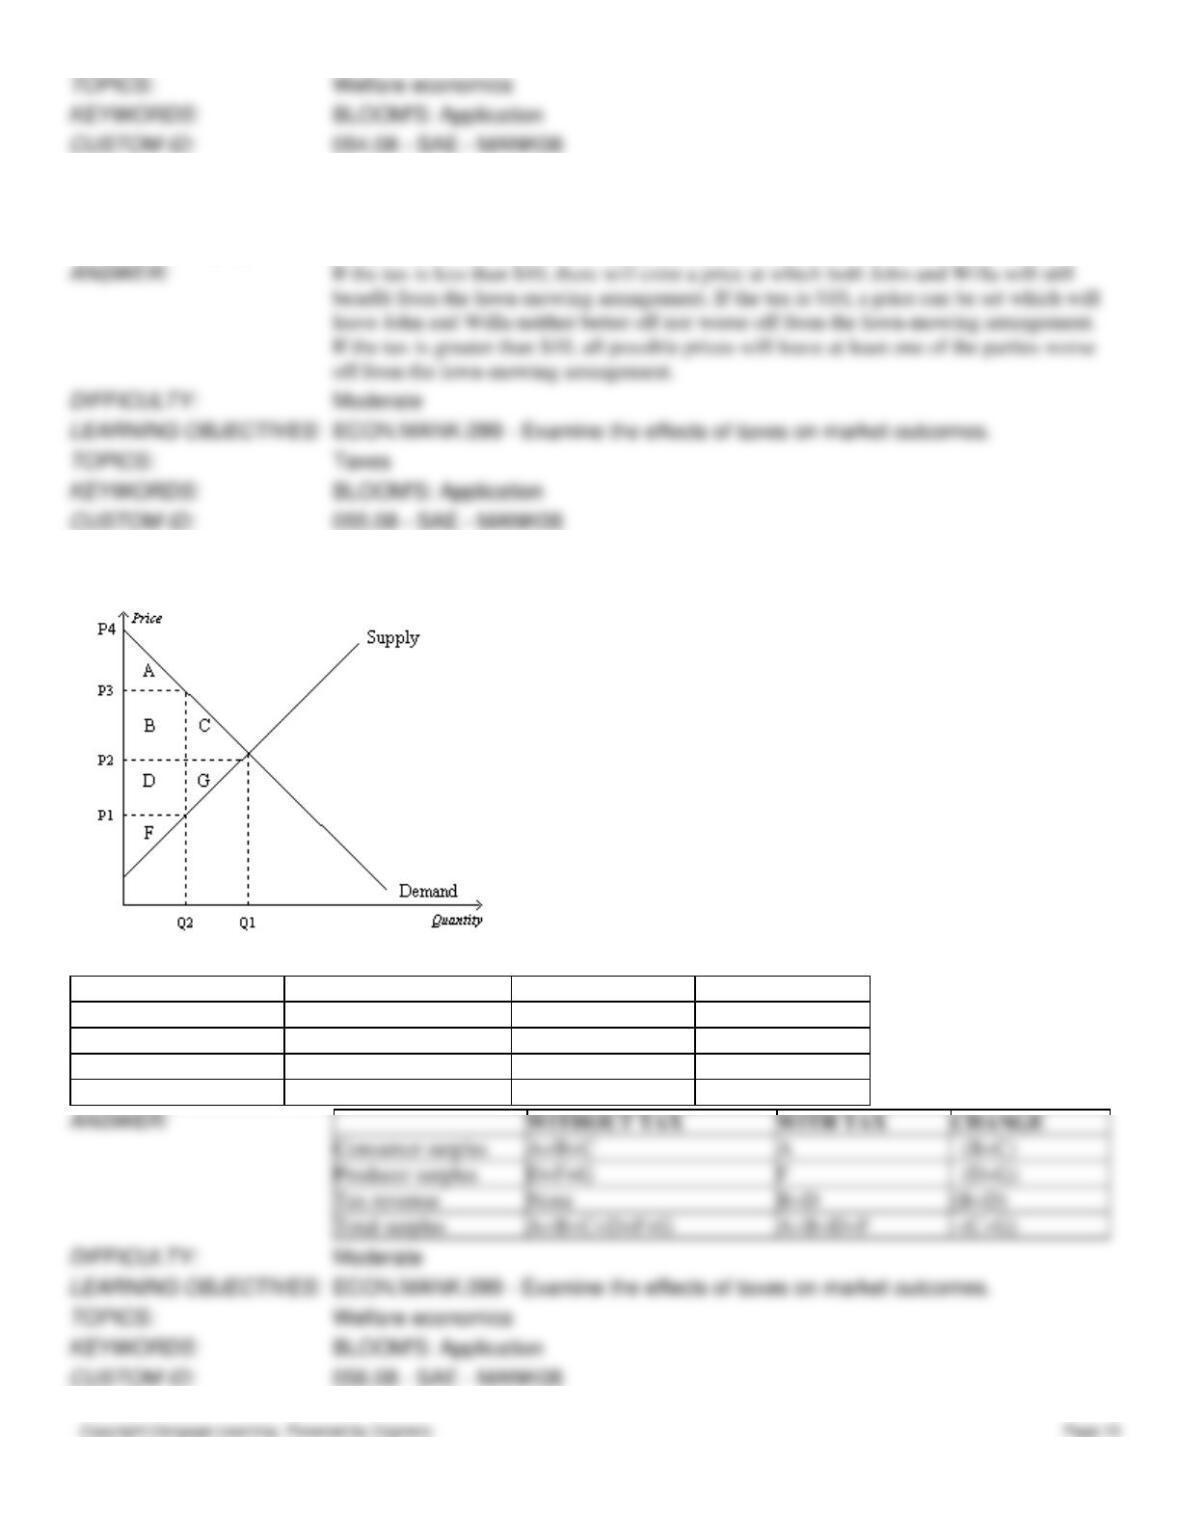
54. Suppose the government levies a tax of the vertical distance from point A to point B. Using the graph shown,
determine the value of each of the following:
a.
equilibrium price before the tax
b.
consumer surplus before the tax
c.
producer surplus before the tax
d.
total surplus before the tax
e.
consumer surplus after the tax
f.
producer surplus after the tax
g.
total tax revenue to the government
h.
total surplus (consumer surplus+producer surplus+tax revenue) after the tax
i.
deadweight loss
a.
$10
b.
c.
d.
e.
$900
f.
$600
g.
i.
55. John has been in the habit of mowing Willa’s lawn each week for $20. John’s opportunity cost is $15, and Willa would
be willing to pay $25 to have her lawn mowed. What is the maximum tax the government can impose on lawn mowing
without discouraging John and Willa from continuing their mutually beneficial arrangement?
56. Use the following graph shown to fill in the table that follows.
WITHOUT TAX
WITH TAX
CHANGE
Consumer surplus
Producer surplus
Tax revenue
Total surplus
WITHOUT TAX
WITH TAX
CHANGE
Consumer surplus
Producer surplus
Tax revenue
Total surplus
57. Suppose that instead of a supply-demand diagram, you are given the following information:
Qs = 100 + 3P
Qd = 400 – 2P
From this information compute equilibrium price and quantity. Now suppose that a tax is placed on buyers so that
Qd = 400 – 2(P + T).
If T = 15, solve for the new equilibrium price and quantity. (Note: P is the price received by sellers and P + T is the price
paid by buyers.) Compare these answers for equilibrium price and quantity with your first answers. What does this show
you?
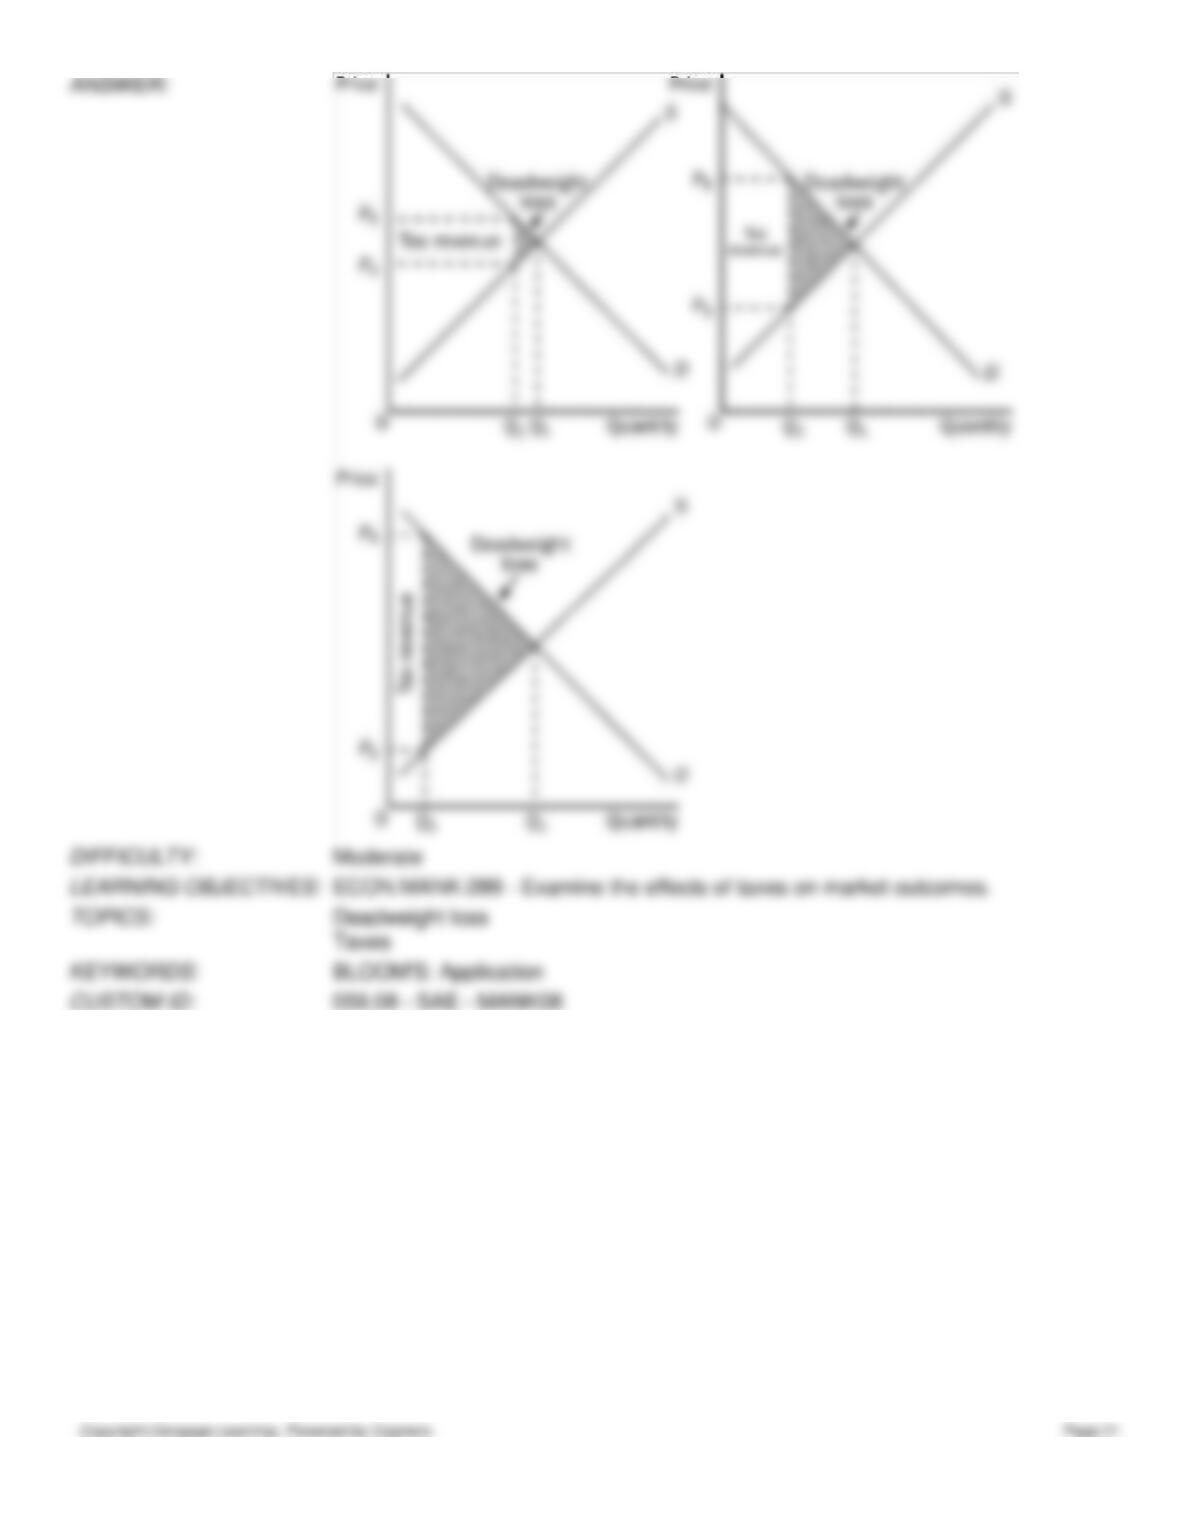
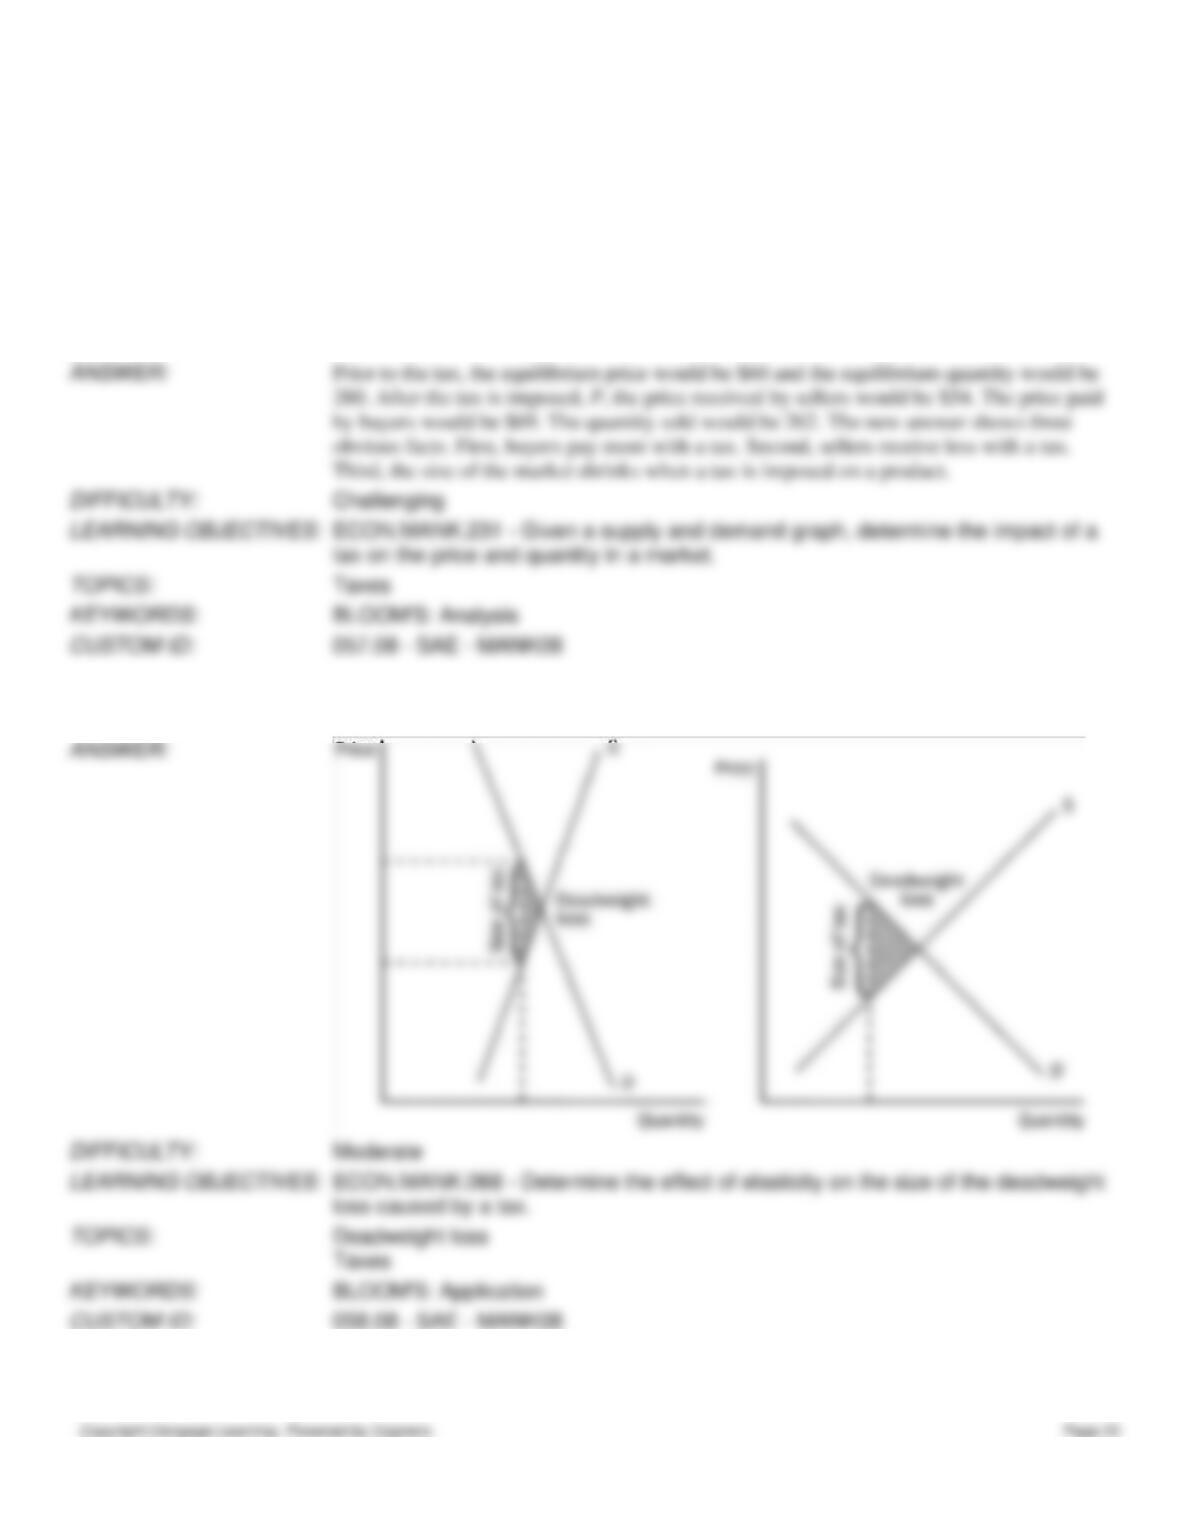
58. Using demand and supply diagrams, show the difference in deadweight loss between (a) a market with inelastic
demand and supply and (b) a market with elastic demand and supply.
59. Illustrate on three demand-and-supply graphs how the size of a tax (small, medium and large) can alter total revenue
and deadweight loss.