
76 ❖ Chapter 8/Application: The Costs of Taxation
43. As the size of a tax rises, the deadweight loss
a.
rises, and tax revenue first rises, then falls.
b.
rises as does tax revenue.
c.
falls, and tax revenue first rises, then falls.
d.
falls as does tax revenue.
44. Suppose the federal government doubles the gasoline tax. The deadweight loss associated with the tax
a.
also doubles.
b.
triples.
c.
quadruples.
d.
rises by a factor of 8.
45. The Laffer curve illustrates that
a.
deadweight loss rises by the square of the increase in a tax.
b.
deadweight loss rises exponentially as a tax increases.
c.
tax revenue first rises, then falls as a tax increases.
d.
Both a) and b) are correct.
46. In a recent research paper published by the European Central Bank, two economists concluded that U.S. tax
revenues would
a.
increase if labor taxes were increased or if capital income taxes were increased.
b.
increase if labor taxes were increased, but tax revenues would decrease if capital income taxes were
increased.
c.
decrease if labor taxes were increased, but tax revenues would increase if capital income taxes were
increased.
d.
decrease if labor taxes were increased or if capital income taxes were increased.
47. In a recent research paper published by the European Central Bank, two economists concluded that
a.
tax revenue would increase in Denmark and Sweden if tax rates on capital income were reduced in
those countries.
b.
tax revenue would increase in Denmark and Sweden if tax rates on labor income were reduced in
those countries.
c.
tax revenue would increase in the U.S. if tax rates on capital income were reduced in the U.S.
d.
tax revenue would increase in the U.S. if tax rates on labor income were reduced in the U.S.
Chapter 8/Application: The Costs of Taxation ❖ 77
48. Which of the following statements is correct?
a.
A decrease in the size of a tax always decreases the tax revenue raised by that tax.
b.
A decrease in the size of a tax always decreases the deadweight loss of that tax.
c.
Tax revenue decreases when there is a small decrease in the tax rate and the economy is on the
downward-sloping part of the Laffer curve.
d.
An increase in the size of a tax leads to an increase in the deadweight loss of the tax only if the
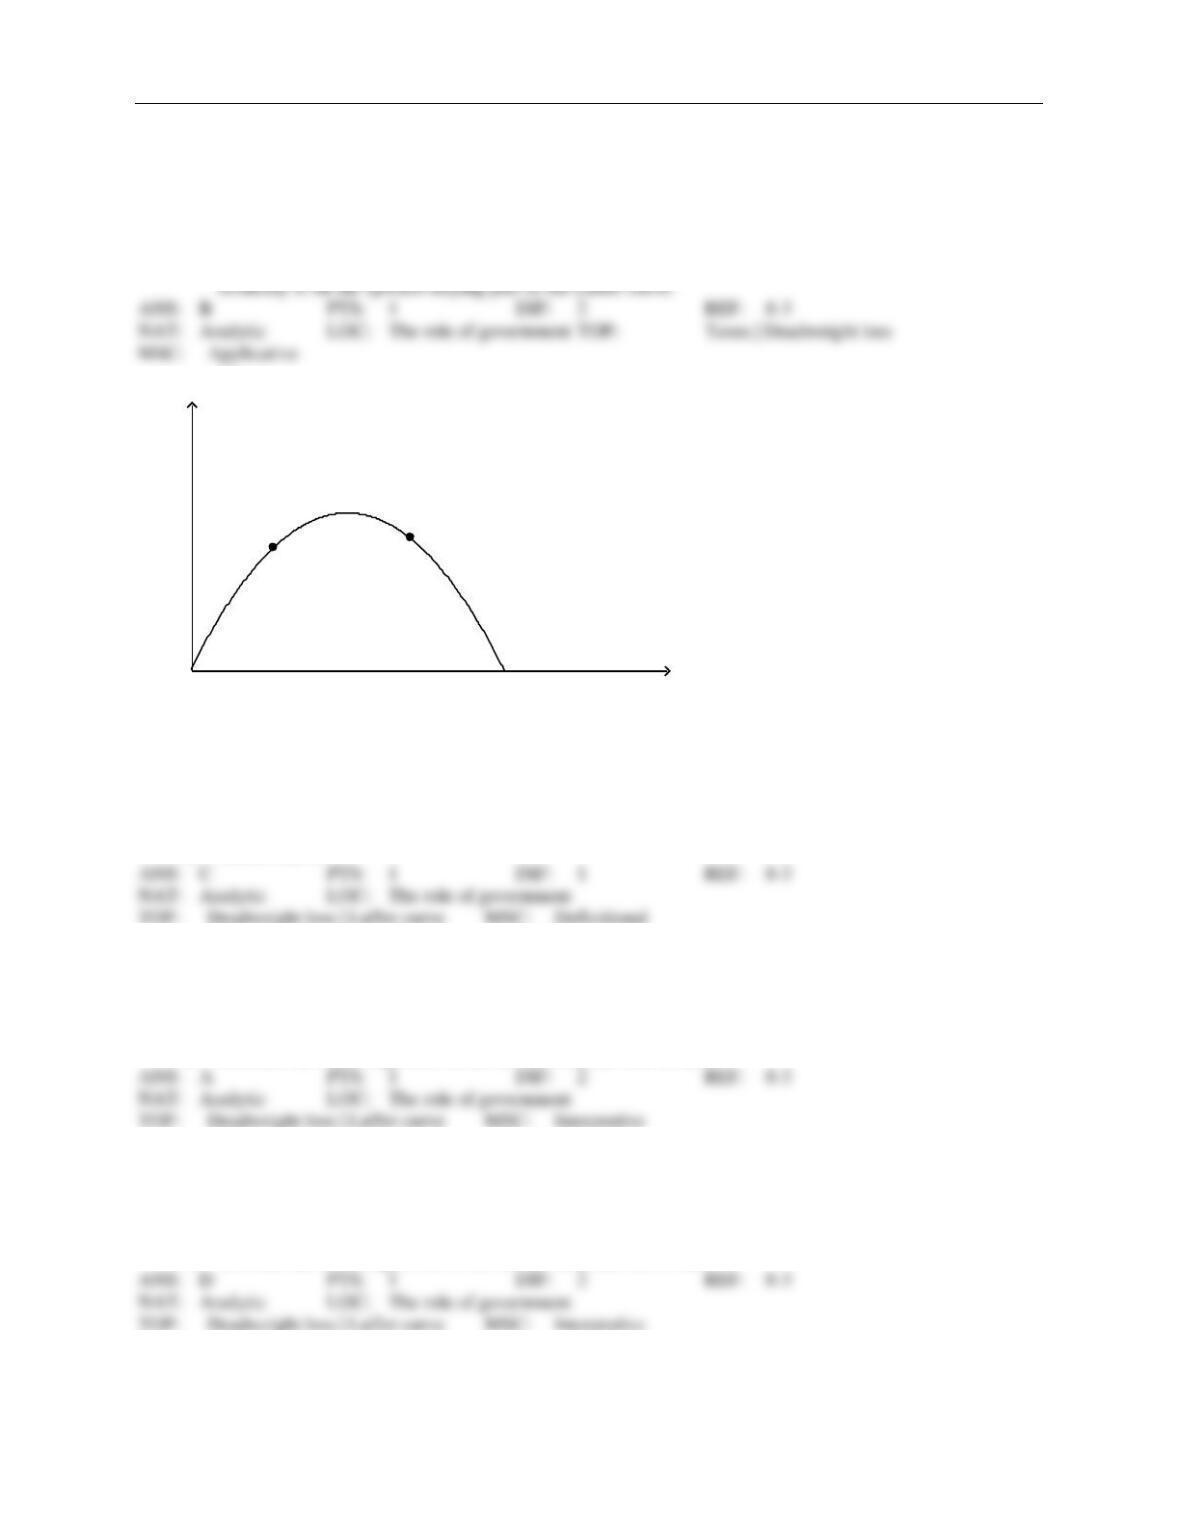
Figure 8-19. The figure represents the relationship between the size of a tax and the tax revenue raised by that tax.
AB
Tax Revenue
Tax Size
1
2
3
4
5
6
7
8
9
49. Refer to Figure 8-19. The curve that is shown on the figure is called the
a.
deadweight–loss curve.
b.
tax-incidence curve.
c.
Laffer curve.
d.
Lorenz curve.
50. Refer to Figure 8-19. If the economy is at point A on the curve, then a small increase in the tax rate will
a.
increase the deadweight loss of the tax and increase tax revenue.
b.
increase the deadweight loss of the tax and decrease tax revenue.
c.
decrease the deadweight loss of the tax and increase tax revenue.
d.
decrease the deadweight loss of the tax and decrease tax revenue.
51. Refer to Figure 8-19. If the economy is at point A on the curve, then a decrease in the tax rate will
a.
increase the deadweight loss of the tax and increase tax revenue.
b.
increase the deadweight loss of the tax and decrease tax revenue.
c.
decrease the deadweight loss of the tax and increase tax revenue.
d.
decrease the deadweight loss of the tax and decrease tax revenue.
78 ❖ Chapter 8/Application: The Costs of Taxation
52. Refer to Figure 8-19. If the economy is at point B on the curve, then an increase in the tax rate will
a.
increase the deadweight loss of the tax and increase tax revenue.
b.
increase the deadweight loss of the tax and decrease tax revenue.
c.
decrease the deadweight loss of the tax and increase tax revenue.
d.
decrease the deadweight loss of the tax and decrease tax revenue.
53. Refer to Figure 8-19. If the economy is at point B on the curve, then a small decrease in the tax rate will
a.
increase the deadweight loss of the tax and increase tax revenue.
b.
increase the deadweight loss of the tax and decrease tax revenue.
c.
decrease the deadweight loss of the tax and increase tax revenue.
d.
decrease the deadweight loss of the tax and decrease tax revenue.
54. Refer to Figure 8-19. According to a recent research paper published by the European Central Bank, the
U.S.
a.
is more likely at a point such as point A rather than point B if the tax in question is the tax on
capital income.
b.
is more likely at a point such as point B rather than point A if the tax in question is the tax on labor
income.
c.
could increase tax revenues more by raising taxes on capital income than by raising taxes on labor
income.
d.
All of the above are correct.
55. Refer to Figure 8-19. According to a recent research paper published by the European Central Bank, which
two countries are at a point such as point B if the tax in question is the tax on capital income?
a.
the U.S. and the U.K.
b.
France and Germany
c.
Italy and Spain
d.
Denmark and Sweden
Chapter 8/Application: The Costs of Taxation ❖ 79
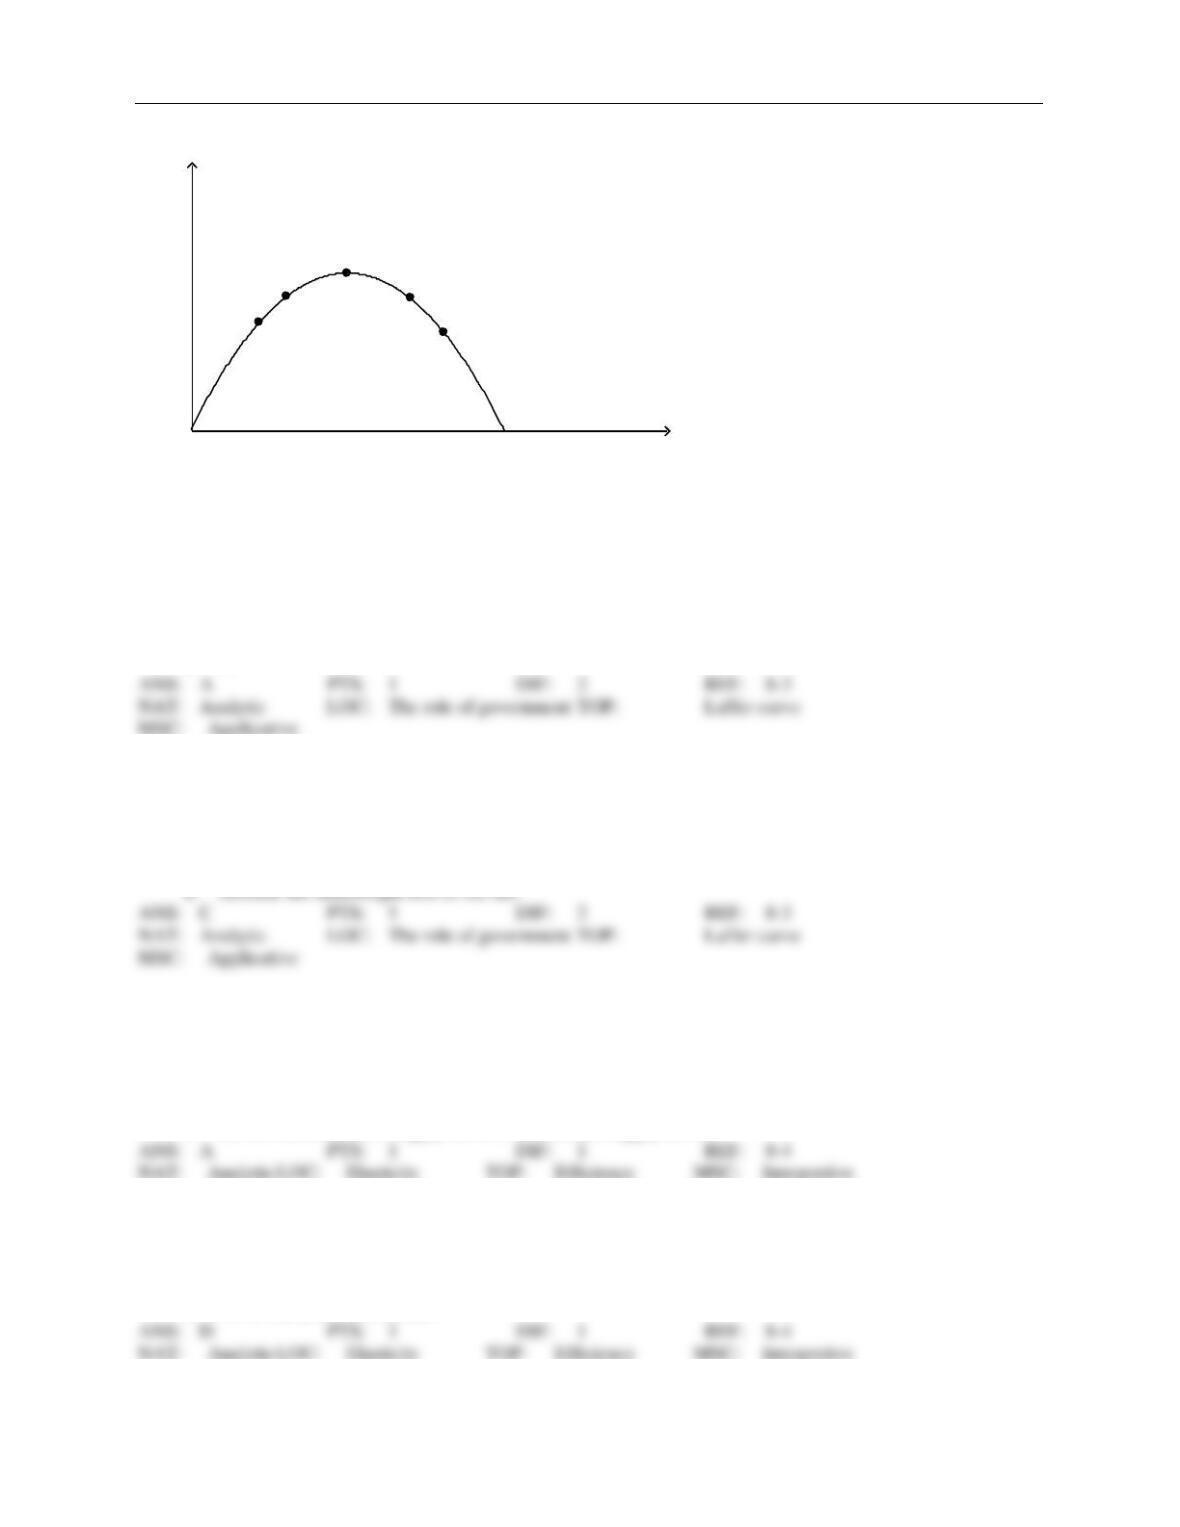
Figure 8-20. The figure represents the relationship between the size of a tax and the tax revenue raised by that tax.
A
B
C
Tax Revenue
D
F
Tax Size
1
2
3
4
5
6
7
8
9
56. Refer to Figure 8-20. Suppose the figure pertains to the labor tax, and suppose also that point B represents
the position on the curve of the typical European country. Then, according to a recent research paper pub-
lished by the European Central Bank, the position on the curve of the U.S. would most likely be point
a.
A.
b.
C.
c.
D.
d.
F.
57. Refer to Figure 8-20. For an economy that is currently at point D on the curve, a decrease in the tax rate
would
a.
decrease consumer surplus.
b.
decrease producer surplus.
c.
increase tax revenue.
d.
increase the deadweight loss of the tax.
CONCLUSION
1. When the government imposes taxes on buyers or sellers of a good, society
a.
loses some of the benefits of market efficiency.
b.
gains efficiency but loses equality.
c.
is better off because the government’s tax revenues exceed the deadweight loss.
d.
moves from an elastic supply curve to an inelastic supply curve.
2. Taxes are costly to market participants because they
a.
transfer resources from market participants to the government.
b.
alter incentives.
c.
distort market outcomes.
d.
All of the above are correct.

80 ❖ Chapter 8/Application: The Costs of Taxation
3. Taxes are of interest to
a.
microeconomists because they consider how to balance equality and efficiency.
b.
microeconomists because they consider how best to design a tax system.
c.
macroeconomists because they consider how policymakers can use the tax system to stabilize
economic activity.
d.
All of the above are correct.
TRUE/FALSE
1. Total surplus is always equal to the sum of consumer surplus and producer surplus.
2. Total surplus in a market does not change when the government imposes a tax on that market because the loss
of consumer surplus and producer surplus is equal to the gain of government revenue.
3. When a tax is imposed on buyers, consumer surplus and producer surplus both decrease.
4. When a tax is imposed on buyers, consumer surplus decreases but producer surplus increases.
5. When a tax is imposed on sellers, producer surplus decreases but consumer surplus increases.
6. When a tax is imposed on sellers, consumer surplus and producer surplus both decrease.
7. Taxes affect market participants by increasing the price paid by the buyer and received by the seller.
8. Taxes affect market participants by increasing the price paid by the buyer and decreasing the price received by
the seller.

Chapter 8/Application: The Costs of Taxation ❖ 81
9. A tax raises the price received by sellers and lowers the price paid by buyers.
10. Normally, both buyers and sellers of a good become worse off when the good is taxed.
11. When a good is taxed, the tax revenue collected by the government equals the decrease in the welfare of buy-
ers and sellers caused by the tax.
12. A tax places a wedge between the price buyers pay and the price sellers receive.
13. A tax on a good causes the size of the market to increase.
14. A tax on a good causes the size of the market to shrink.
15. When a tax is imposed, the loss of consumer surplus and producer surplus as a result of the tax exceeds the tax
revenue collected by the government.
16. Economists use the government’s tax revenue to measure the public benefit from a tax.
17. Because taxes distort incentives, they cause markets to allocate resources inefficiently.
18. Taxes cause deadweight losses because they prevent buyers and sellers from realizing some of the gains from
trade.

82 ❖ Chapter 8/Application: The Costs of Taxation
19. If the government imposes a $3 tax in a market, the equilibrium price will rise by $3.
20. If the government imposes a $3 tax in a market, the buyers and sellers will share an equal burden of the tax.
21. Taxes create deadweight losses.
22. When a tax is imposed on a good, consumer surplus decreases and producer surplus remains unchanged.
23. When a tax is imposed on a good, the resulting decrease in consumer surplus is always larger than the result-
ing decrease in producer surplus.
24. Taxes drive a wedge into the market by raising the price that sellers receive and lowering the price that buyers
pay.
25. Tax revenue equals the size of the tax multiplied by the quantity sold in the market after the tax is levied.
26. As the price elasticities of supply and demand increase, the deadweight loss from a tax increases.
27. The greater the elasticity of demand, the smaller the deadweight loss of a tax.
28. The more inelastic are demand and supply, the greater is the deadweight loss of a tax.

Chapter 8/Application: The Costs of Taxation ❖ 83
29. The elasticities of the supply and demand curves in the market for cigarettes affect how much a tax distorts
that market.
30. If a tax did not induce buyers or sellers to change their behavior, it would not cause a deadweight loss.
31. The most important tax in the U.S. economy is the tax on corporations’ profits.
32. The Social Security tax, and to a large extent, the federal income tax, are labor taxes.
33. Taxes on labor tend to increase the number of hours that people choose to work.
34. Taxes on labor tend to encourage the elderly to retire early.
35. Taxes on labor tend to encourage second earners to stay at home rather than work in the labor force.
36. Economists disagree on whether labor taxes have a small or large deadweight loss.
37. The demand for bread is less elastic than the demand for donuts; hence, a tax on bread will create a larger
deadweight loss than will the same tax on donuts, other things equal.
38. The larger the deadweight loss from taxation, the larger the cost of government programs.

84 ❖ Chapter 8/Application: The Costs of Taxation
39. A tax on insulin is likely to cause a very large deadweight loss to society.
40. When demand is relatively elastic, the deadweight loss of a tax is larger than when demand is relatively inelas-
tic.
41. The more elastic the supply, the larger the deadweight loss from a tax, all else equal.
42. The demand for beer is more elastic than the demand for milk, so a tax on beer would have a smaller
deadweight loss than an equivalent tax on milk, all else equal.
43. The Social Security tax is a labor tax.
44. When a good is taxed, the deadweight loss is larger the more elastic are demand and supply.
45. The deadweight loss of a tax rises even more rapidly than the size of the tax.
46. As the size of a tax increases, the government’s tax revenue rises, then falls.
47. Tax revenues increase in direct proportion to increases in the size of the tax.
48. If the size of a tax doubles, the deadweight loss doubles.

Chapter 8/Application: The Costs of Taxation ❖ 85
49. If the size of a tax triples, the deadweight loss increases by a factor of six.
50. Economist Arthur Laffer made the argument that tax rates in the United States were so high that reducing the
rates would increase tax revenue.
51. The Laffer curve is the curve showing how tax revenue varies as the size of the tax varies.
52. The result of the large tax cuts in the first Reagan Administration demonstrated very convincingly that Arthur
Laffer was correct when he asserted that cuts in tax rates would increase tax revenue.
53. The idea that tax cuts would increase the quantity of labor supplied, thus increasing tax revenue, became know
as supply-side economics.
54. The Laffer curve illustrates how taxes in markets with greater elasticities of demand compare to taxes in mar-
kets with smaller elasticities of supply.
55. The more elastic are supply and demand in a market, the greater are the distortions caused by a tax on that
market, and the more likely it is that a tax cut in that market will raise tax revenue.
56. The optimal tax is difficult to determine because although revenues rise and fall as the size of the tax increas-
es, deadweight loss continues to increase.
57. Suppose that a university charges students a $100 “tax” to register for business classes. The next year the uni-
versity raises the “tax” to $150. The deadweight loss from the “tax” triples.
86 ❖ Chapter 8/Application: The Costs of Taxation
58. Economists dismiss the idea that lower tax rates can lead to higher tax revenue, because there is a consensus
that the relevant elasticities of demand and supply are very low.
59. When the government imposes taxes on buyers and sellers of a good, society loses some of the benefits of
market efficiency.
SHORT ANSWER
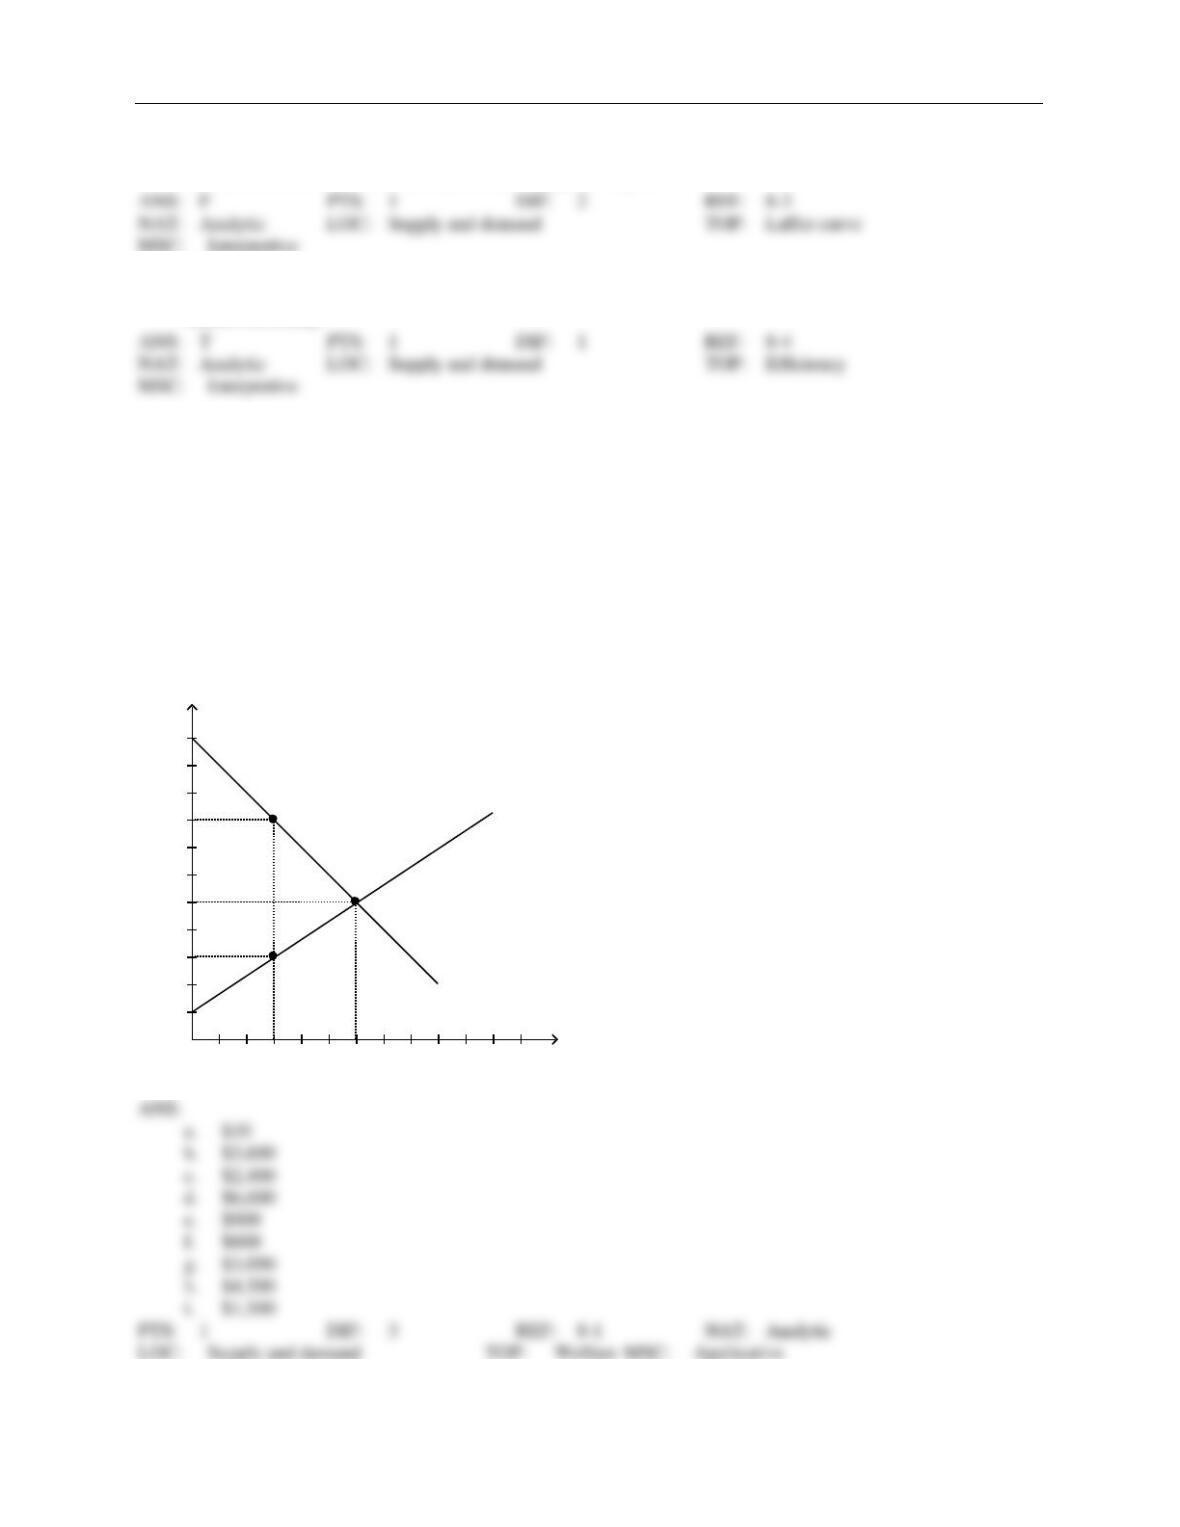
1. Suppose the government levies a tax of the vertical distance from point A to point B. Using the graph shown,
determine the value of each of the following:
a.
equilibrium price before the tax
b.
consumer surplus before the tax
c.
producer surplus before the tax
d.
total surplus before the tax
e.
consumer surplus after the tax
f.
producer surplus after the tax
g.
total tax revenue to the government
h.
total surplus (consumer surplus+producer surplus+tax revenue) after the tax
i.
deadweight loss
A
B
Demand
Supply
100 200 300 400 500 600 700 800 900 1000 Quantity
2
4
6
8
10
12
14
16
18
20
22
Price
a.
$10
b.
$3,600
c.
$2,400
d.
$6,000
e.
$900
f.
$600
g.
$3,000
h.
$4,500
i.
$1,500
Chapter 8/Application: The Costs of Taxation ❖ 87
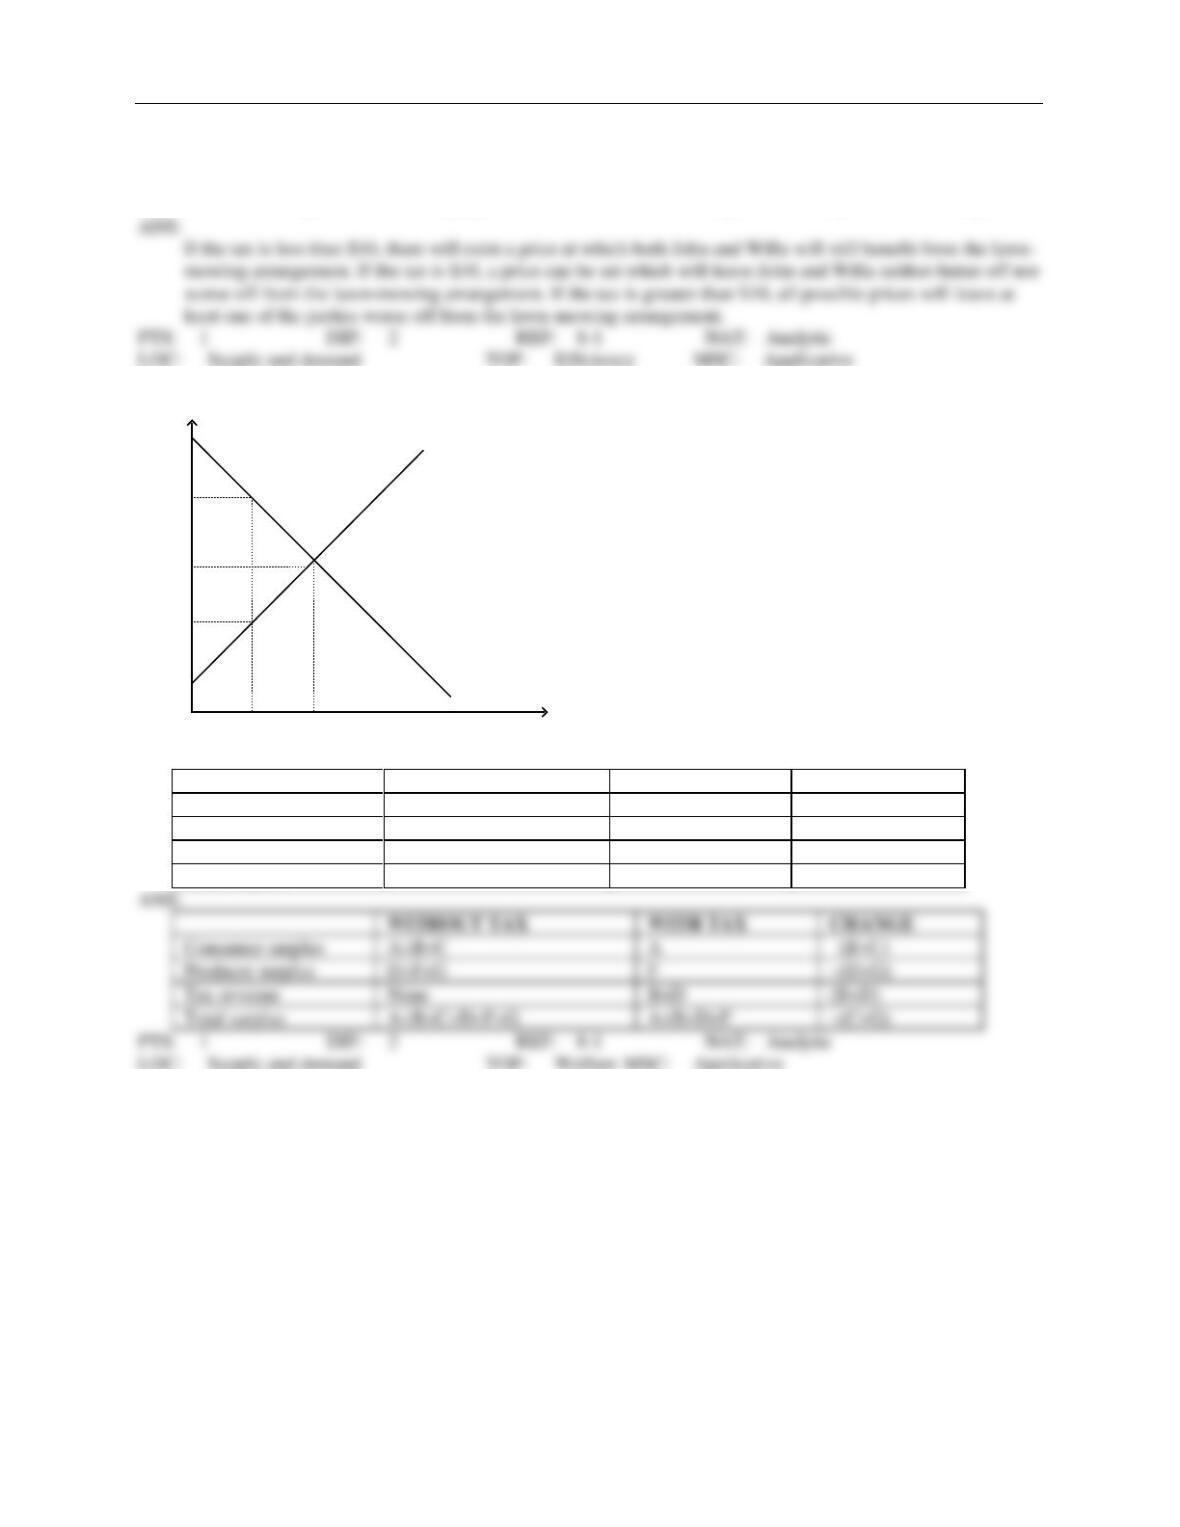
2. John has been in the habit of mowing Willa’s lawn each week for $20. John’s opportunity cost is $15, and Wil-
la would be willing to pay $25 to have her lawn mowed. What is the maximum tax the government can impose
on lawn mowing without discouraging John and Willa from continuing their mutually beneficial arrangement?
3. Use the following graph shown to fill in the table that follows.
Demand
Supply
Q1Q2
P1
P2
P3
A
B
D
F
C
G
P4
Quantity
Price
WITHOUT TAX
WITH TAX
CHANGE
Consumer surplus
Producer surplus
Tax revenue
Total surplus
WITHOUT TAX
WITH TAX
CHANGE
Consumer surplus
A+B+C
A
Producer surplus
D+F+G
F
Tax revenue
None
B+D
(B+D)
Total surplus
A+B+C+D+F+G
A+B+D+F
4. Suppose that instead of a supply-demand diagram, you are given the following information:
Qs = 100 + 3P
Qd = 400 – 2P
From this information compute equilibrium price and quantity. Now suppose that a tax is placed on buyers so
that
Qd = 400 – 2(P + T).
If T = 15, solve for the new equilibrium price and quantity. (Note: P is the price received by sellers and P + T
is the price paid by buyers.) Compare these answers for equilibrium price and quantity with your first answers.
What does this show you?
88 ❖ Chapter 8/Application: The Costs of Taxation
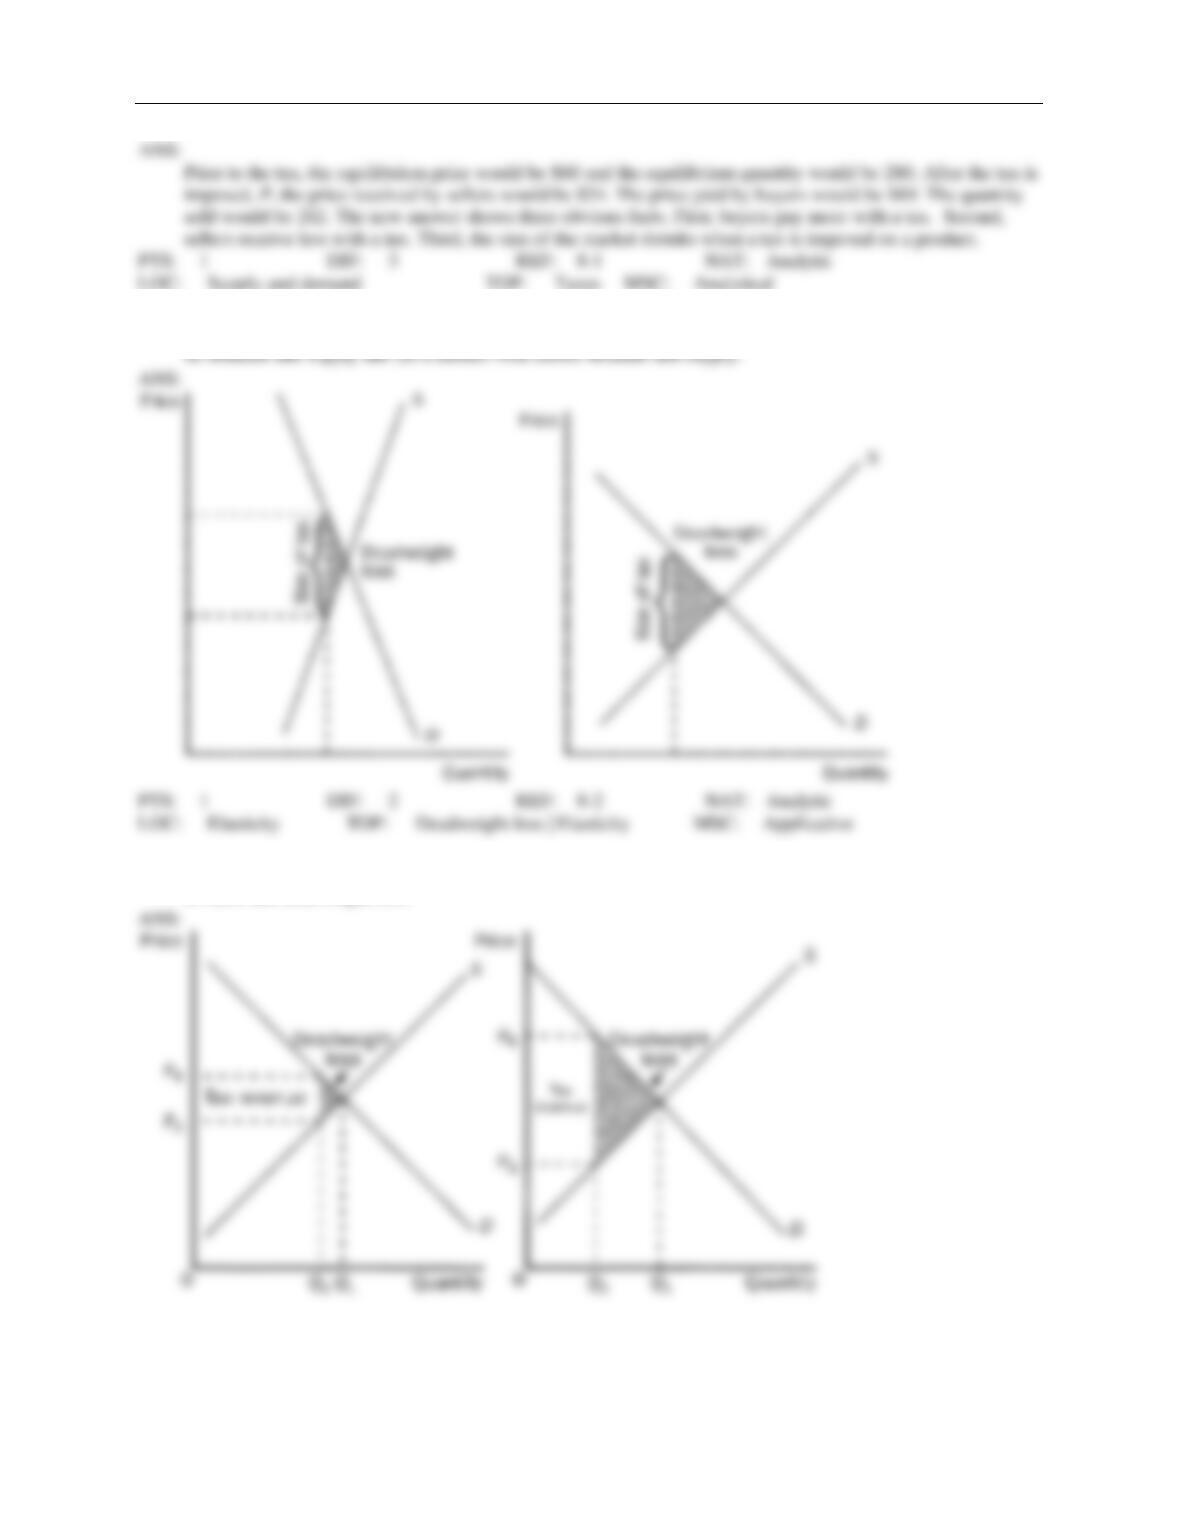
5. Using demand and supply diagrams, show the difference in deadweight loss between (a) a market with inelas-
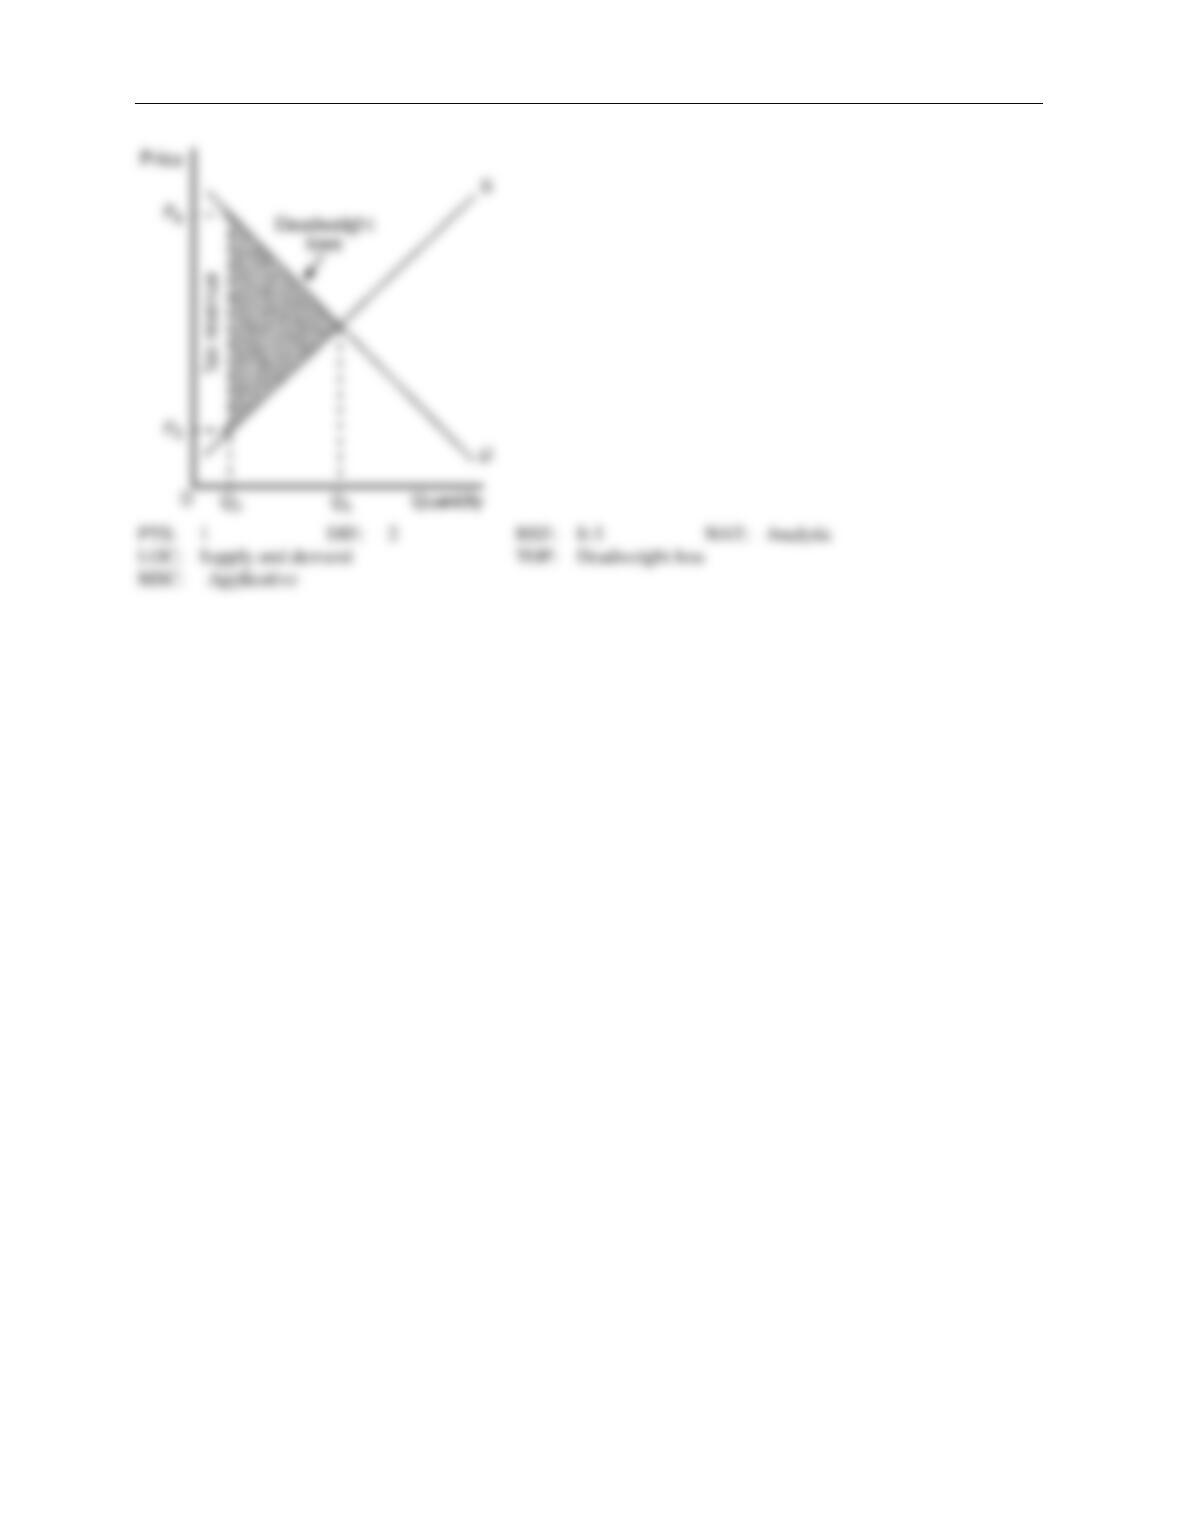
6. Illustrate on three demand-and-supply graphs how the size of a tax (small, medium and large) can alter total
revenue and deadweight loss.
Chapter 8/Application: The Costs of Taxation ❖ 89