Multiple Choice Questions
1. ______ is the cost of inputs whose use does not vary as the firm’s output changes.
D. Explicit cost
2. A ______ cost is ______ if the firm doesn’t incur the cost if it produces no output.
A. fixed; sunk
3. A ______ cost is ______ if the firm incurs the cost even if it produces no output.
A. fixed; sunk
4. If
Q
represents a firm’s level of output,
W
represents the wage paid to labor (
L
) and
R
is
the cost of capital (
K
), then which of the following represents the firm’s cost function?
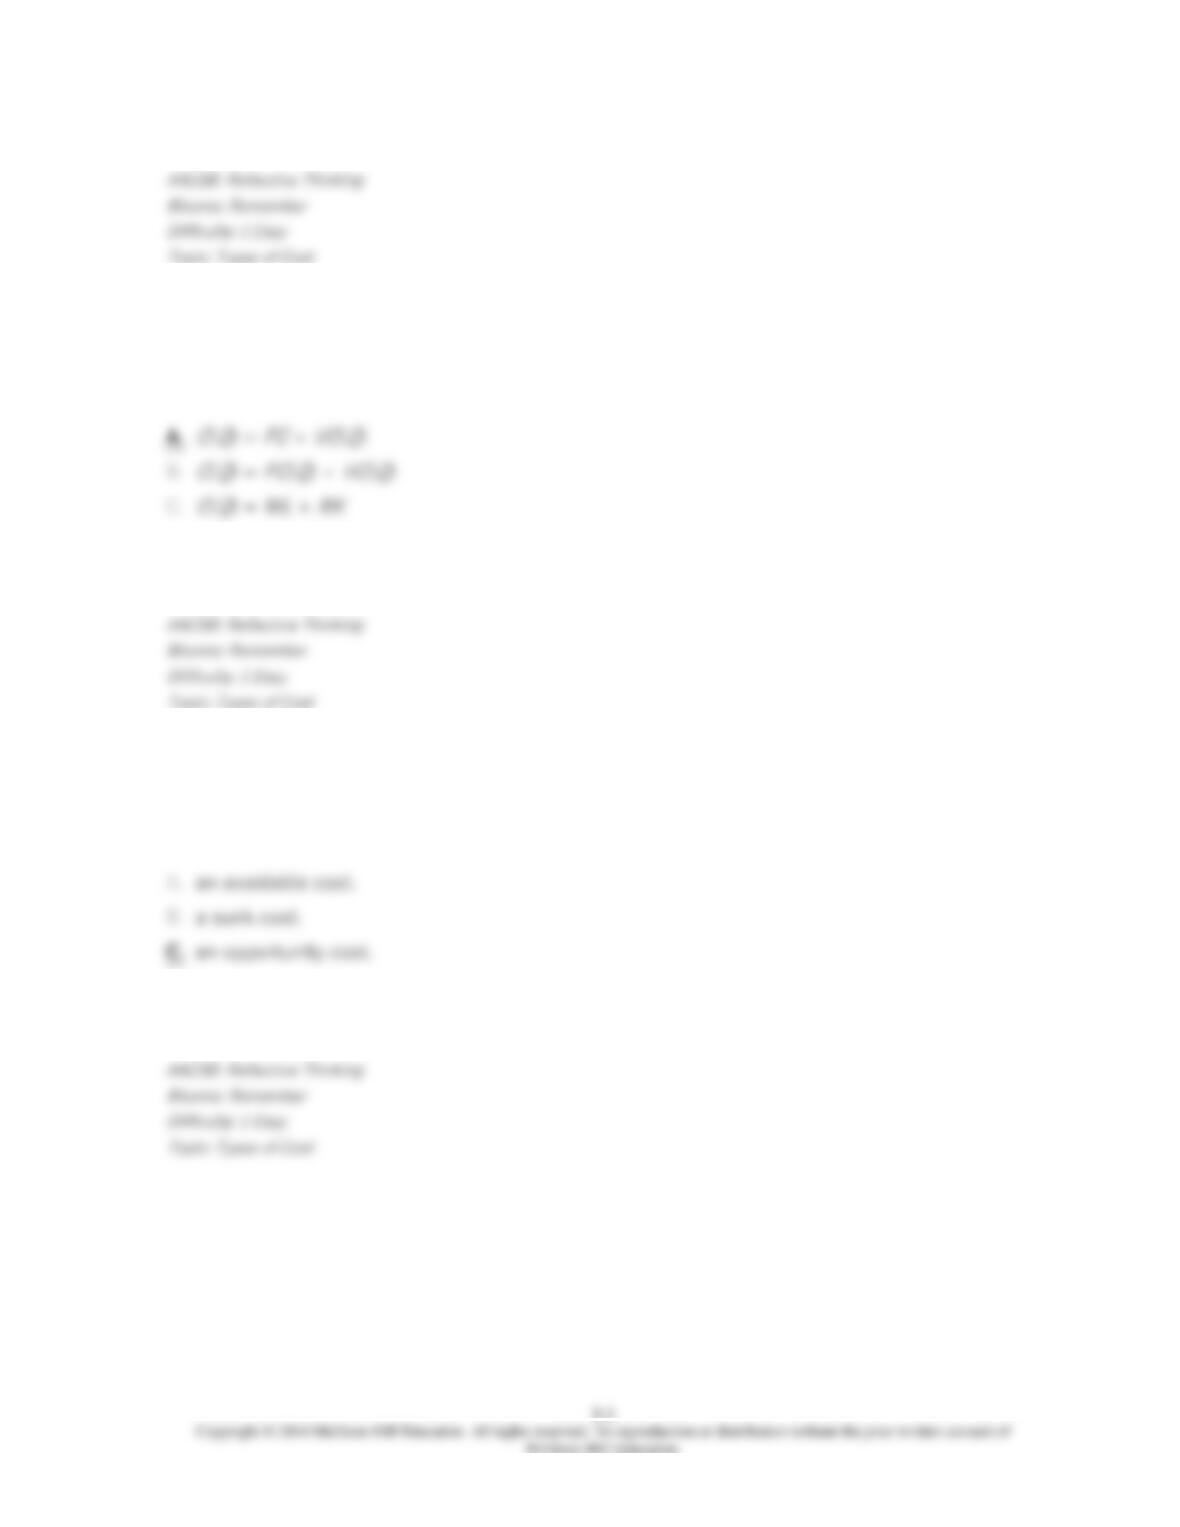
D.
C
(
Q
) = (
W
+
R
)
Q
5. The cost associated with foregoing the opportunity to employ a resource in its best
alternative use is called:
D. the user cost of capital.
6. The strategy whereby a firm makes most of its own inputs is called:
A. economies of scope.
7. The cost of using capital is equal to the market rental price as long as:
A. a firm rents all of the capital used in its production process.
8. Suppose a firm’s short-run production function is given by
Q
= F(
L
) = 4
L
. If the wage rate
is $12 and the firm has sunk costs of $300, then the firm’s variable cost function is:
A.
VC
(
Q
) = $12
Q
.
9. Suppose a firm’s short-run production function is given by
Q
= F(
L
) = 4
L
. If the wage rate
is $12 and the firm has sunk costs of $300, then the firm’s cost function is:
A.
C
(
Q
) = $12
L
.
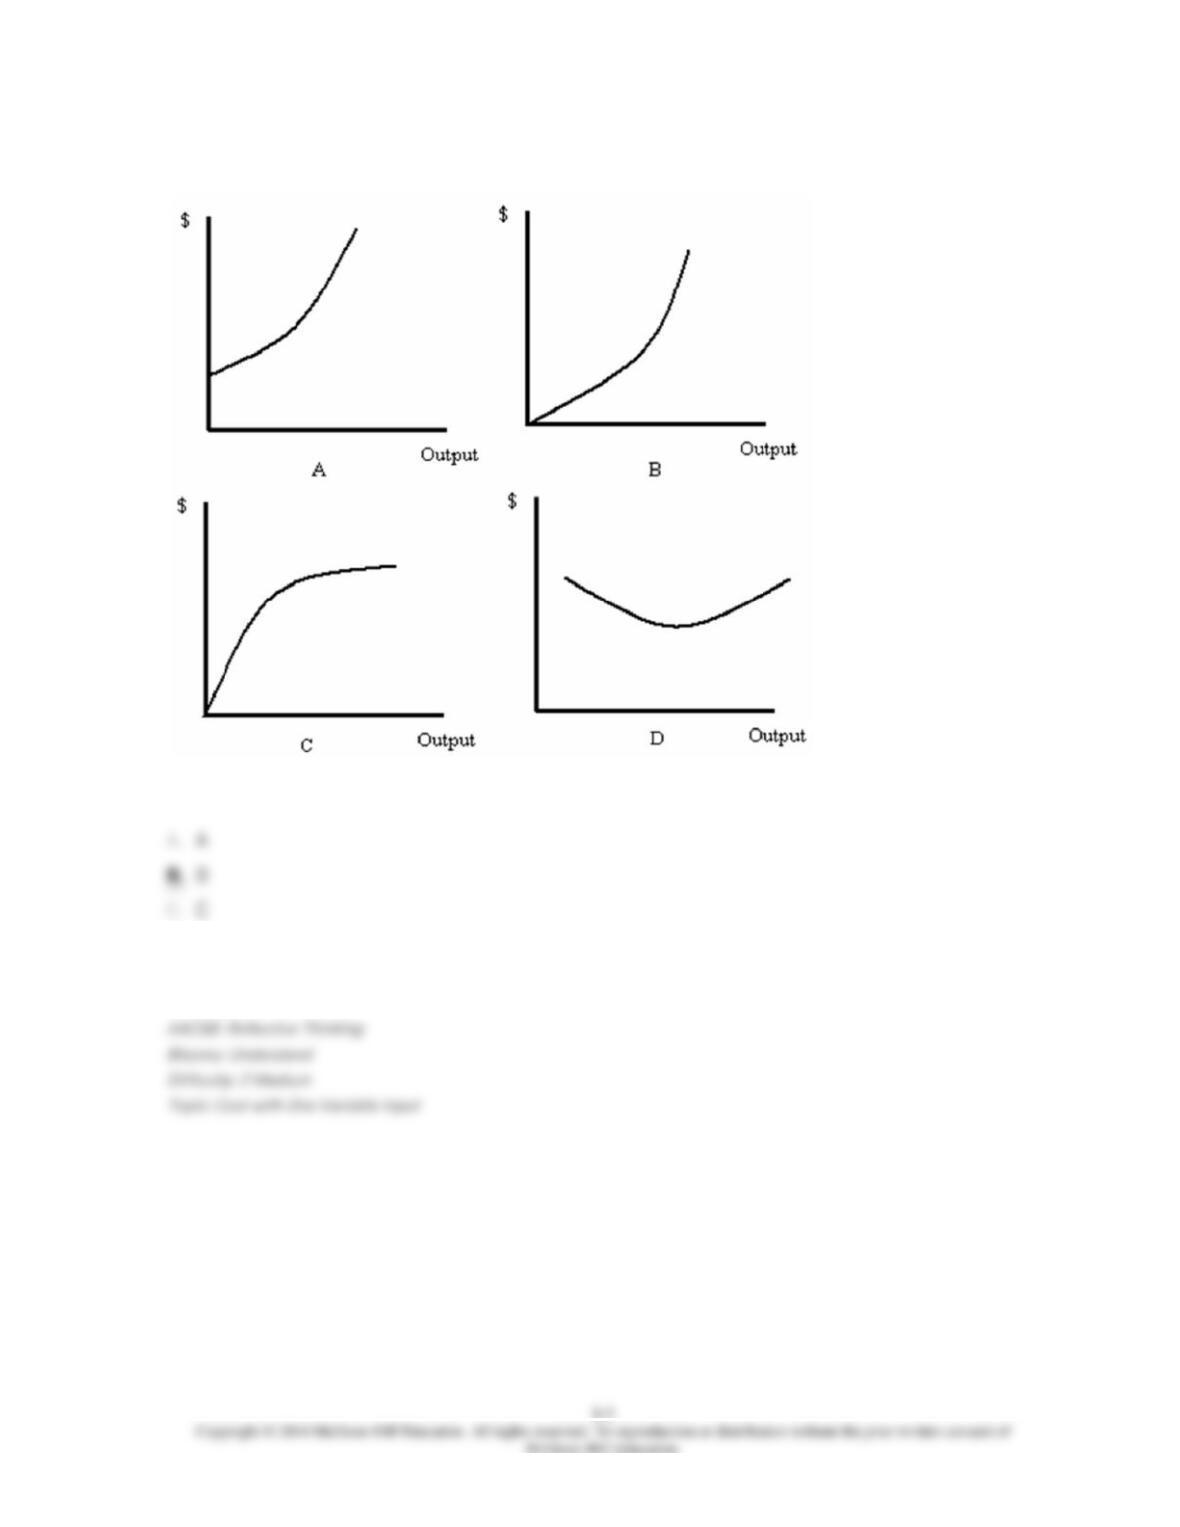
10. Refer to Figure 8.1. Which graph best represents a variable cost function?
D. D
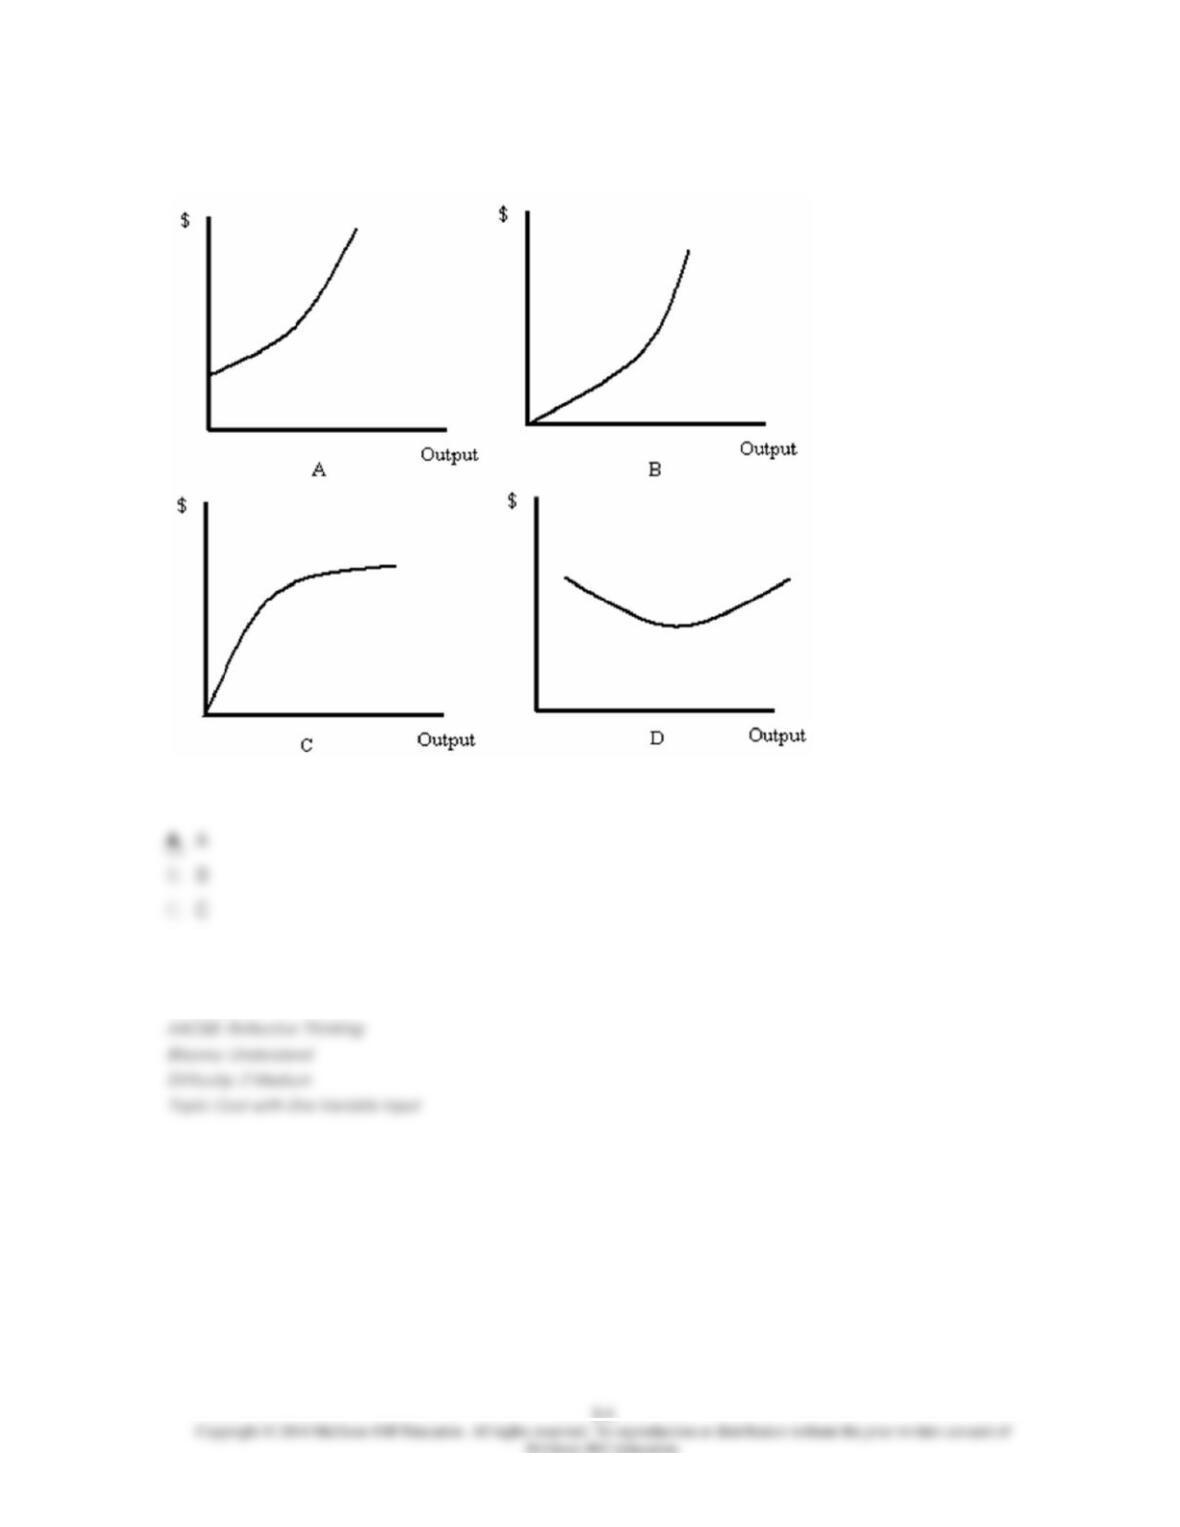
11. Refer to Figure 8.1. Which graph best represents a total cost function?
D. D
12. A firm’s ______ connects all the input combinations with the same price.
A. cost function
13. If
Q
represents a firm’s level of output,
W
represents the wage paid to labor (
L
) and
R
is
the cost of capital (
K
), then which of the following represents the firm’s isocost line?
A.
C
=
FC
+
VC
(
Q
)
14. Isocost lines associated with ______ total cost lie ______ the origin.
D. sunk; closer to
15. The slope of an isocost line is equal to:
D. (rental rate of capital/wage rate).
16. Suppose a firm’s total cost of production is $40,000 per week, the wage rate is $1,000 per
week and the cost of capital is $2,000. Which of the following gives the equation for the firm’s
isocost line?
A.
L
= 20 – 0.5
K
17. Suppose a firm’s current total cost of production is $50,000 per week, the wage rate is
$1,000 per week and the cost of capital is $2,500. Which of the following gives the general
equation for the firm’s isocost lines for total cost
C
?
A.
C
= 20 – 0.5
L
18. An input combination is an interior choice if and only if:
D. satisfies the tangency condition.
19. Suppose the marginal rate of technical substitution for labor with capital is 5, the marginal
product of labor is 8, and the marginal product of capital is 4. Assuming the law of diminishing
marginal product applies to both labor and capital, this firm:
D. could reduce the cost of producing the output by reducing workers and capital by the same
proportion.
20. If the least-cost input combination doesn’t include all inputs, it’s called:
D. an efficient solution.
21. Suppose that
MPL
= 50 and
MPK
= 30. If
W
= 25 and
R
= 10, then a firm:
A. is producing its output at the lowest possible cost.
22. Suppose that
MPL
= 100 and
MPK
= 80. If
W
= 25 and
R
= 20, then a firm:
D. could minimize costs by employing more of both inputs.
23. Suppose that
MPL
= 20 and
MPK
= 21. If
W
= 10 and
R
= 11, then a firm:
D. could minimize costs by employing more of both inputs.
24. Suppose that
MPL
= 200 and
MPK
= 240. If
R
= 30, then at which of the following wages
would the firm want to hire fewer workers and more capital?
A.
W
= 23
25. Suppose that labor is measured on the horizontal axis and capital is measured on the
vertical axis. At an interior solution:
D.
MRTALK
= –
PK/PL
.
26. Whenever a firm uses input X but not input Y, then at the chosen input combination:
D.
MRTSXY
= –
PX
/
PY
.
27. A firm’s ______ shows the least-cost input combinations at all possible levels of output for
fixed input prices.
D. efficient production frontier
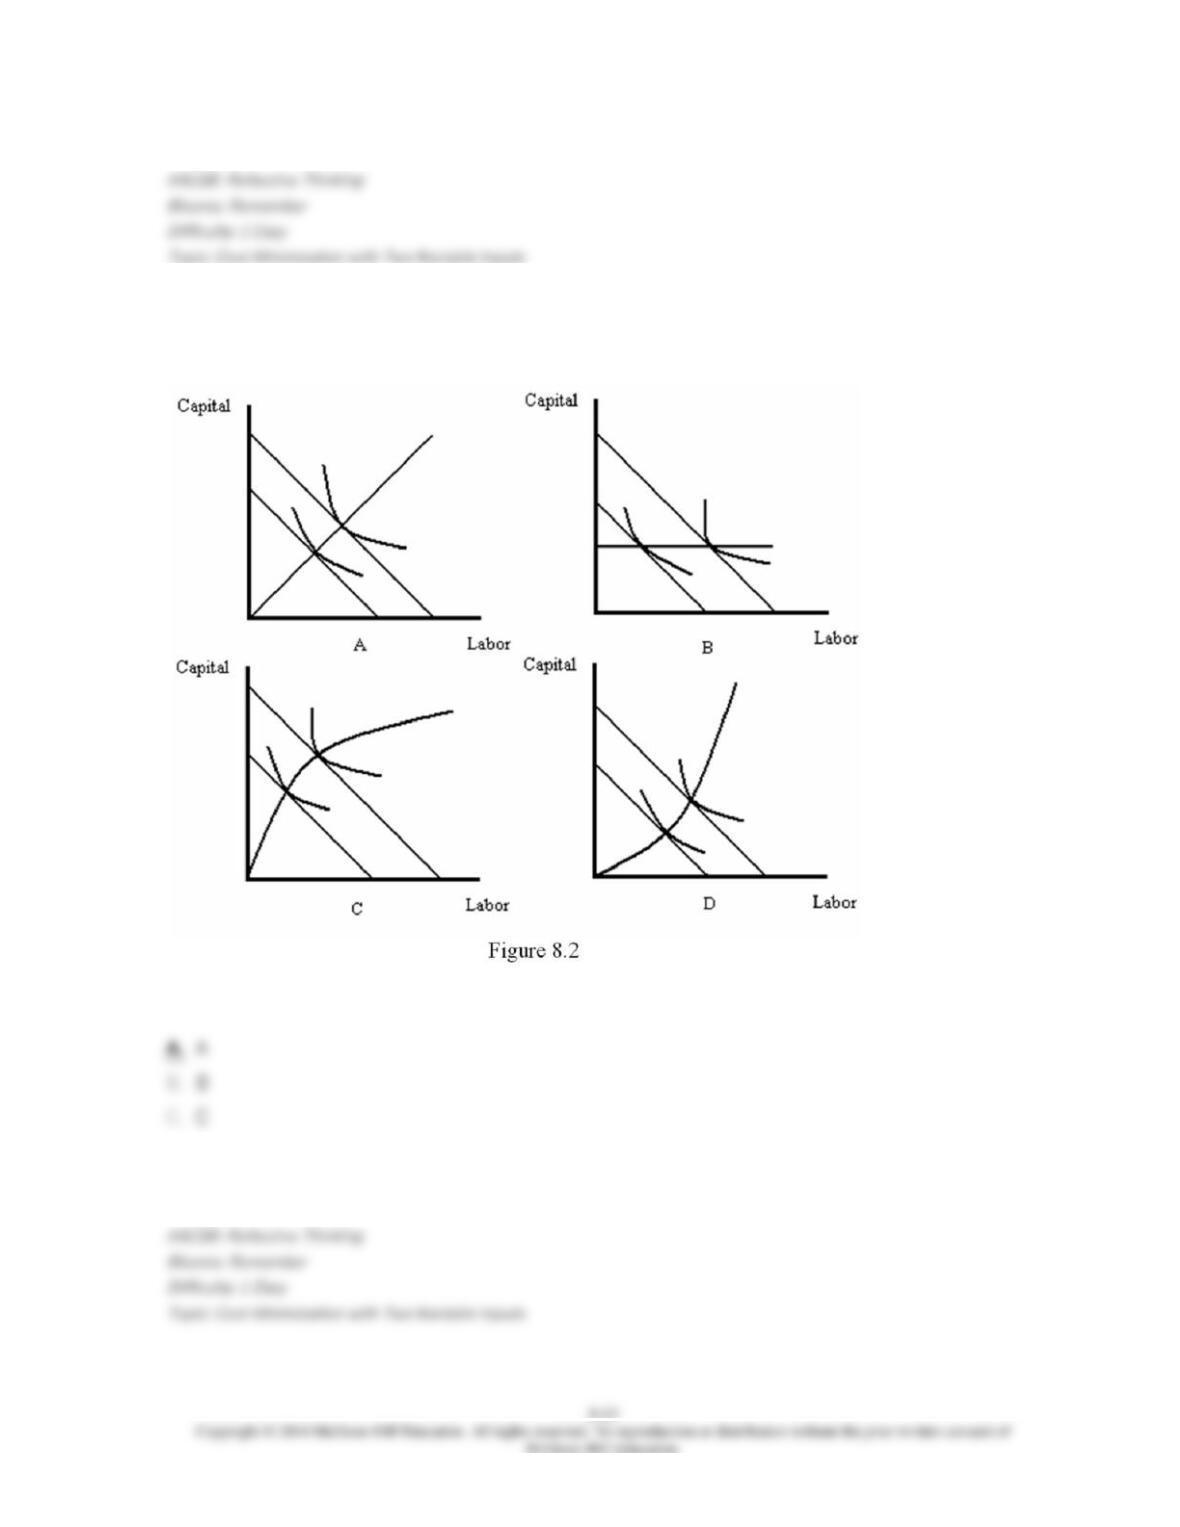
28. Refer to Figure 8.2. Which graph illustrates an output expansion path with a constant
capital-labor ratio?
D. D
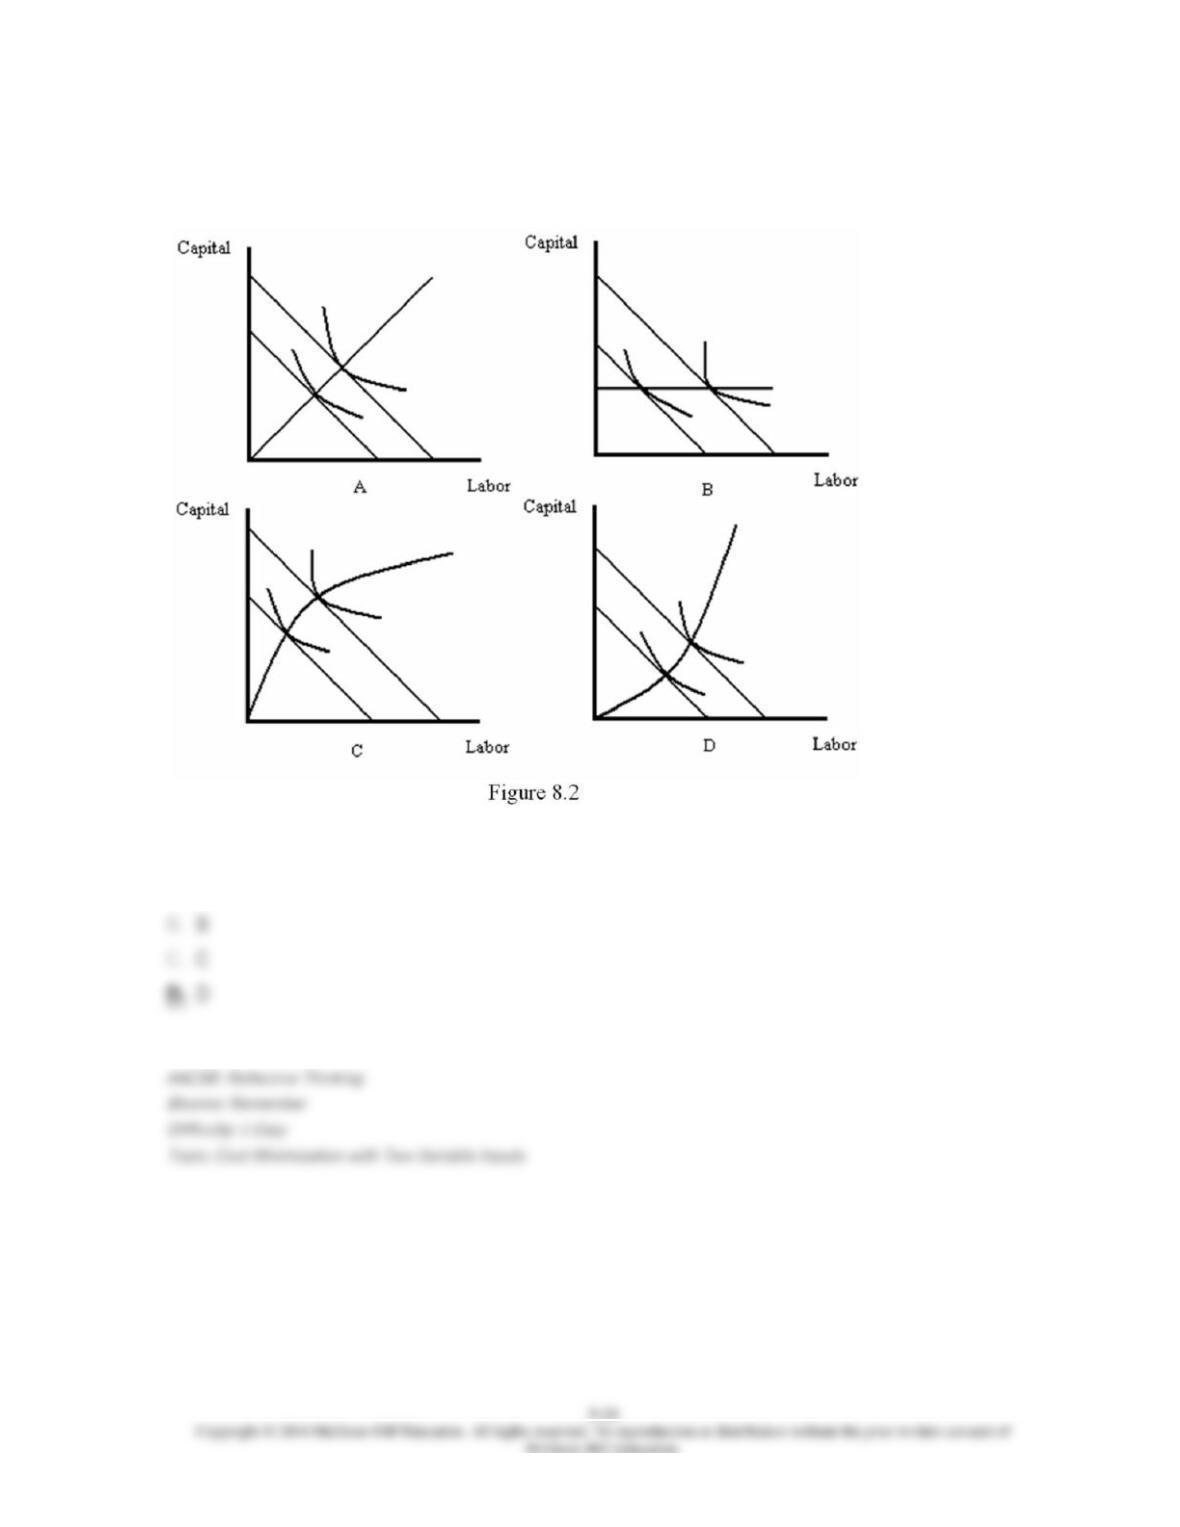
29. Refer to Figure 8.2. Which graph illustrates an output expansion path with an increasing
capital-labor ratio?
A. A
30. Suppose a firm has a Cobb-Douglas weekly production function
Q
=
F
(
L
,
K
) = 25
L
0.5
K
0.5,
where
L
is the number of workers and
K
is units of capital. The wage rate is $900 per week, and a
unit of capital costs $400 per week. What is the least-cost input combination for producing 675
units of output?
D.
L
= 27;
K
= 27
31. Suppose a firm has a Cobb-Douglas weekly production function
Q
=
F
(
L
,
K
) = 25
L
0.5
K
0.5,
where
L
is the number of workers and
K
is units of capital. The wage rate is $900 per week, and a
unit of capital costs $400 per week. Assuming no fixed costs, what is the firm’s total cost of
production if it uses least-cost input combination to produce 675 units of output?
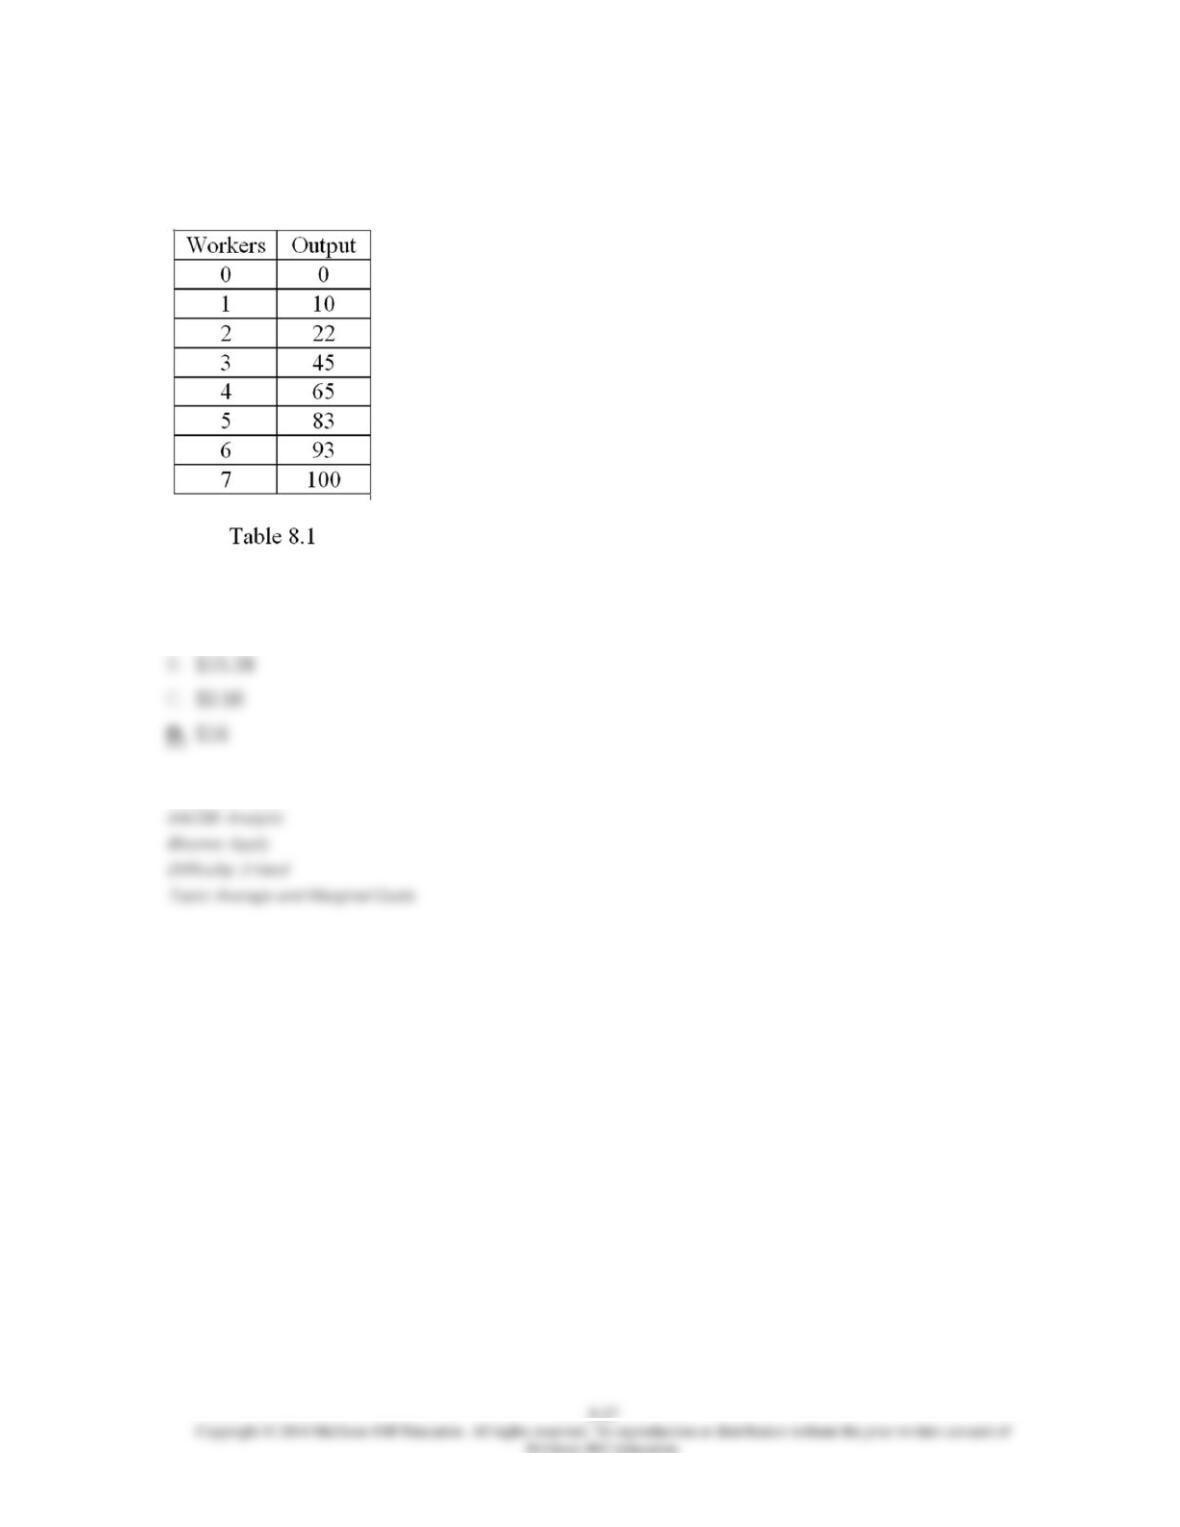
A. $48,600
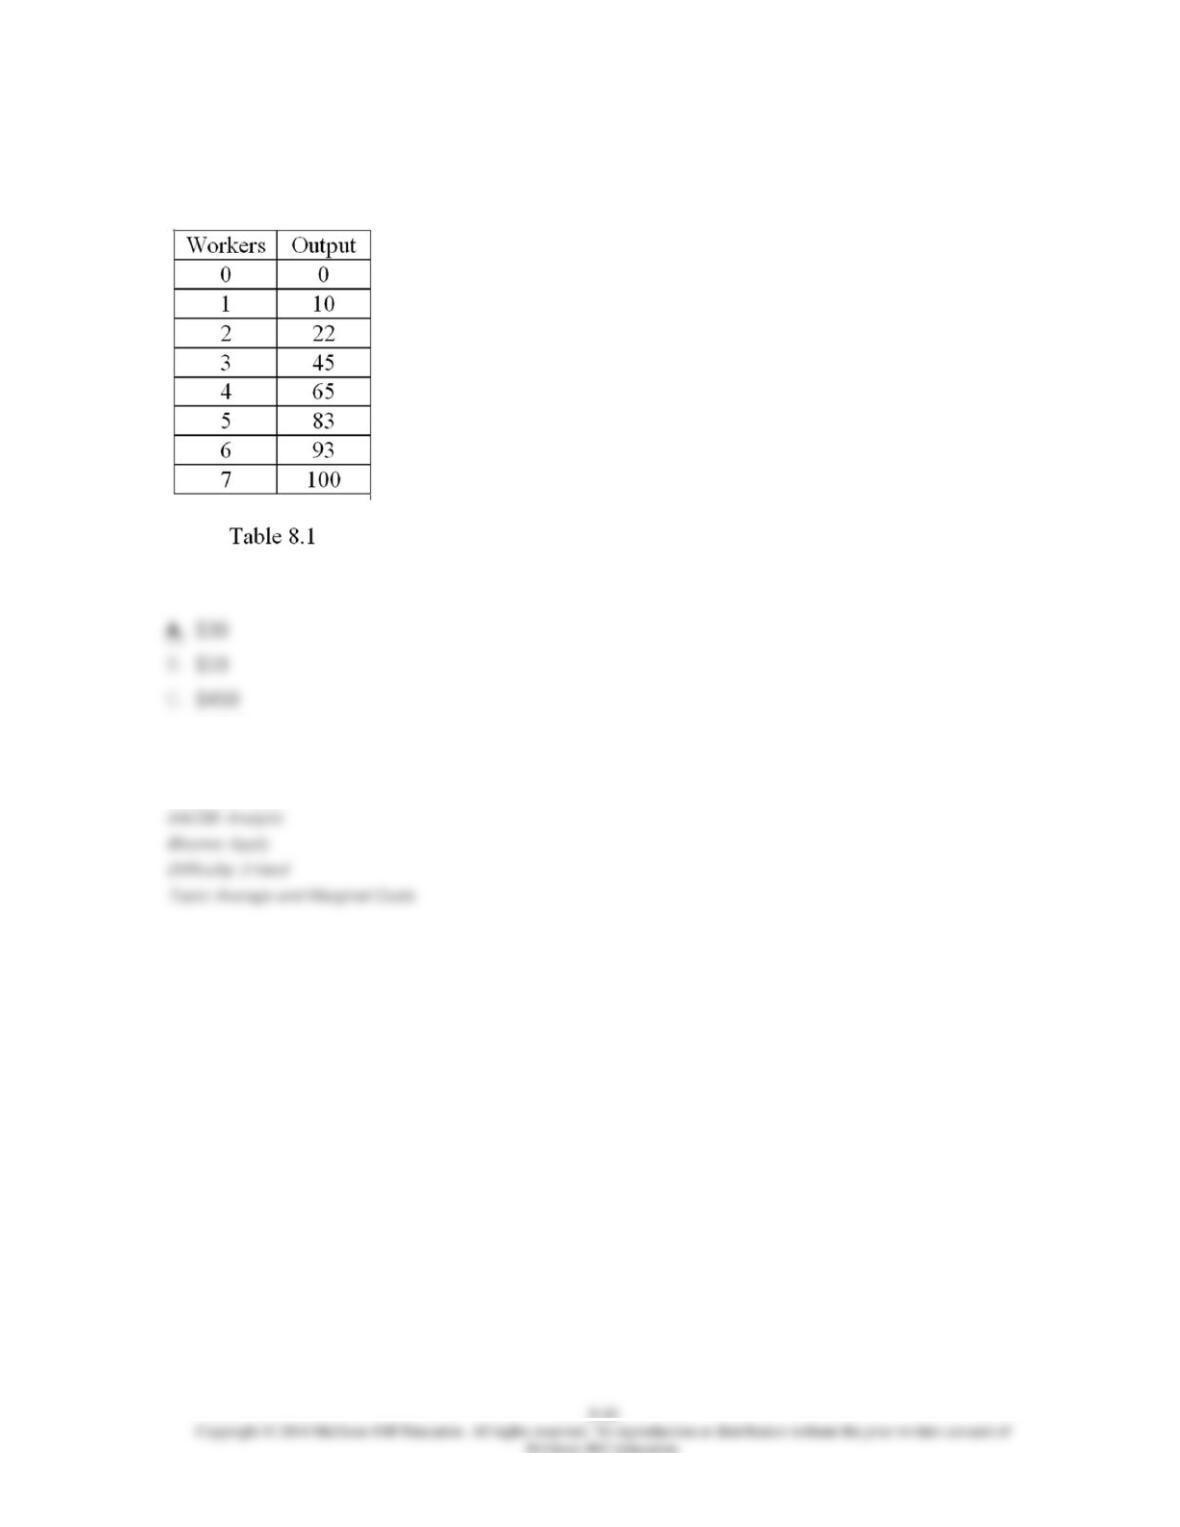
32. Refer to Table 8.1. Assume the wage rate is $10 and the firm has $1,000 in unavoidable
fixed cost. What is the variable cost of producing 45 units of output?
D. $22.22
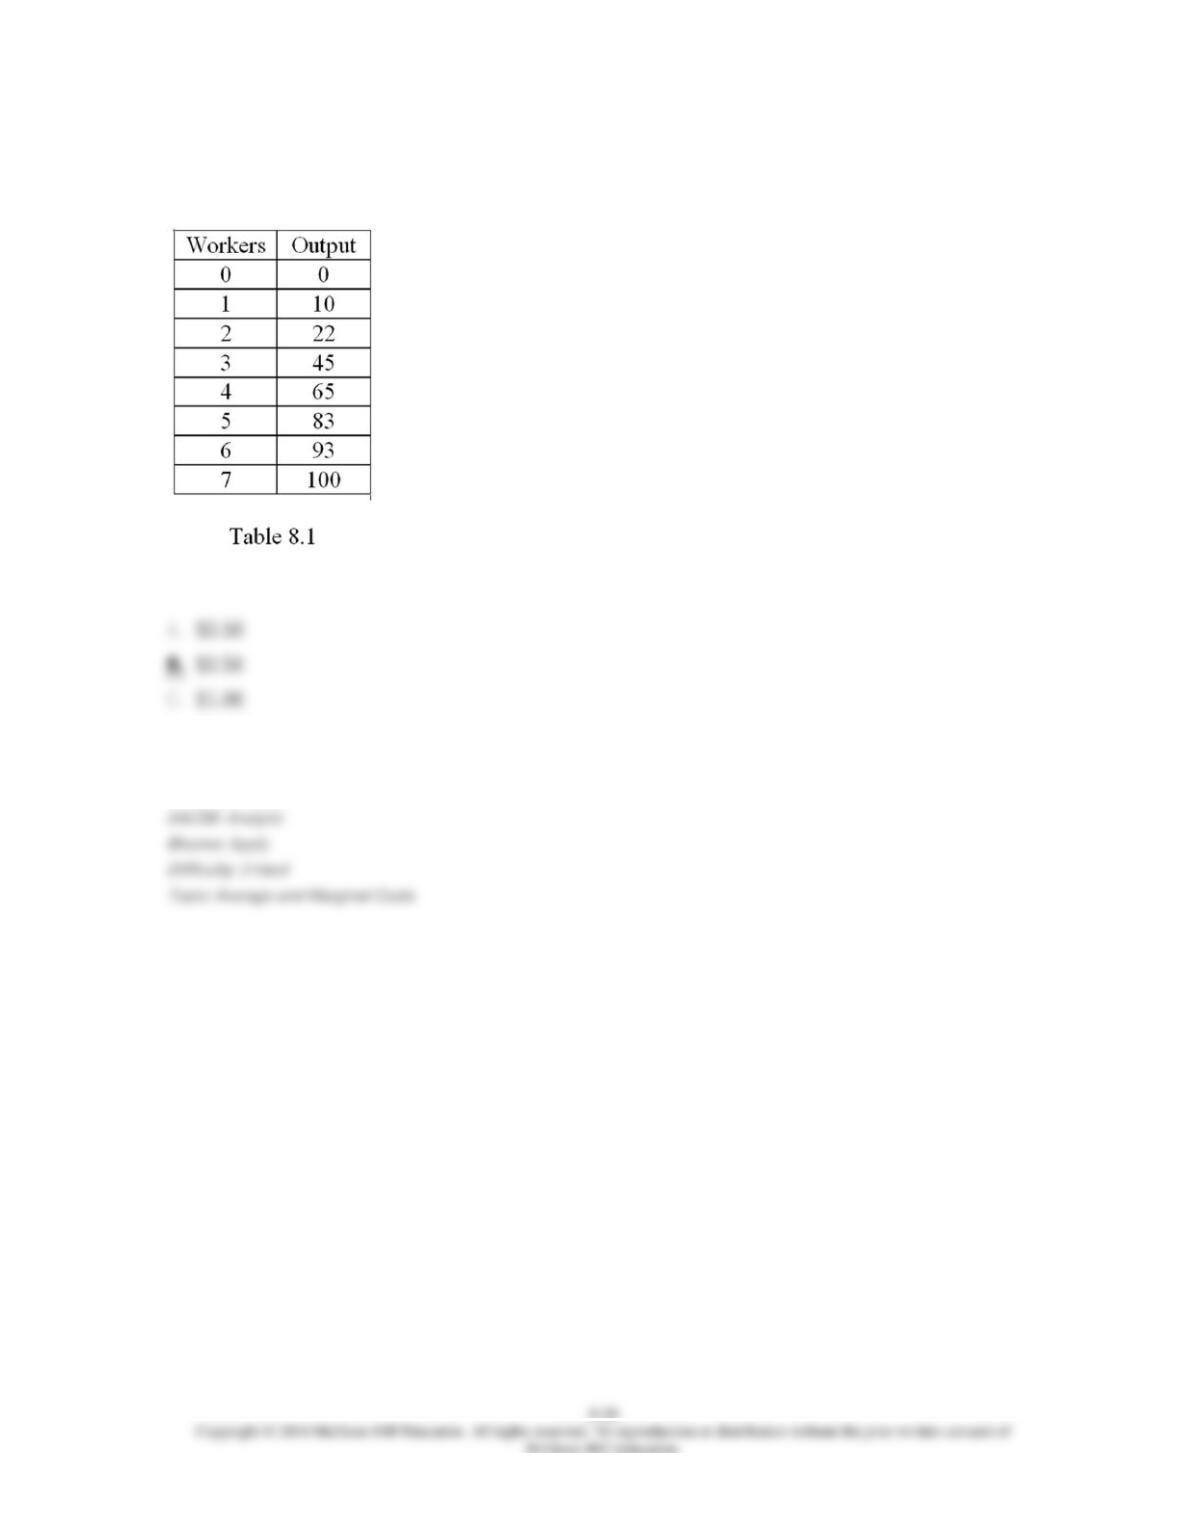
33. Refer to Table 8.1. Assume the wage rate is $10 and the firm has $1,000 in unavoidable
fixed cost. What is the average cost of producing 65 units of output?
A. $40
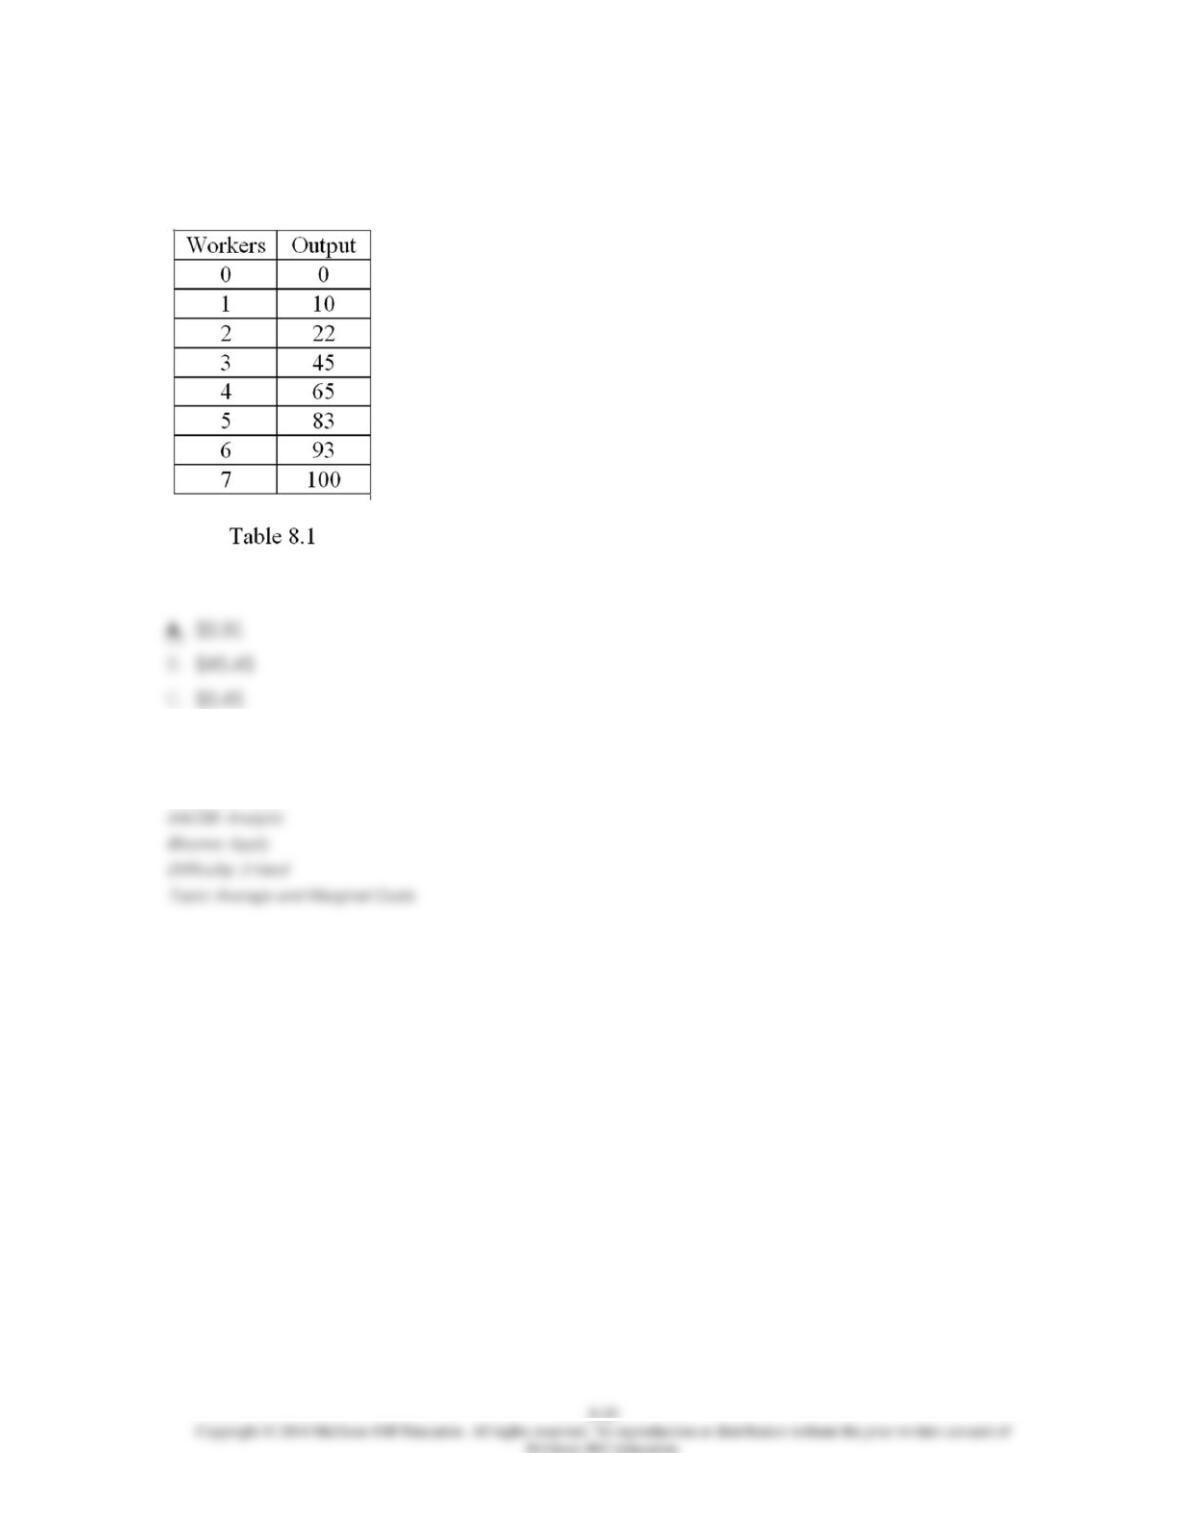
34. Refer to Table 8.1. Assume the wage rate is $10 and the firm has $1,000 in unavoidable
fixed cost. What is the marginal cost of the 83rd unit of output?
D. $1.43
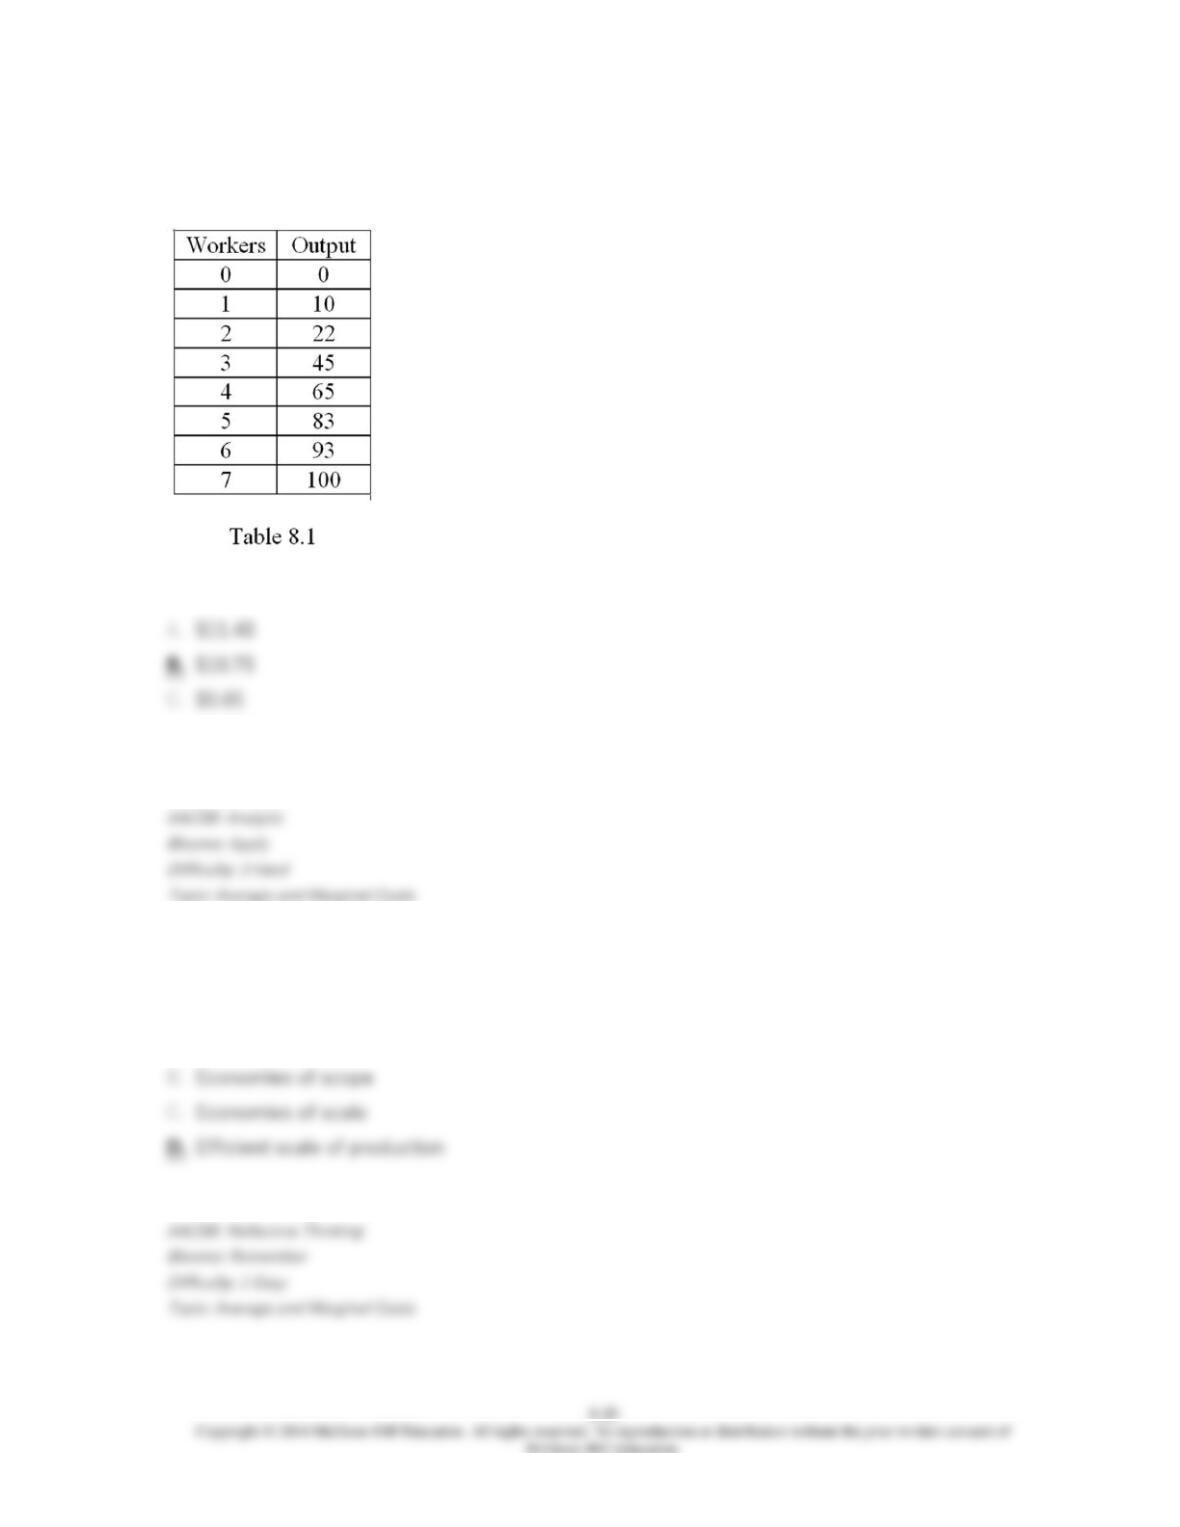
35. Refer to Table 8.1. Assume the wage rate is $10 and the firm has $1,000 in unavoidable
fixed cost. What is the average variable cost of producing 22 units of output?
D. $0.83
36. Refer to Table 8.1. Assume the wage rate is $10 and the firm has $1,000 in unavoidable
fixed cost. What is the average fixed cost of producing 93 units of output?
D. $10.00
37. ______ refers to the output level at which average cost is lowest.
A. Interior solution