Chapter 07 – Businesses and the Costs of Production
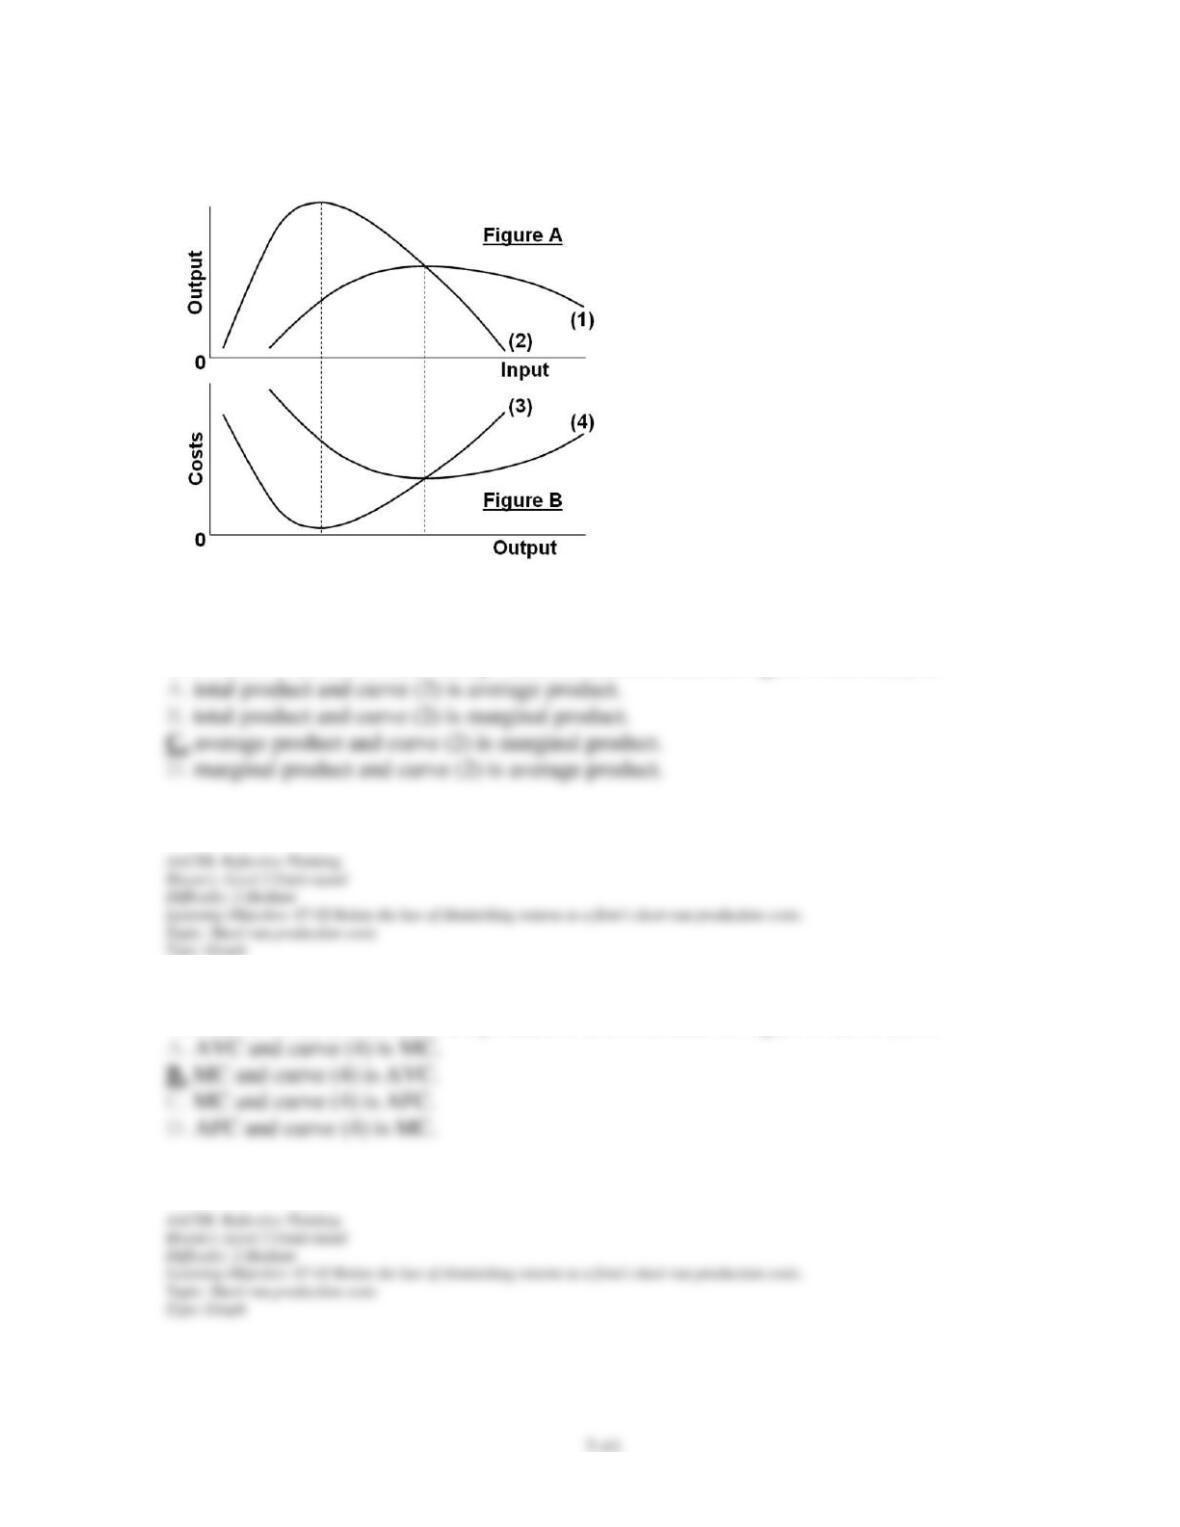
105. Refer to the above short-run production and cost data. In Figure A curve (1) is:
106. Refer to the above short-run production and cost data. In Figure B curve (3) is:
Chapter 07 – Businesses and the Costs of Production
107. Refer to the above short-run production and cost data. The curves of Figures A and B
suggest that:
108. In the short run:
109. As output increases, total variable cost:
Chapter 07 – Businesses and the Costs of Production
110. In the short run the Sure-Screen T-Shirt Company is producing 500 units of output. Its
average variable costs are $2.00 and its average fixed costs are $.50. The firm’s total costs:
111. Because the marginal product of a variable resource at first increases and then decreases
as the output of the firm is increased:
112. Suppose that, when producing 10 units of output, a firm’s AVC is $22, its AFC is $5, and
its MC is $30. This:
Chapter 07 – Businesses and the Costs of Production
113. In comparing the changes in TC and TVC associated with an additional unit of output,
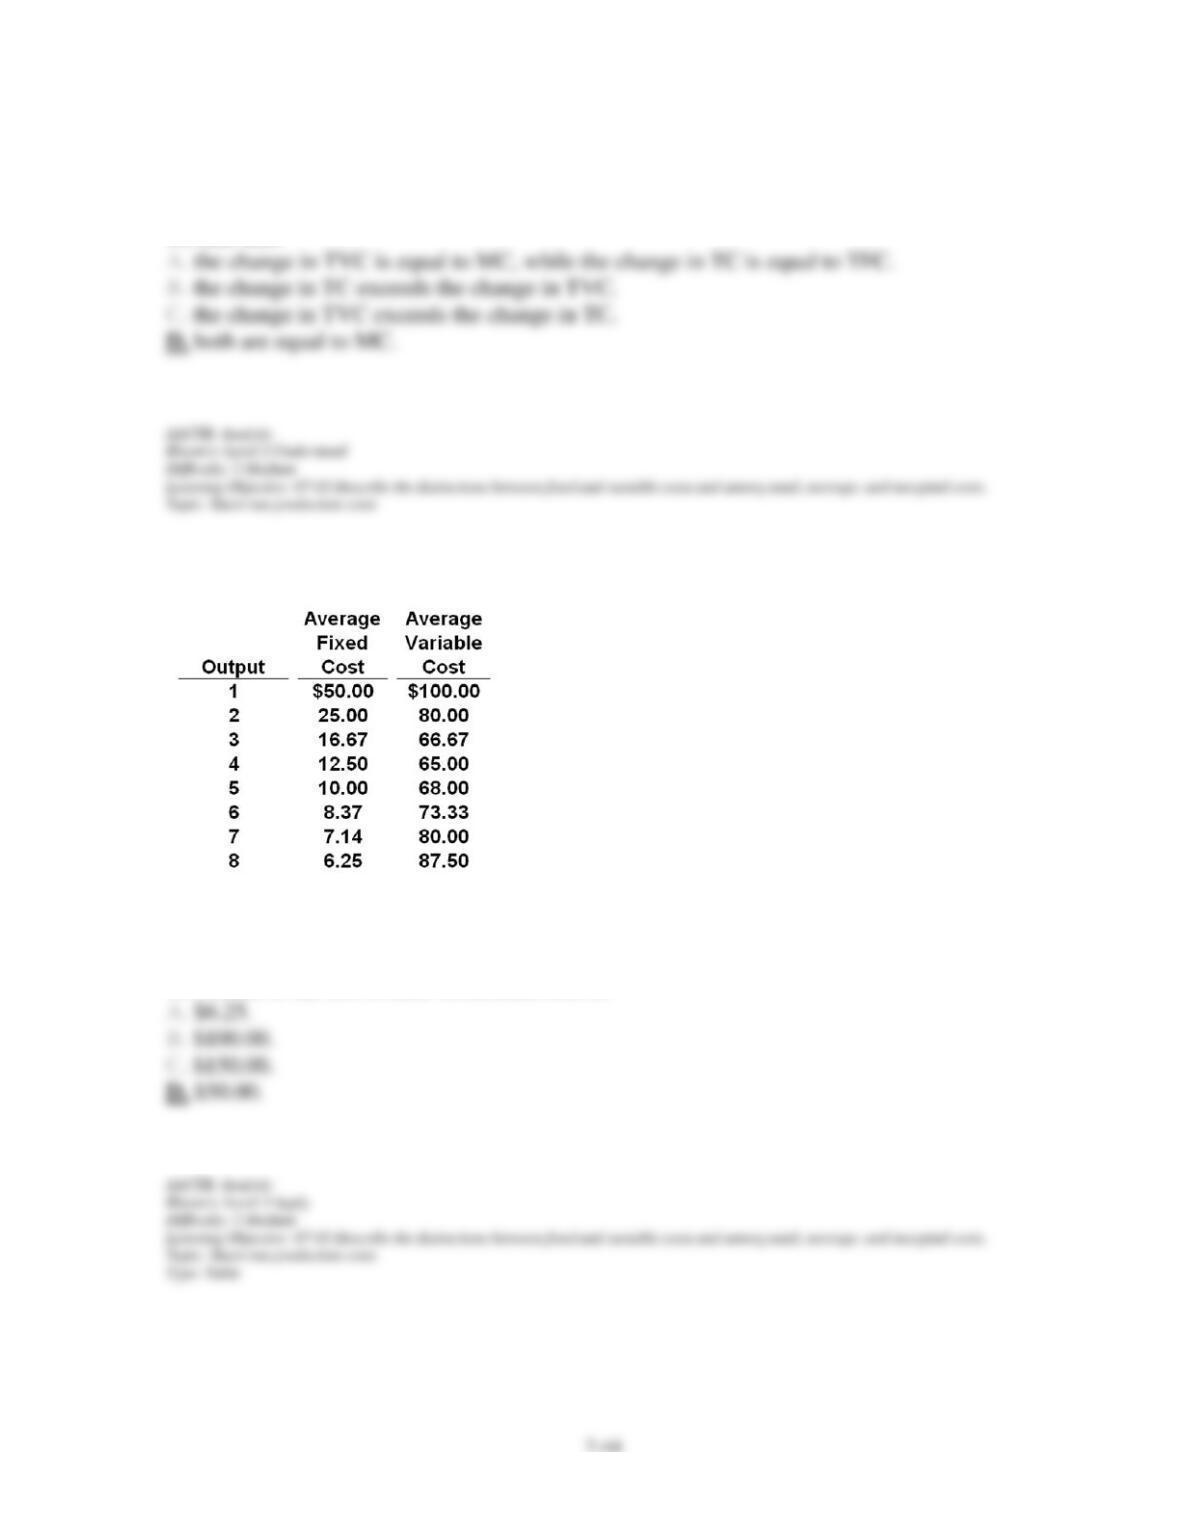
Answer the question on the basis of the following cost data:
114. Refer to the above data. Total fixed cost is:
Chapter 07 – Businesses and the Costs of Production
115. Refer to the above data. The average total cost of five units of output is:
116. Refer to the above data. The total cost of four units of output is:
117. Refer to the above data. If the firm closed down in the short run and produced zero units
of output, its total cost would be:
Chapter 07 – Businesses and the Costs of Production
118. Refer to the above data. The marginal cost of the fifth unit of output is:
119. Refer to the above data. The marginal cost curve would intersect the average variable
cost curve at about:
120. Other things equal, if the wage rates paid to a firm’s labor inputs were to rise, we would
expect the:
Chapter 07 – Businesses and the Costs of Production
121. If a technological advance increases a firm’s labor productivity, we would expect its:
122. Assume a firm closes down in the short run and produces no output. Under these
conditions:
123. If marginal cost is:
Chapter 07 – Businesses and the Costs of Production
7-48
124. If the total variable cost of 9 units of output is $90 and the total variable cost of 10 units
of output is $120, then:
125. The short-run average total cost curve is U-shaped because:
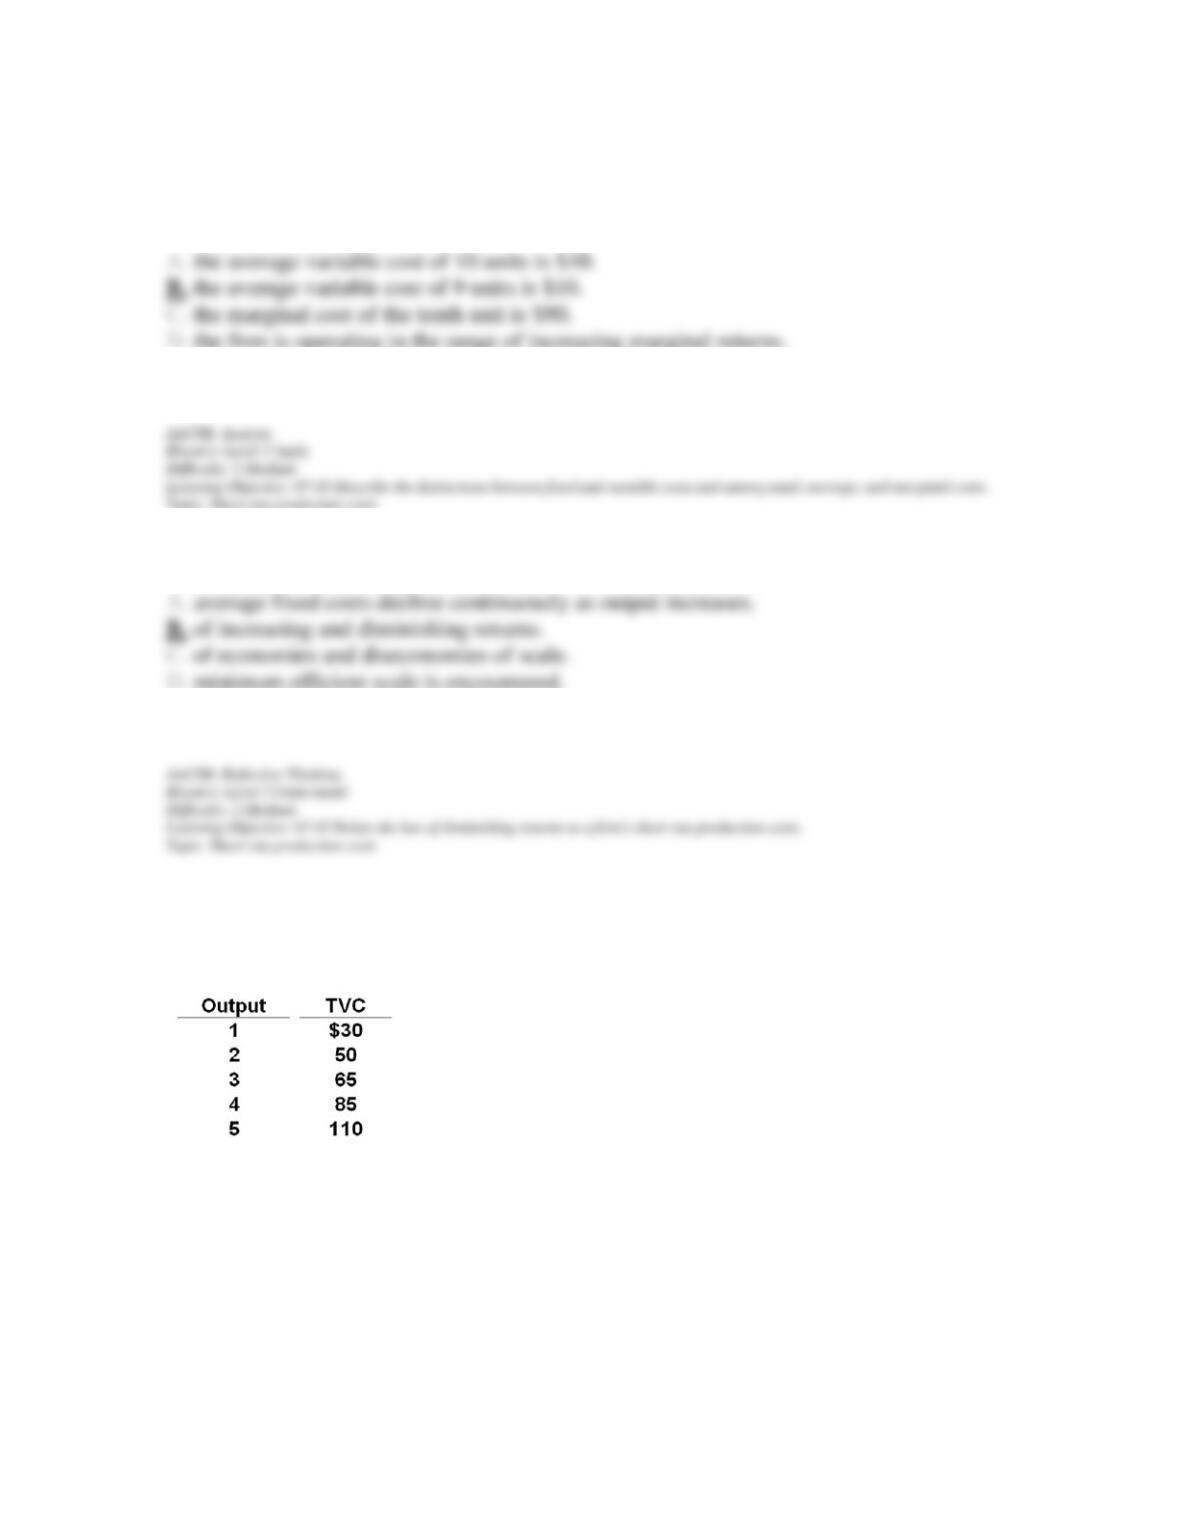
The Sunshine Corporation finds that its costs are $40 when it produces no output. Its total
variable costs (TVC) change with output as shown in the accompanying table. Use this
information to answer the following question(s).
Chapter 07 – Businesses and the Costs of Production
126. Refer to the above information. The total cost of producing 3 units of output is:
127. Refer to the above information. The average total cost of 3 units of output is:
128. Refer to the above information. The average fixed cost of 3 units of output is:
Chapter 07 – Businesses and the Costs of Production
129. Refer to the above information. The marginal cost of the third unit of output is:
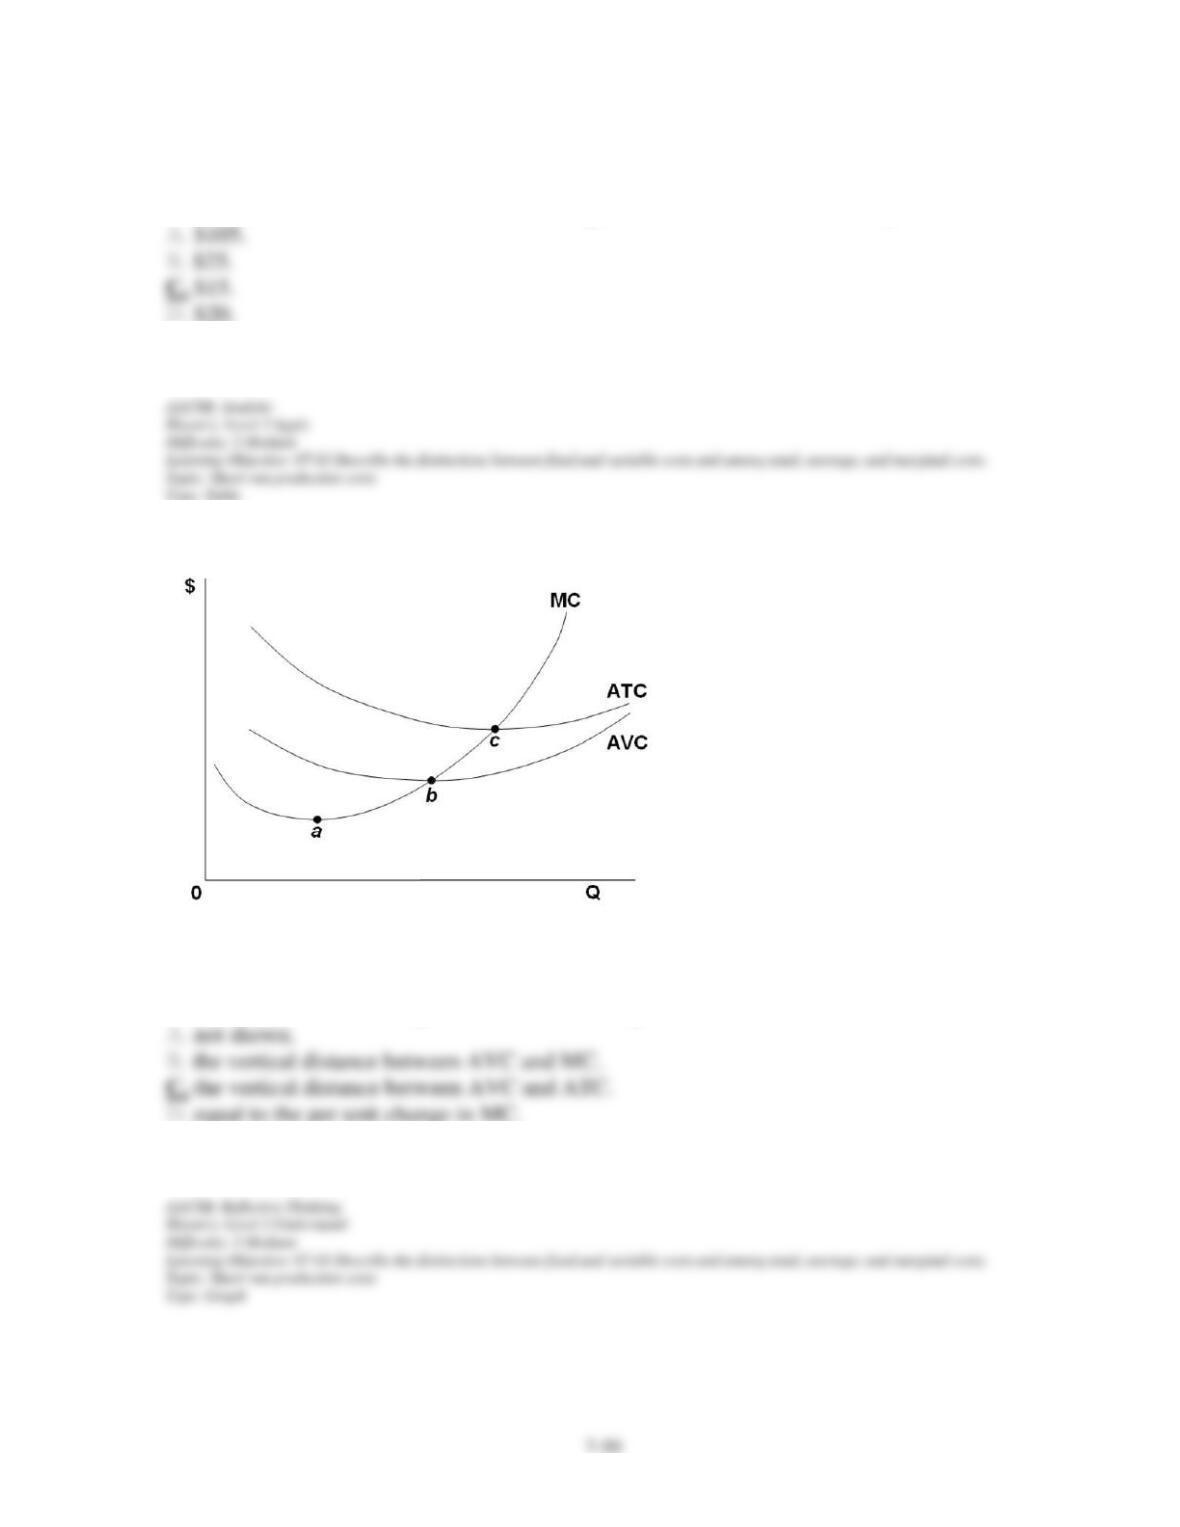
130. Refer to the above diagram. This firm’s average fixed costs are:
Chapter 07 – Businesses and the Costs of Production
131. Refer to the above diagram. If labor is the only variable input, the marginal product of
labor is at a:
132. Refer to the above diagram. If labor is the only variable input, the average product of
labor is at a:
133. Refer to the above diagram. The profit-maximizing level of output for this firm:
Chapter 07 – Businesses and the Costs of Production
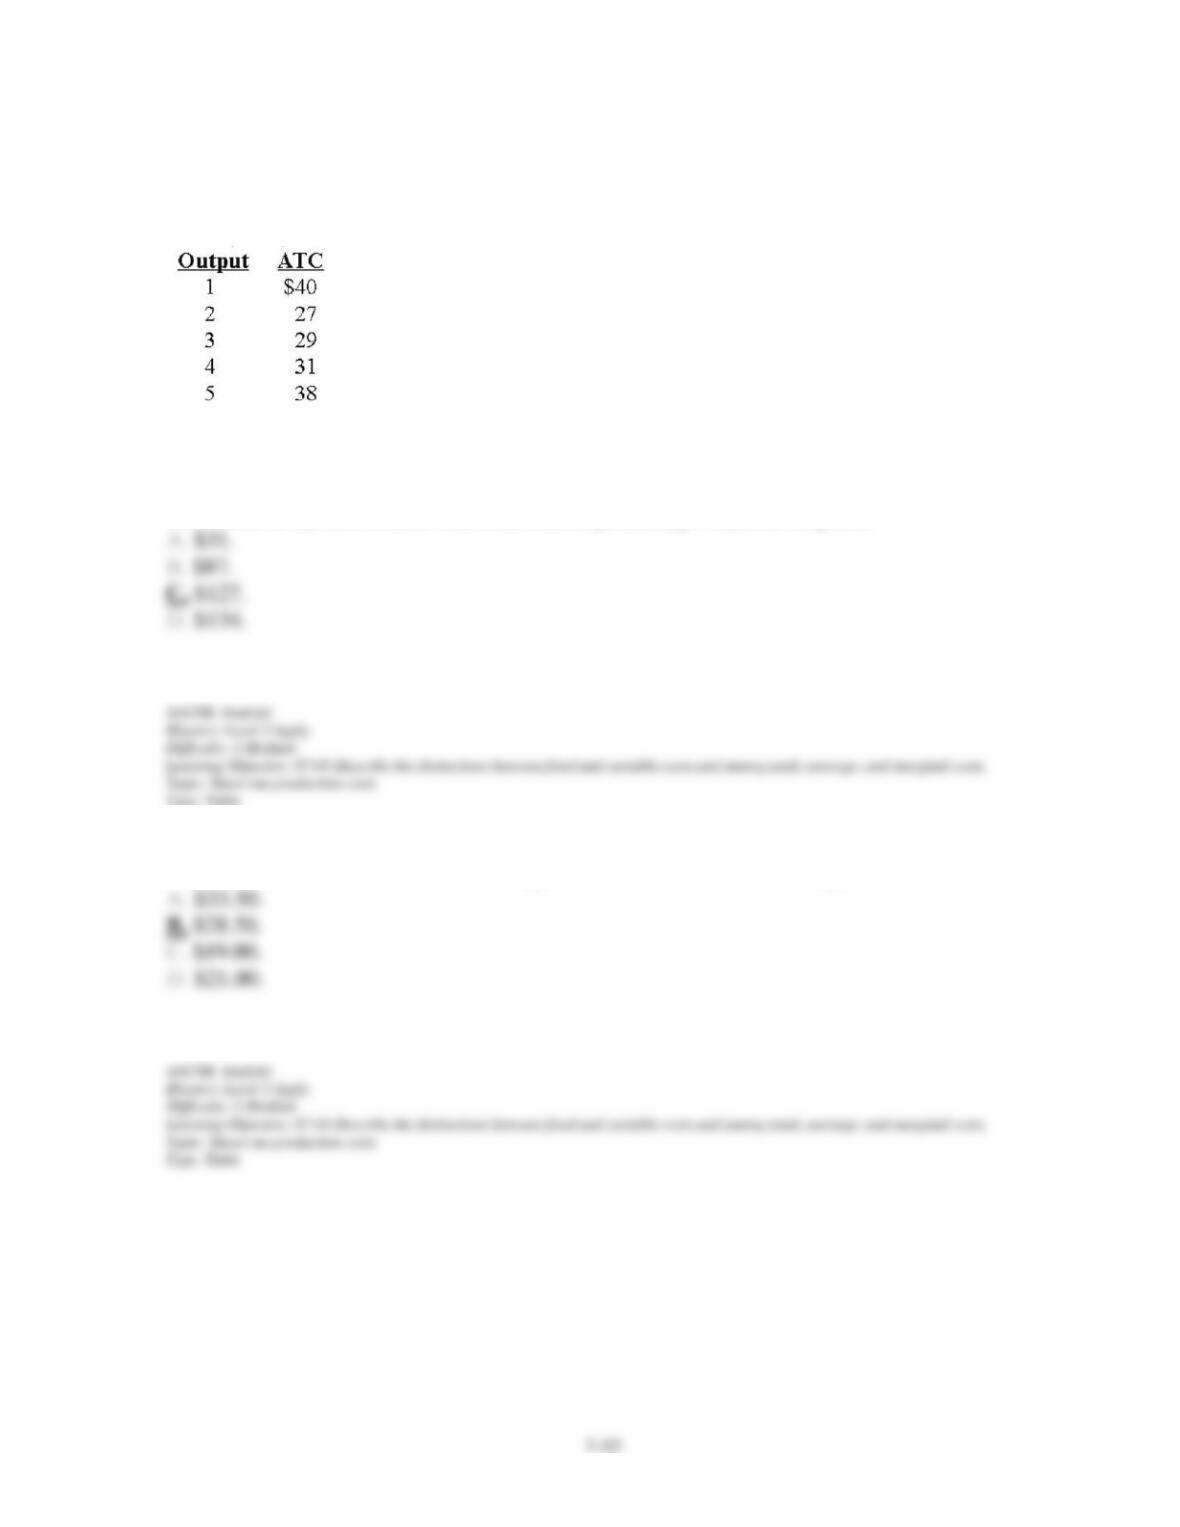
Answer the question on the basis of the accompanying table that shows average total costs
(ATC) for a manufacturing firm whose total fixed costs are $10:
134. Refer to the above data. The total cost of producing 4 units of output is:
135. Refer to the above data. The average variable cost of 4 units of output is:
Chapter 07 – Businesses and the Costs of Production
7-53
137. Refer to the above data. The profit-maximizing level of output for this firm:
Chapter 07 – Businesses and the Costs of Production
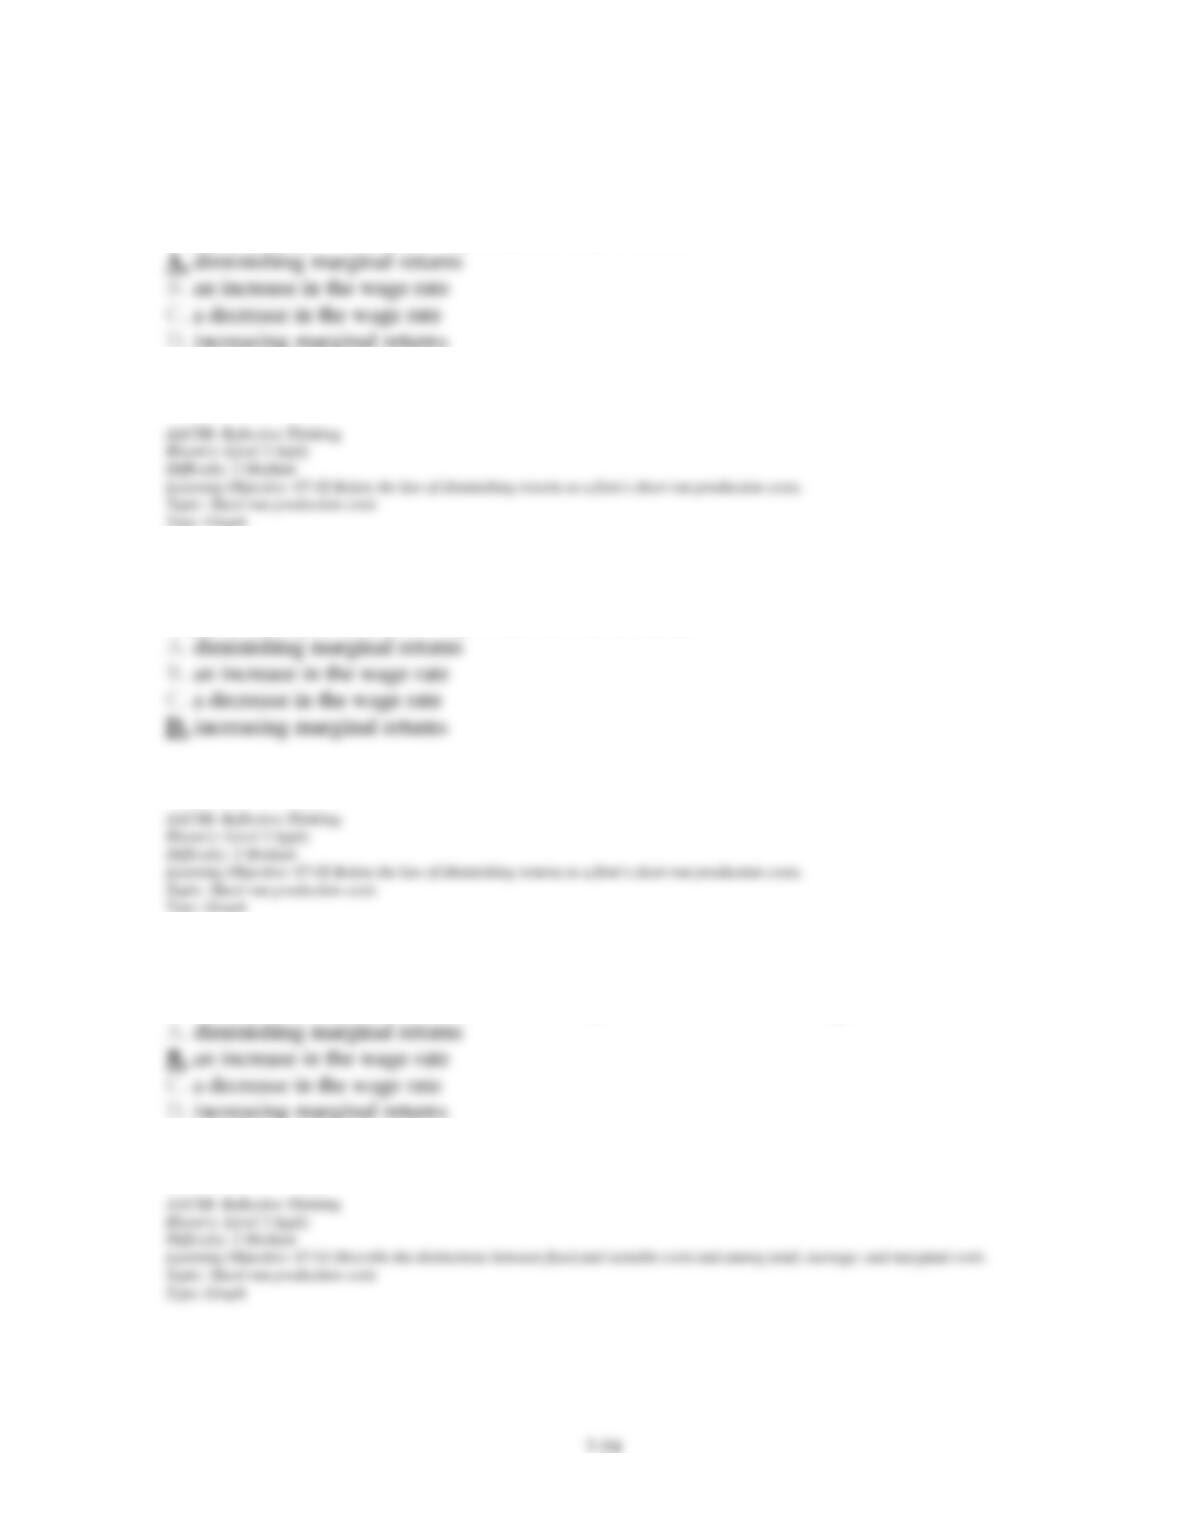
138. Refer to the above graph. Which one of the following would cause a move from point b
to point c along short-run average total cost curve ATC1?
139. Refer to the above graph. Which one of the following would cause a move from point d
to point e along short-run average total cost curve ATC2?
140. Refer to the above graph. Which one of the following would cause a move from point b
on short-run average total cost curve ATC1 to point e on short-run average cost curve ATC2?
Chapter 07 – Businesses and the Costs of Production
141. Refer to the above graph. Diminishing marginal returns are reflected in:
142. Refer to the above graph. A decrease in fixed costs is shown by:
143. Economies and diseconomies of scale explain:
Chapter 07 – Businesses and the Costs of Production
144. In the long run:
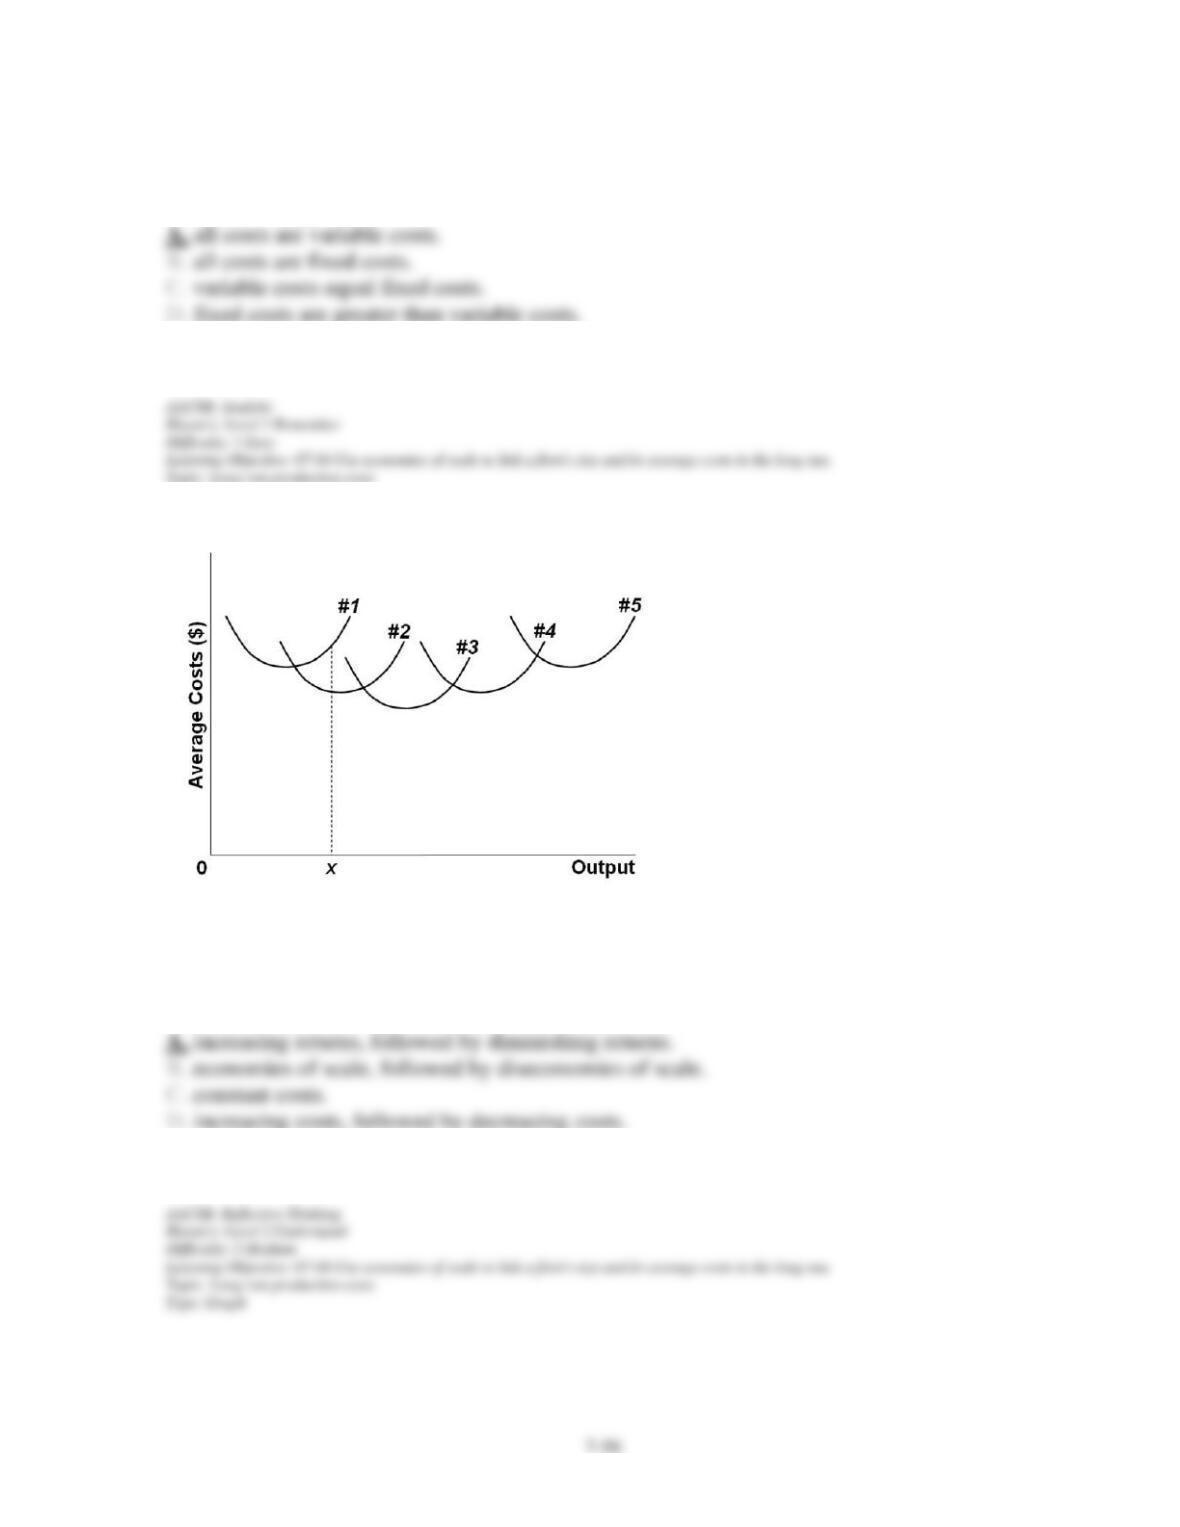
145. The above diagram shows the short-run average total cost curves for five different plant
sizes of a firm. The shape of each individual curve reflects:
Chapter 07 – Businesses and the Costs of Production
146. As the firm in the above diagram expands from plant size #1 to plant size #3, it
experiences:
147. As the firm in the above diagram expands from plant size #3 to plant size #5, it
experiences:
148. The above diagram shows the short-run average total cost curves for five different plant
sizes of a firm. The position of these five curves in relation to one another reflects: