Chapter 07 – Businesses and the Costs of Production
102. Over the range of output where the slope of the short-run total cost curve becomes
steeper:
103. At the level of output where marginal cost equals average variable cost:
104. Which statement is correct?
Chapter 07 – Businesses and the Costs of Production
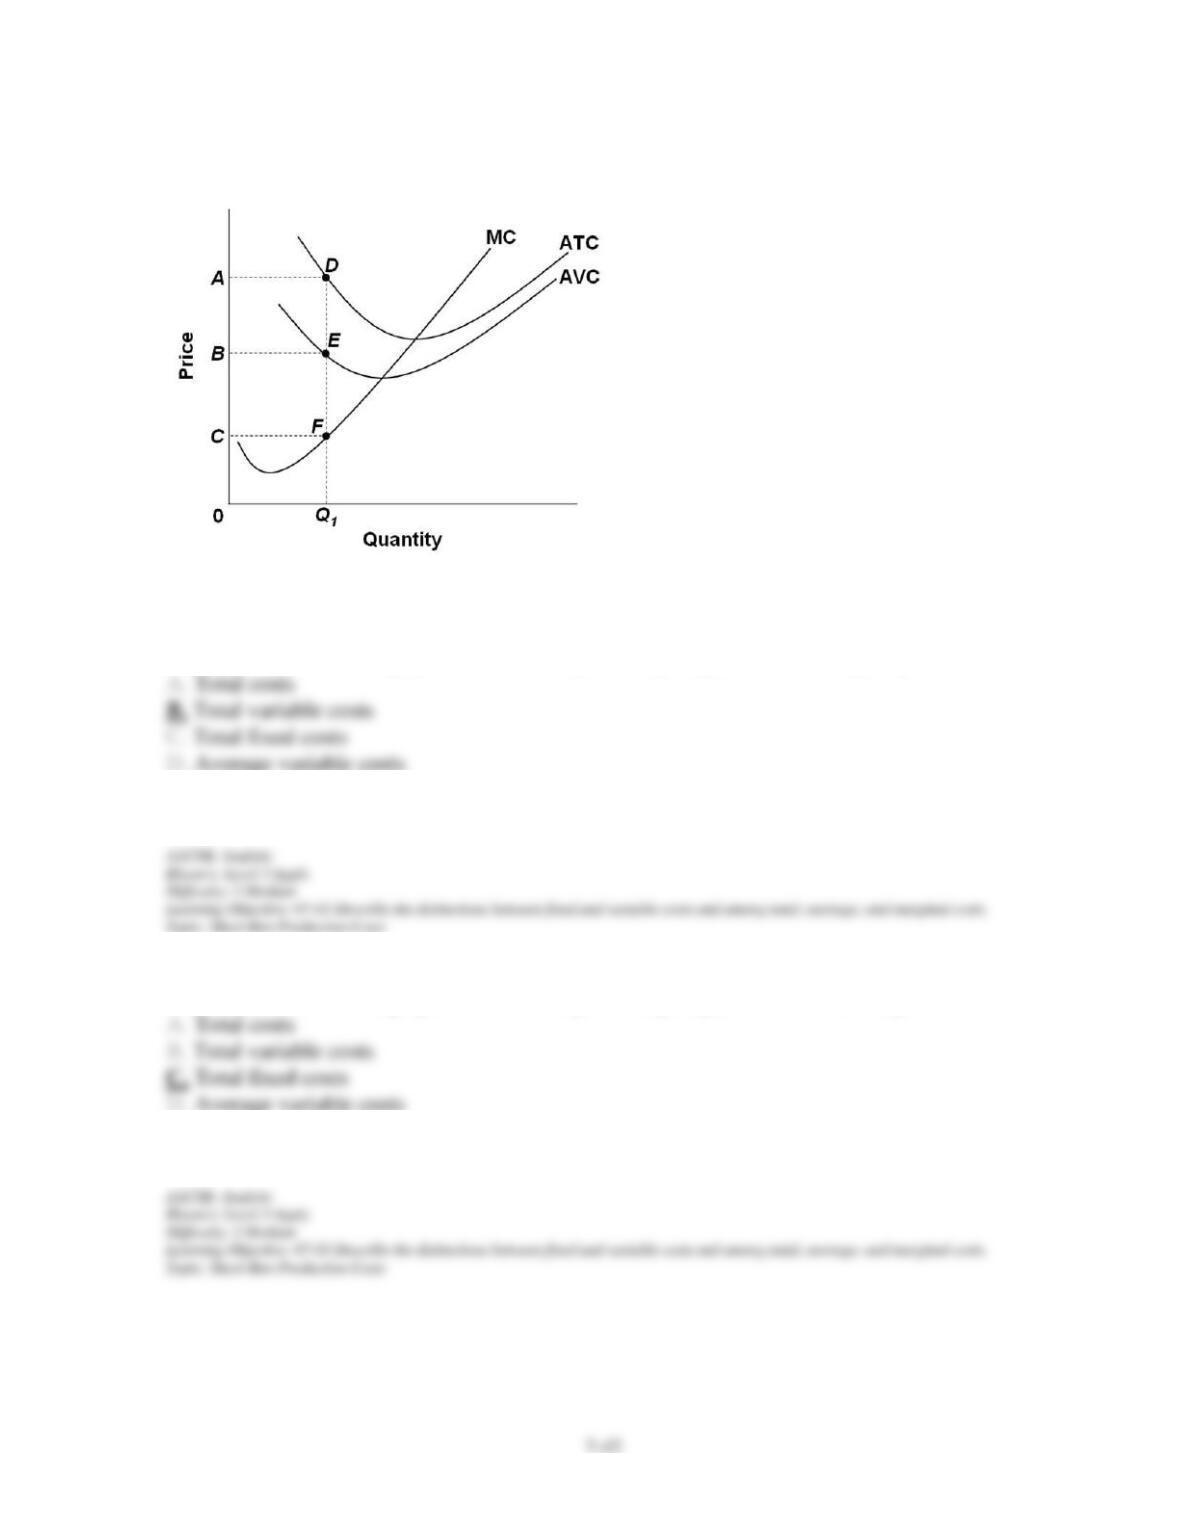
105. Refer to the above graph. If the firm is producing at Q1, the area 0BEQ1 represents:
106. Refer to the above graph. If the firm is producing at Q1, the area BADE represents:
Chapter 07 – Businesses and the Costs of Production
107. Refer to the above graph. If the firm is producing at Q1, the area 0ADQ1 represents:
108. If the total cost of 20 units is $20, and the total cost of 21 units is $21, then over the
range 20 to 21 units:
109. A firm with fixed costs produces at the lowest point on its U-shaped average variable
cost curve. If it raises output by 1 unit, then average:
Chapter 07 – Businesses and the Costs of Production
110. If marginal cost exceeds average total cost in the short run, then which is likely to be
111. The firm’s short-run marginal-cost curve is increasing when:
112. When average variable cost is at a minimum:
Chapter 07 – Businesses and the Costs of Production
113. Suppose that TC = $550, TVC = $500, and MC = $100. If the firm produces 10 units of
output, then:
114. If the price of a fixed factor of production increases by 50 percent, what effect would this
have on the marginal-cost schedule facing a firm?
115. If the price of labor or some other variable resource decreased, the:
Chapter 07 – Businesses and the Costs of Production
7-46
116. If the price of a variable resource increased for the typical firm, there would be:
117. If a more efficient technology was discovered by a firm, there would be:
118. Which statement is true given the total cost function: Total cost = 10Q + 5Q2 + 100?
Chapter 07 – Businesses and the Costs of Production
7-47
119. A firm encountering economies of scale over some range of output will have a:
120. Round Things, Inc.’s production process exhibits economies of scale. Currently their
long-run average cost is $1/unit. If Round Things doubles its use of all inputs, its new long-
run average total cost will be:
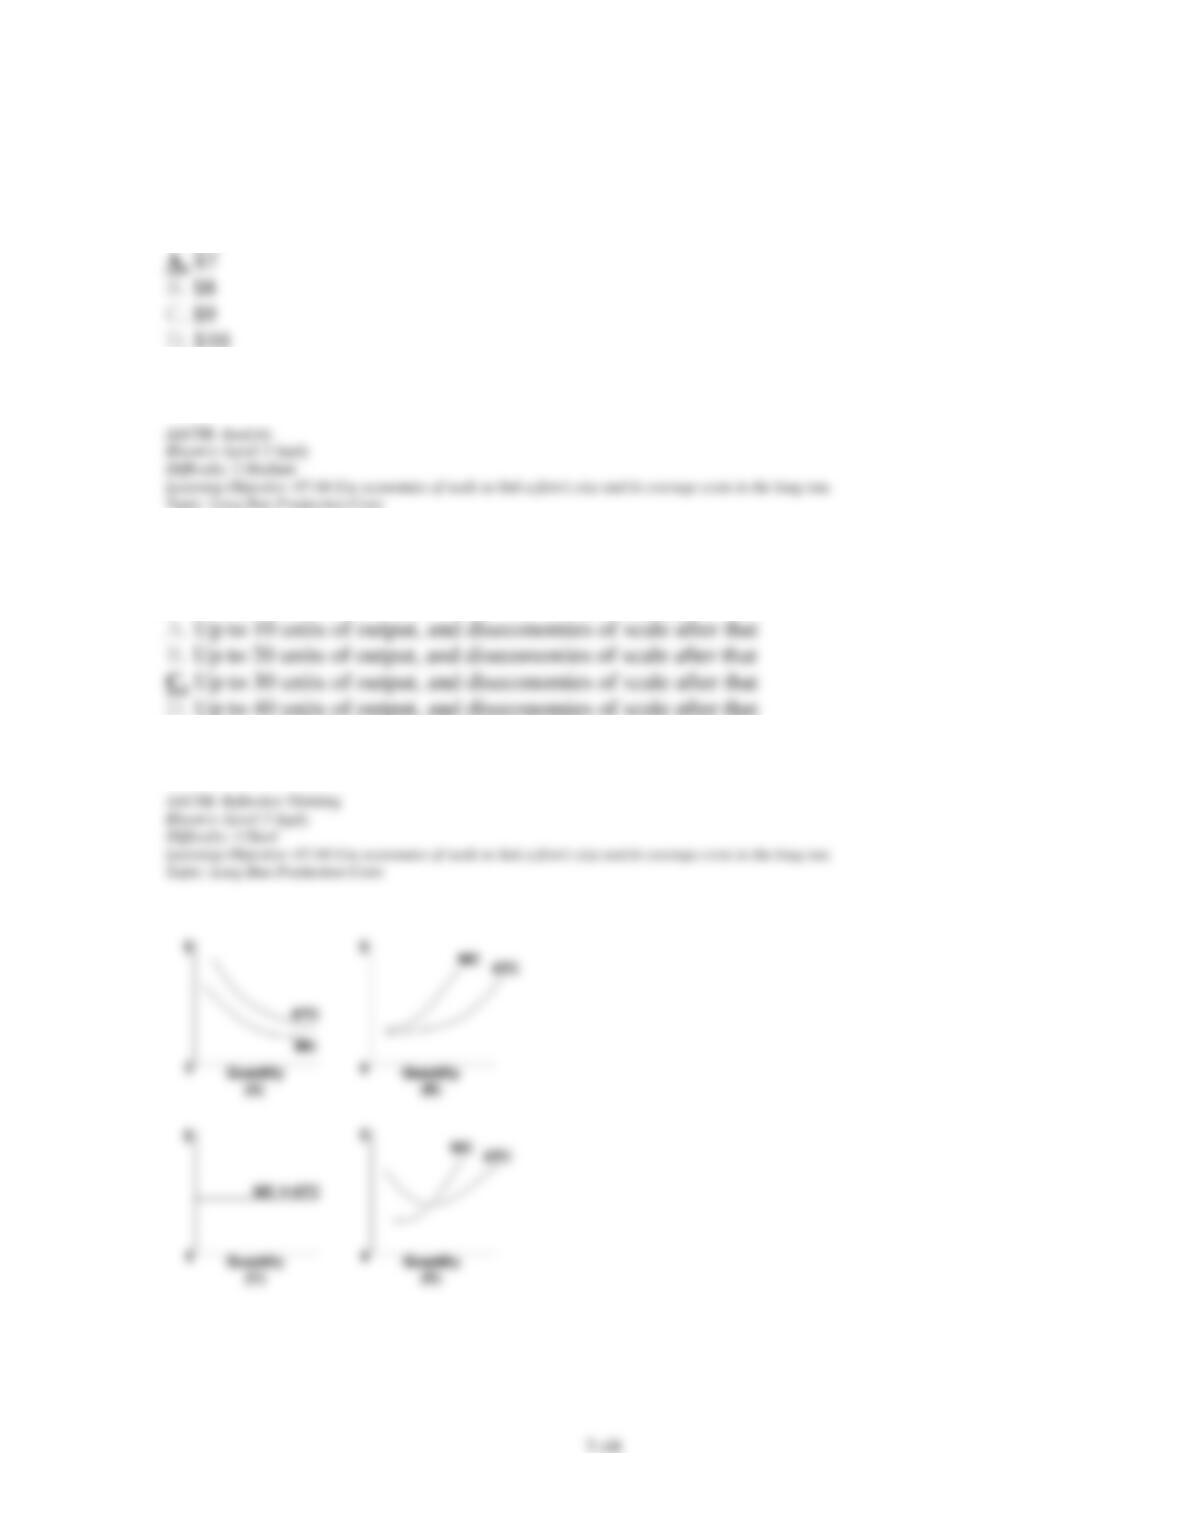
The table shows three short-run cost schedules for three plants of different sizes that a firm
might build in the long run.
Chapter 07 – Businesses and the Costs of Production
121. Refer to the above table. What is the long-run average cost of producing 30 units of
output?
122. Refer to the above table. Suppose that the three plant sizes shown are the only ones
possible, then there are economies of scale in producing:
Chapter 07 – Businesses and the Costs of Production
123. “The bigger the volume, the lower the cost, and we pass these savings on to you” is a
familiar slogan. It implies the situation shown in the above graph:
124. If long-run average total cost decreases as output increases, this is due to:
125. When a firm doubles its inputs and finds that its output has more than doubled, this is
known as:
Chapter 07 – Businesses and the Costs of Production
126. The larger the diameter of a natural gas pipeline, the lower is the average total cost of
transmitting 1,000 cubic feet of gas 1,000 miles. This is an example of one reason for:
127. Which would contribute most to a firm experiencing “economies of scale”?
128. In the long run a firm will choose a plant size that has the:
Chapter 07 – Businesses and the Costs of Production
129. If all resources used in the production of a product are increased by 10 percent and
output increases by less than 5 percent, then the firm is experiencing:
130. If all resources used in the production of a product are increased by 20 percent and
output increases by 20 percent, then there must be:
131. When the Defense Department ordered 132 new airplanes, the cost per plane was
estimated to be $580 million. A cut in the order to 75 planes increased the per plane cost to
$800 million. This change in per unit cost can be explained by:
Chapter 07 – Businesses and the Costs of Production
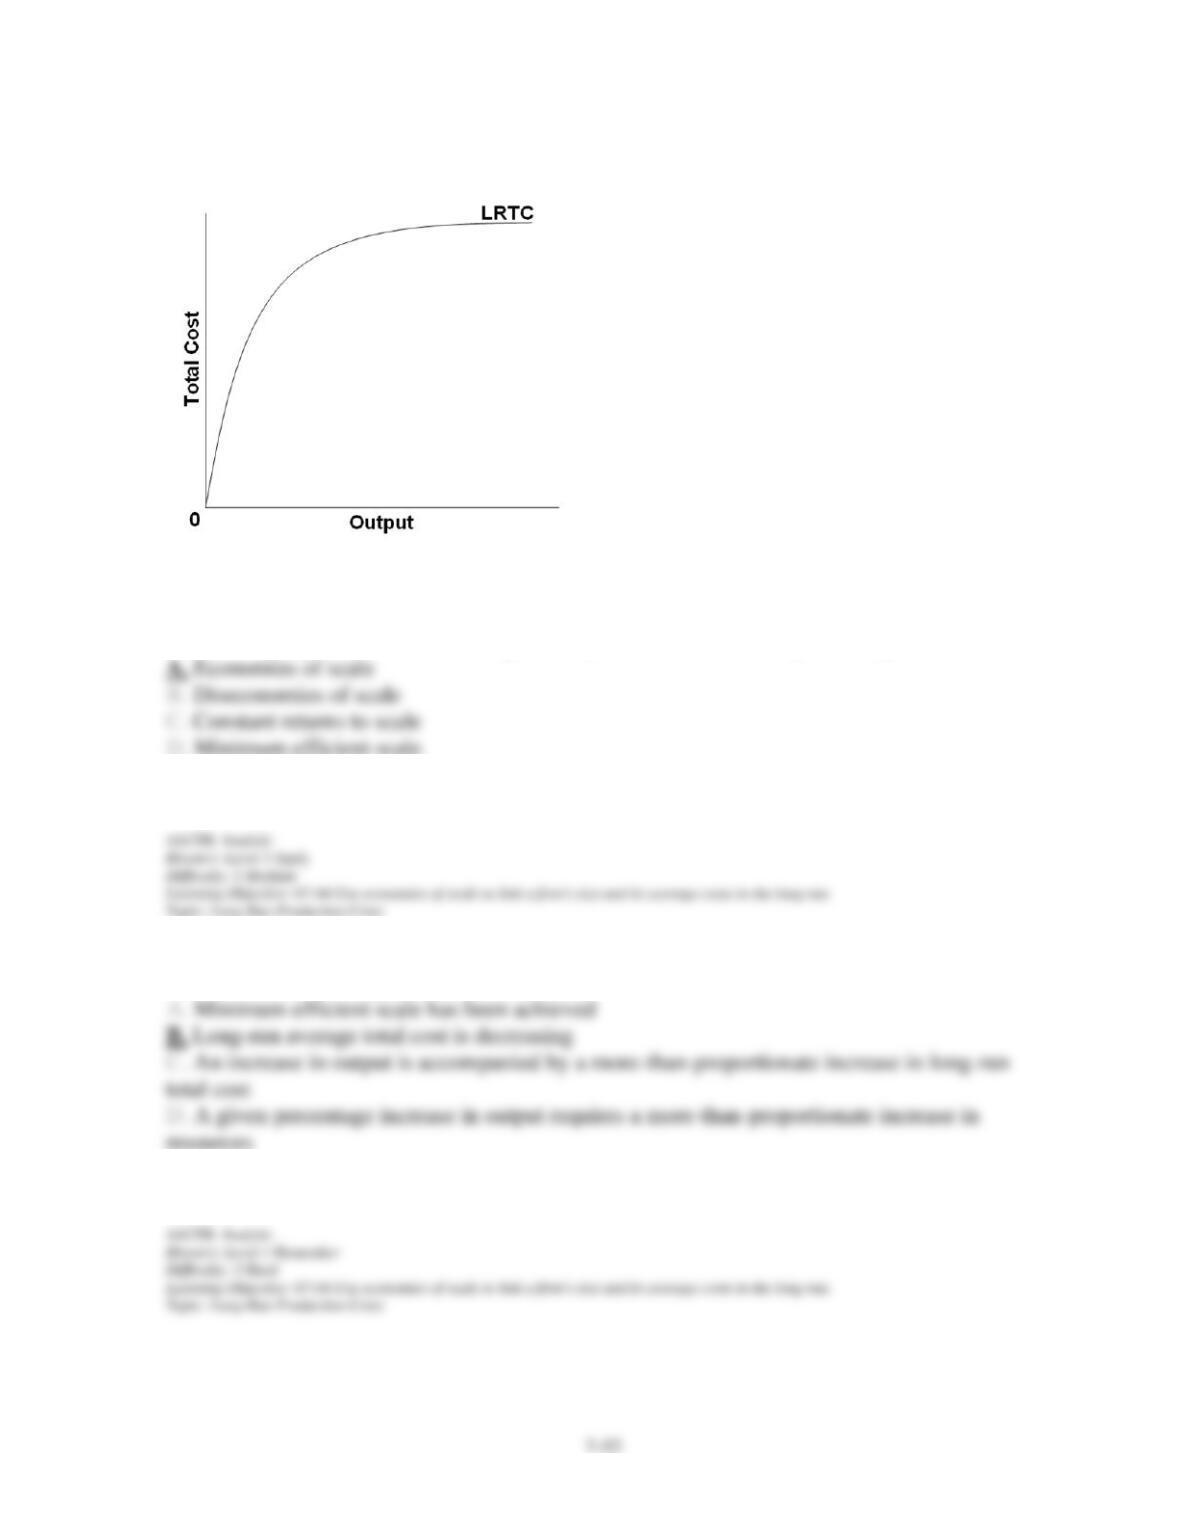
132. In the graph above LRTC = long-run total costs. The firm is experiencing:
133. When a firm is experiencing economies of scale:
Chapter 07 – Businesses and the Costs of Production
134. A firm doubles the quantity of all resources it employs and, as a result, output doubles.
Which of the following is correct?
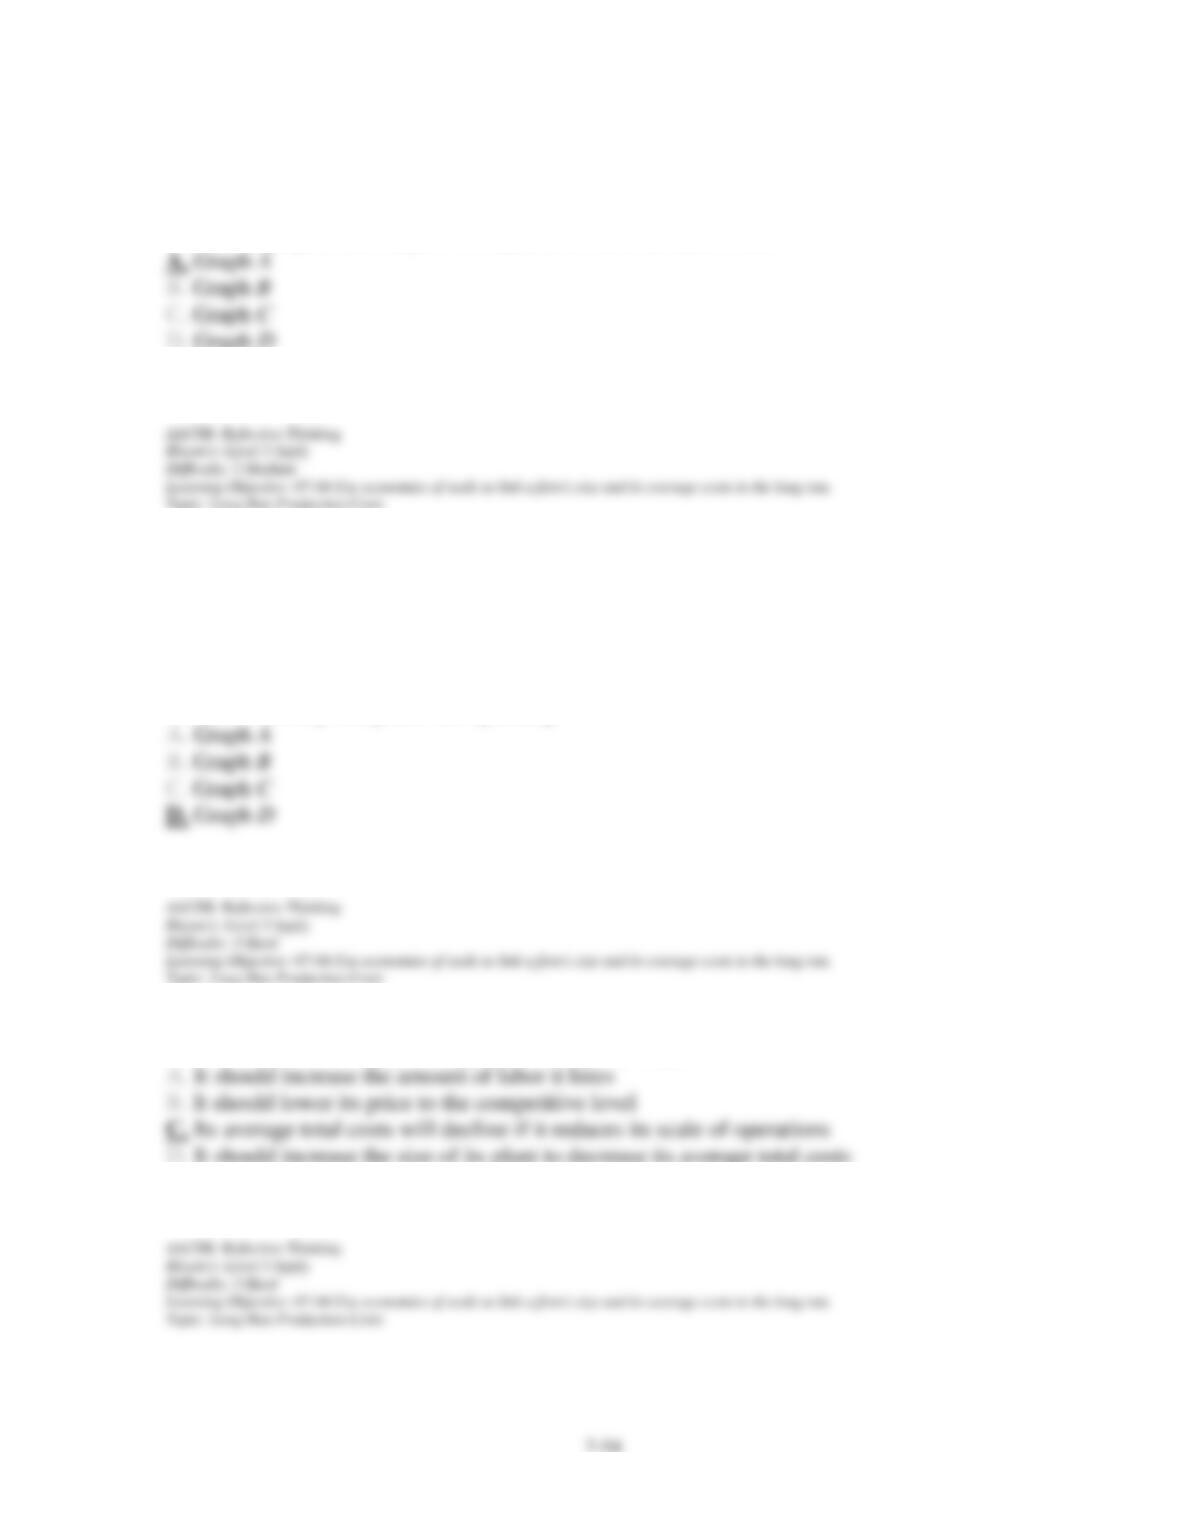
135. Refer to the above graphs. They show the long-run average total cost (LRATC) for cars.
For which graph are there economies of scale throughout the entire range of output of cars?
Chapter 07 – Businesses and the Costs of Production
136. Refer to the above graphs. They show the long-run average total cost (LRATC) for cars.
For which graph is the output level Q0 at minimum efficient scale?
137. Refer to the above graphs. They show the long-run average total cost (LRATC) for cars.
Just after World War II the Ford Motor Company opened a large automobile manufacturing
facility near Detroit with capacity Q0 autos per year. Shortly thereafter, the plant was closed
and two smaller ones were opened in the same vicinity, each more profitably producing about
one-half as many cars as the old facility. Which graph best shows the situation described
above, when only one plant was operating?
138. When a firm is experiencing diseconomies of scale:
Chapter 07 – Businesses and the Costs of Production
139. If the long-run average total cost curve for a firm is horizontal in the relevant range of
production, then it indicates that there:
140. The ability of Intel to spread product development costs over a larger number of units of
output arises from:
141. America Online’s cost of delivering Internet access to each additional user has fallen
over time because: