a.
(a)
b.
(b)
c.
(c)
d.
(d)
a
Easy
DISC: Costs of production
United States – BPROG: Analytic
Costs of production
Cost and Its Dependence on Output
133. Which of the graphs in Figure 7-5 could be a firm’s total fixed cost curve?
a.
(a)
b.
(b)
c.
(c)
d.
(d)
c
Easy
DISC: Costs of production
United States – BPROG: Analytic
Costs of production
134. Which of the following is a fixed cost?
a.
electricity
b.
worker bonuses
c.
mortgage on the building
d.
steel to produce refrigerators
c
Moderate
DISC: Costs of production
United States – BPROG: Analytic
Costs of production
Cost and Its Dependence on Output
135. Total fixed cost
a.
varies with the level of output.
b.
has a downward-sloping curve.
c.
has an upward-sloping curve.
d.
is constant at all levels of output.
Easy
DISC: Costs of production
United States – BPROG: Analytic
Costs of production
Cost and Its Dependence on Output
136. Which of the following is a fixed cost to farmer McDonald?
a.
gasoline
b.
fertilizer
c.
insurance
d.
seed
c
Moderate
DISC: Costs of production
United States – BPROG: Analytic
Costs of production
Cost and Its Dependence on Output
137. Which of the following is a variable cost for an airline?
a.
insurance
b.
property taxes
c.
jet fuel
d.
rent of airport space
c
Moderate
DISC: Costs of production
United States – BPROG: Analytic
Costs of production
Cost and Its Dependence on Output
Figure 7-6
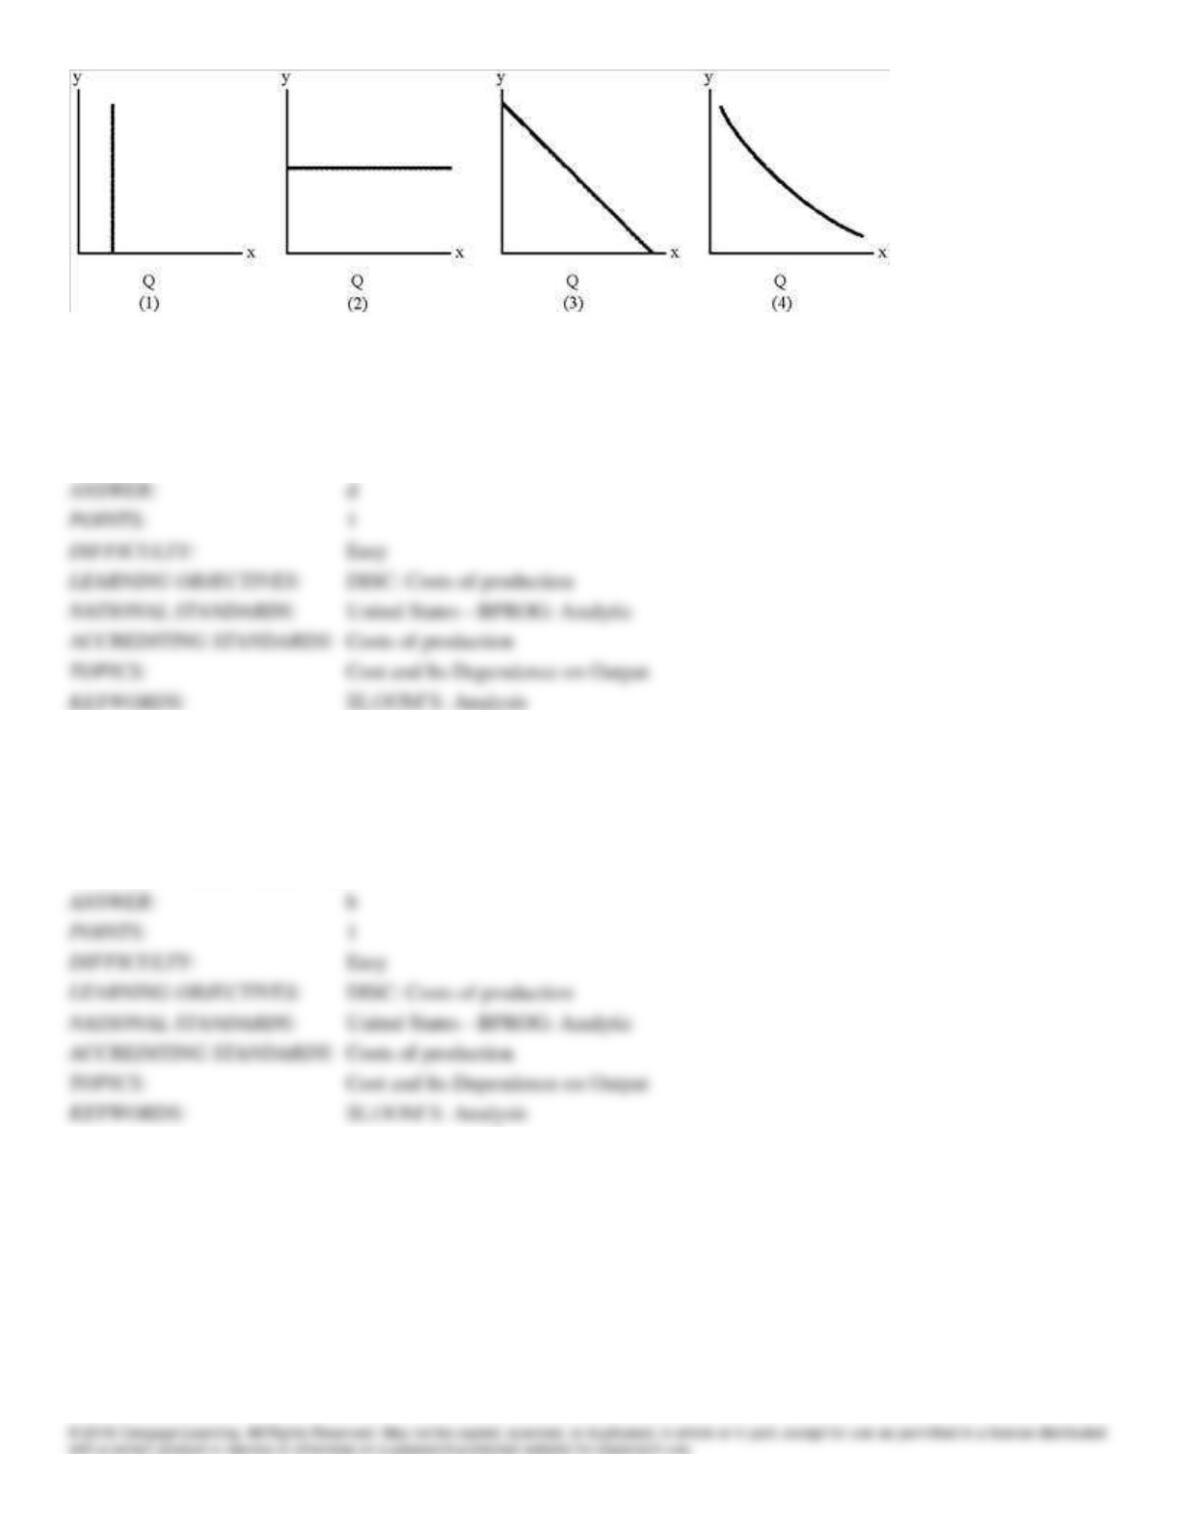
138. Which of the lines in Figure 7-6 represents a typical average fixed cost curve?
a.
1
b.
2
c.
3
d.
4
d
1
139. Which of the following is correct?
a.
AC = AFC/Q
b.
AC = AFC + AVC
c.
AC = MFC + MVC
d.
TFC + TMC = MFC + MVC
b
1
Figure 7-7
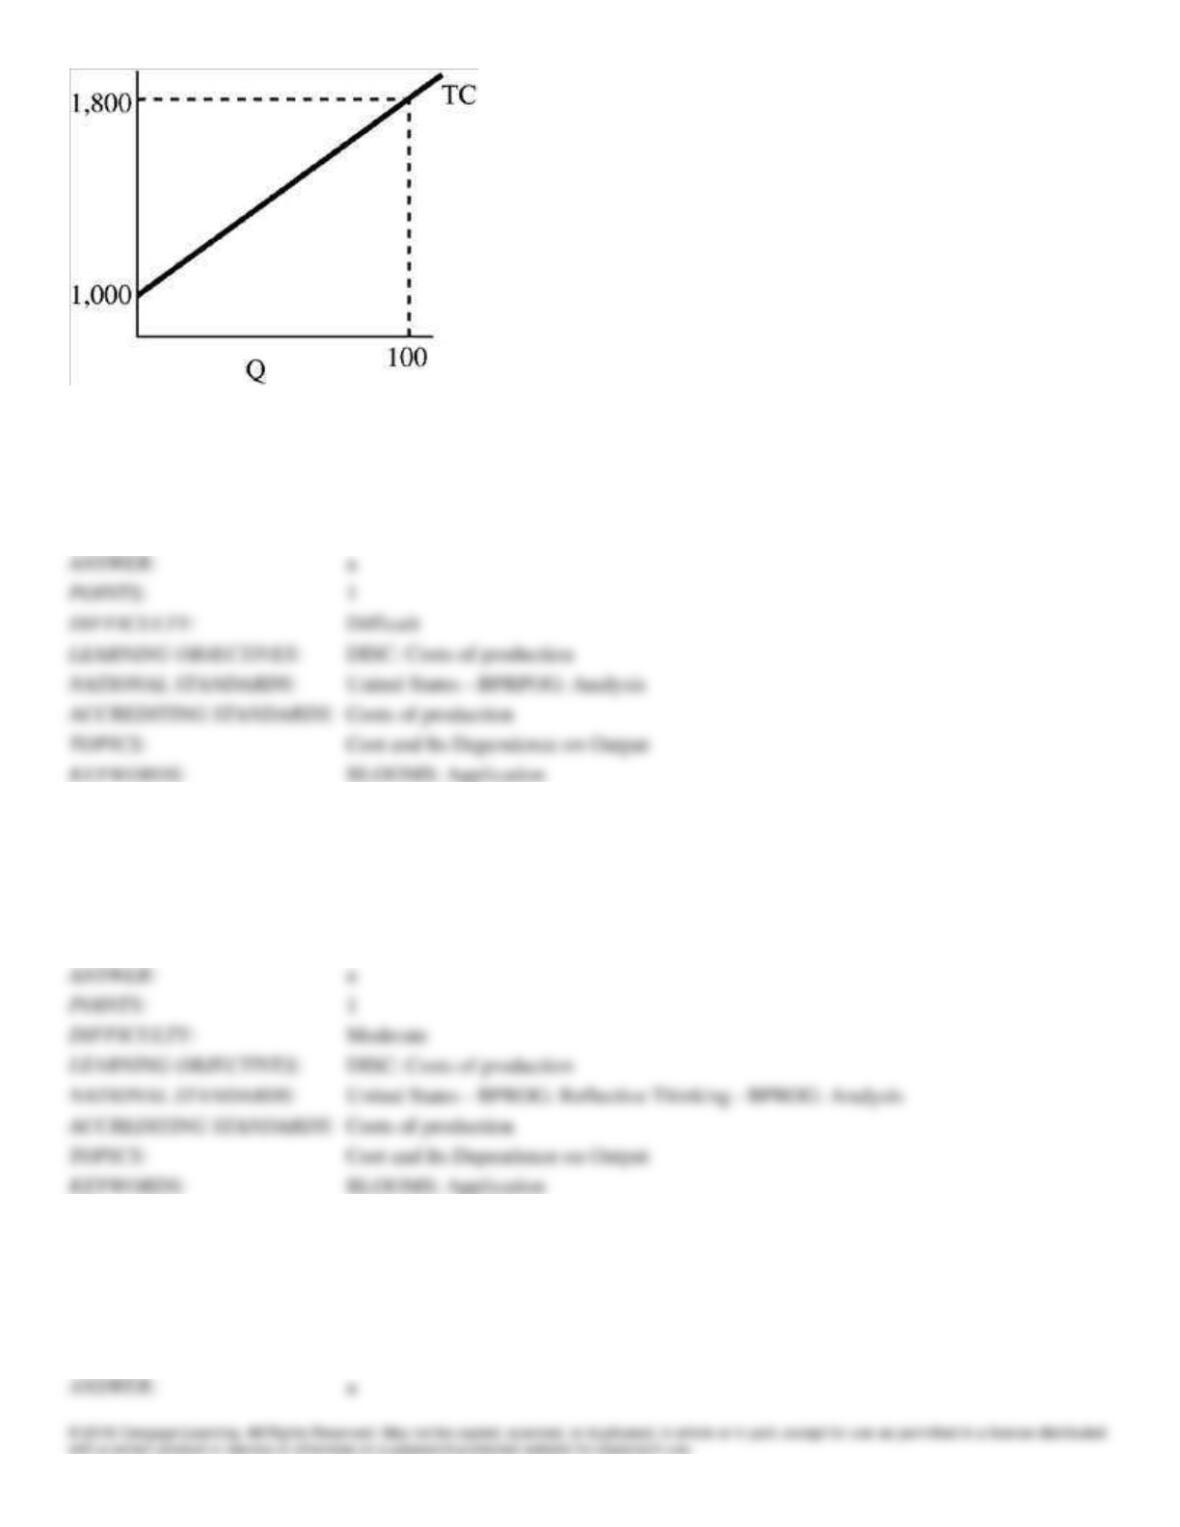
140. In Figure 7-7 at 100 units, AFC equals
a.
10.
b.
100.
c.
180.
d.
1,000.
a
Difficult
141. In Figure 7-7 at 100 units, FC equals
a.
1,000.
b.
1,800.
c.
800.
d.
80.
a
Moderate
142. In Figure 7-7 at 100 units, AVC equals
a.
8.
b.
800.
c.
100.
d.
1,000.
a
1
Figure 7-8
143. “Overfishing” impairs the ability of fish stock to replenish itself, so the stock of fish declines. Fishermen then attempt
to increase output by adding more boats and fishing longer. Which average cost curve in Figure 7-8 depicts the
“overfishing” situation?
a.
1
b.
2
c.
3
d.
4
b
1
144. Of the graphs in Figure 7-8, which resembles marginal cost?
a.
1
b.
2
c.
3
d.
4
b
1
145. Of the graphs in Figure 7-8, which represents fixed cost?
a.
1
b.
2
c.
3
d.
4
d
1
146. Of the graphs in Figure 7-8, which represents total cost?
a.
1
b.
2
c.
3
d.
4
1
Figure 7-9
147. Of the graphs in Figure 7-9, which represents total fixed cost?
a.
1
b.
2
c.
3
d.
4
b
1
DISC: Costs of production
United States – BPROG: Reflective Thinking – BPROG: Analysis
Costs of production
Cost and Its Dependence on Output
BLOOMS: Application
148. Of the graphs in Figure 7-9, which represents average fixed cost?
a.
1
b.
2
c.
3
d.
4
1
DISC: Costs of production
United States – BPROG: Analytic
Costs of production
Cost and Its Dependence on Output
BLOOMS: Application
Figure 7-10
149. In Figure 7-10, the curve B is
a.
average fixed cost.
b.
average total cost.
c.
average variable cost.
d.
marginal cost.
1
DISC: Costs of production
United States – BPROG: Reflective Thinking – BPROG: Analysis
Costs of production
Cost and Its Dependence on Output
BLOOMS: Application
150. In Figure 7-10, the curve labeled C is
a.
average fixed cost.
b.
average total cost.
c.
average variable cost.
d.
marginal cost.
DISC: Costs of production
United States – BPROG: Reflective Thinking – BPROG: Analysis
Costs of production
Cost and Its Dependence on Output
BLOOMS: Application
151. The typical average cost curve
a.
continually declines as output increases.
b.
is horizontal.
c.
continually increases as output increases.
d.
first declines to a minimum and then increases as output increases.
DISC: Costs of production
United States – BPROG: Analytic
Costs of production
Cost and Its Dependence on Output
152. The average cost curve
a.
is the vertical summation of the AFC and the AVC curves.
b.
lies below the AVC curve.
c.
lies below the AFC curve.
d.
is the vertical summation of the MC and AVC curves.
DISC: Costs of production
United States – BPROG: Analytic
Costs of production
Cost and Its Dependence on Output
Figure 7-11
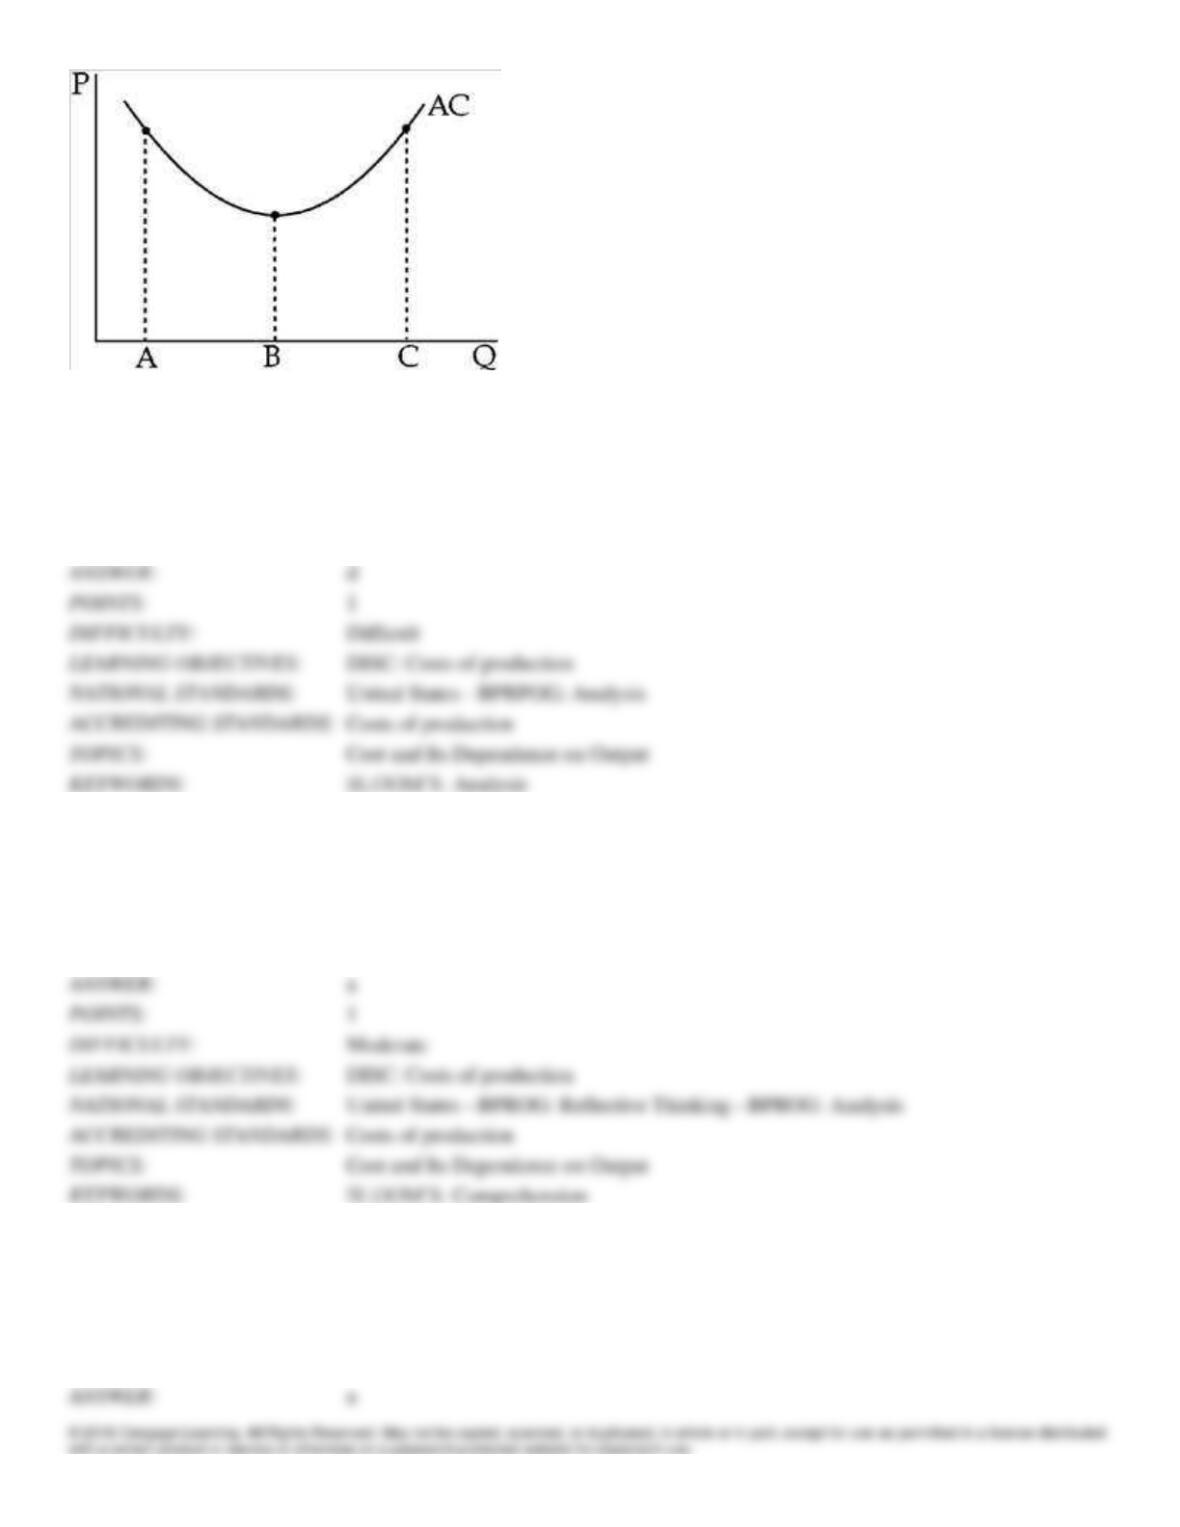
153. Figure 7-11 shows an average cost curve with points on it that correspond to three quantity levels. Which of the
following statements must be wrong?
a.
The firm’s technology may show increasing marginal returns as production increases from A to B.
b.
The firm may have positive fixed costs.
c.
As production expands from A to B to C, the firm may become increasingly difficult to manage efficiently.
d.
The firm’s average fixed cost may rise as production increases from B to C.
DISC: Costs of production
United States – BPRPOG: Analysis
Costs of production
Cost and Its Dependence on Output
154. Average cost curves decline because
a.
fixed cost is spread out over larger amounts of production.
b.
it becomes cheaper to produce an infinite amount of goods.
c.
additional units of production are inferior.
d.
variable costs increase with each additional amount of production.
DISC: Costs of production
United States – BPROG: Reflective Thinking – BPROG: Analysis
Costs of production
Cost and Its Dependence on Output
155. Which of the following formulas defines average cost?
a.
AC = TC/Q
b.
AC = MRP = MFC
c.
AC = MPP/Q
d.
AC = TC − Q
1
Easy
DISC: Costs of production
United States – BPROG: Analytic
Costs of production
Cost and Its Dependence on Output
156. A firm’s AC will eventually begin to rise because
a.
managers’ salaries rise with output.
b.
bottlenecks may be reached for some inputs.
c.
MFC begins to rise near capacity.
d.
the range of negative returns is reached.
b
1
Moderate
DISC: Costs of production
United States – BPROG: Reflective Thinking – BPROG: Analysis
Costs of production
Cost and Its Dependence on Output
157. In the typical AC curve, the downward-sloping part is attributable to
a.
spreading fixed costs over larger outputs and increasing returns to the variable inputs.
b.
declining administrative costs as output increases.
c.
falling fixed costs.
d.
rising total product.
a
1
Easy
DISC: Costs of production
United States – BPROG: Analytic
Costs of production
Cost and Its Dependence on Output
Table 7-5
Stereos produced
0
1
2
3
4
5
6
Total cost (in $)
200
325
410
475
550
660
825
158. Table 7-5 shows short-run total cost figures for a stereo manufacturer. The manufacturer’s short-run fixed cost is
a.
0.
b.
$75.
c.
$200.
d.
$400.
c
1
Easy
DISC: Costs of production
United States – BPROG: Analytic
Costs of production
Cost and Its Dependence on Output
BLOOMS: Application
159. Table 7-5 shows short-run total cost figures for a stereo manufacturer. The short-run average variable cost of
producing five stereos is
a.
$92.
b.
$110.
c.
$132.
d.
$460.
a
1
Difficult
DISC: Costs of production
United States – BPROG: Reflective Thinking – BPROG: Analysis
Costs of production
Cost and Its Dependence on Output
BLOOMS: Application
160. Table 7-5 shows short-run total cost figures for a stereo manufacturer. At what output level does short-run average
total cost reach a minimum?
a.
2
b.
3
c.
4
d.
5
d
1
Easy
DISC: Costs of production
United States – BPROG: Analytic
Costs of production
Cost and Its Dependence on Output
BLOOMS: Application
161. If a firm has a U-shaped long-run average cost curve,
a.
its fixed cost rises as output rises.
b.
it must have increasing returns to scale at low levels of production and decreasing returns to scale at high
levels of production.
c.
it must have increasing returns to each input at low levels of production and decreasing returns to each input at
high levels of production.
d.
the firm can maximize its output by operating at the point of minimum long-run average cost.
b
Moderate
DISC: Costs of production
United States – BPROG: Reflective Thinking – BPROG: Analysis
Costs of production
Cost and Its Dependence on Output
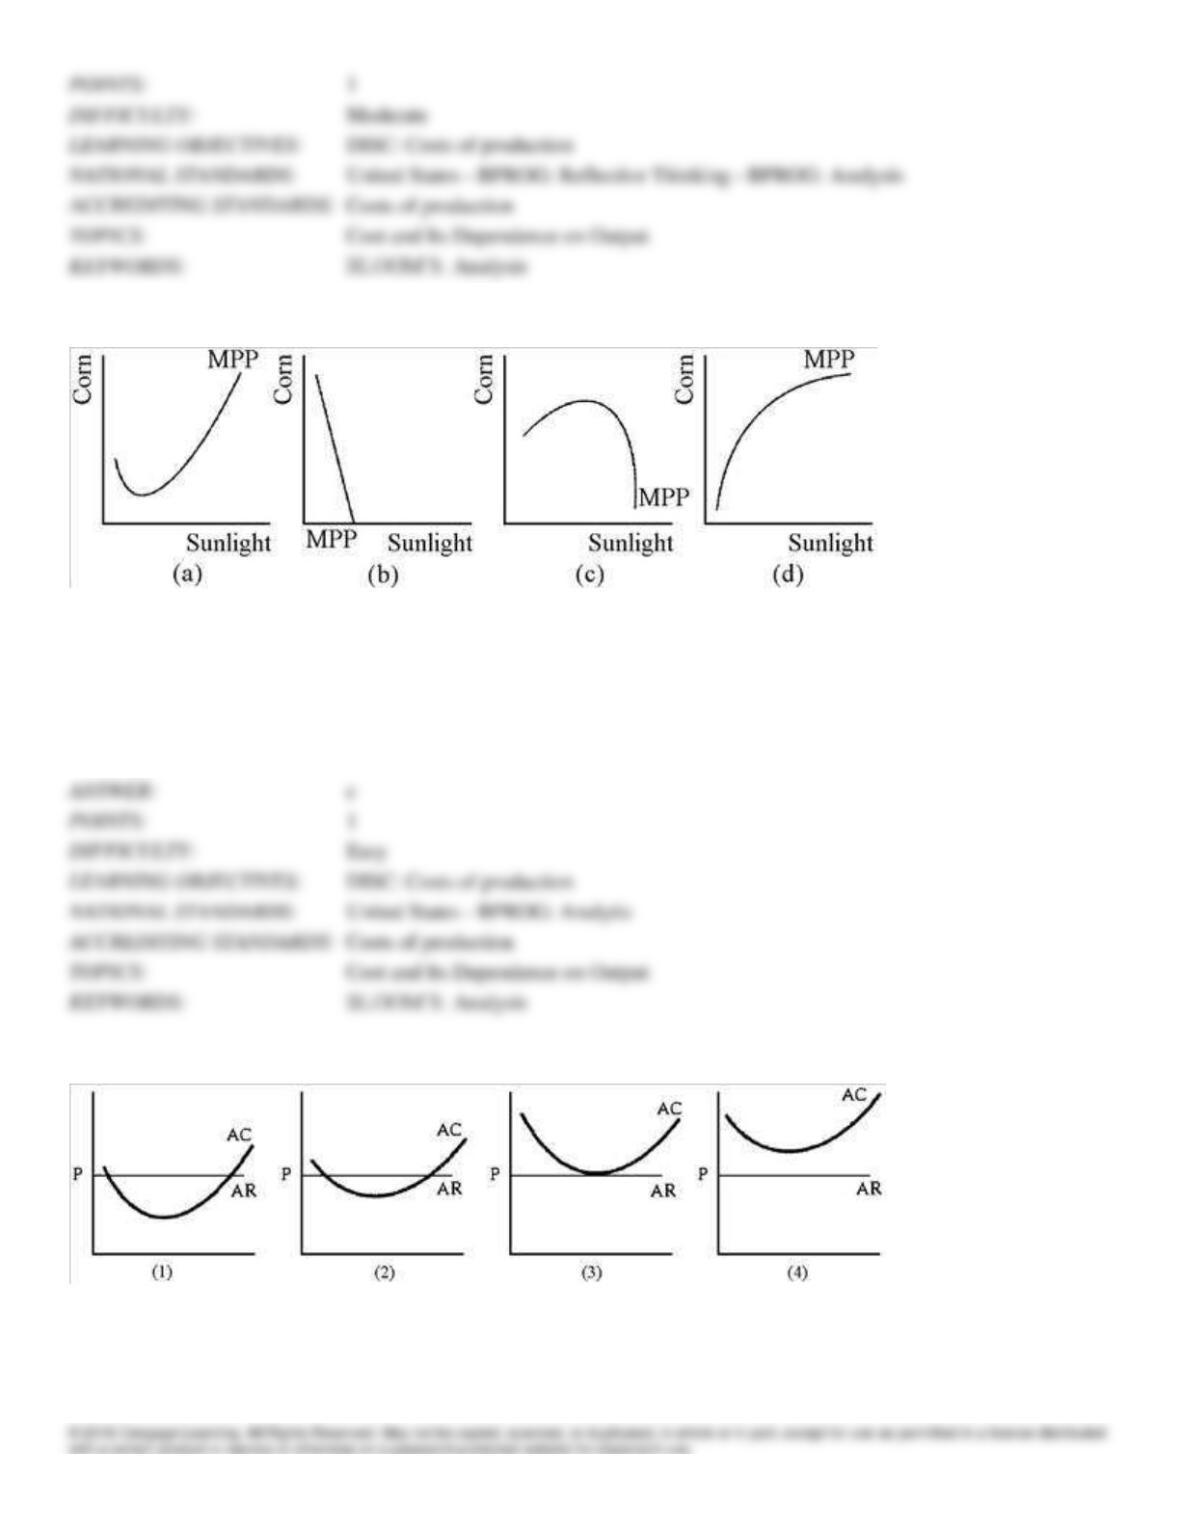
Figure 7-12
162. Which of the graphs in Figure 7-12 shows a marginal physical product curve that exhibits first increasing, and then
diminishing, marginal returns to sunlight?
a.
(a)
b.
(b)
c.
(c)
d.
(d)
c
Easy
DISC: Costs of production
United States – BPROG: Analytic
Costs of production
Cost and Its Dependence on Output
Figure 7-13
163. Figure 7-13 shows the average total cost curves of four firms that produce milk. Some of the dairies are more
productive. AR = P is the long-run price of milk. How many of these dairies will remain in the industry in the long run?
a.
all of them
b.
only 2
c.
only 3
d.
cannot determine with information given
DISC: Costs of production
United States – BPRPOG: Analysis
Costs of production
Cost and Its Dependence on Output
164. AC is lower in the long run than in the short run because
a.
prices often fall, allowing savings on purchases.
b.
inputs can be combined more efficiently in the long run.
c.
over time the prices of all inputs tend to decrease.
d.
AFC falls with output over all ranges of output.
DISC: Costs of production
United States – BPROG: Analytic
Costs of production
Cost and Its Dependence on Output
165. Everything else equal, the AC curve will shift downward if
a.
input prices rise.
b.
input MPPs rise.
c.
output rises.
d.
output falls.
DISC: Costs of production
United States – BPROG: Reflective Thinking – BPROG: Analysis
Costs of production
Cost and Its Dependence on Output
166. Everything else equal, the AC curve will shift when
a.
the price of the product rises.
b.
technical change raises the MPP of one input.
c.
output is increased.
d.
increasing returns to scale are present.
DISC: Costs of production
United States – BPROG: Reflective Thinking – BPROG: Analysis
Costs of production
Cost and Its Dependence on Output
167. One reason why critics argue that large firms should not be broken up is that in some cases
a.
large firms have a concentration of economic power.
b.
large firms are less-efficient producers.
c.
many smaller firms would be less-efficient producers.
d.
there is no economic reason to break up large firms that may have some control over the market.
1
DISC: Costs of production
United States – BPROG: Analytic
Costs of production
Cost and Its Dependence on Output
168. The long-run average cost curve
a.
is a composite of short-run AC curves.
b.
shows the lowest possible short-run AC corresponding to each output level.
c.
depends on the firm’s planning horizon.
d.
All of the above are correct.
d
1
DISC: Costs of production
United States – BPROG: Reflective Thinking – BPROG: Analysis
Costs of production
Cost and Its Dependence on Output
Table 7-6
Number of ovens
2
2
2
2
2
2
2
2
Labor hours used
1
2
3
4
5
6
7
8
Loaves of Bread Produced
20
34
55
70
82
91
94
92
169. Table 7-6 shows a baker’s daily production relationship for bread. Diminishing returns to labor begin when the baker
goes from
a.
one hour of labor to two hours of labor.
b.
three hours of labor to four hours of labor.
c.
six hours of labor to seven hours of labor.
d.
seven hours of labor to eight hours of labor.
Moderate
DISC: Costs of production
United States – BPROG: Analytic
Costs of production
Economies of Scale
170. A firm uses workers and seed to grow lettuce. Its lettuce output rises from 100 tons to 200 tons when the number of
workers increases from 25 to 75. Its production process shows
a.
decreasing returns to scale.
b.
diminishing returns to labor.
c.
increasing long-run average cost.
d.
decreasing short-run average variable cost.
Moderate
DISC: Costs of production
United States – BPROG: Reflective Thinking – BPROG: Analysis
Costs of production
Economies of Scale
171. If economies of scale exist for a particular production relationship, long-run average costs will
a.
rise.
b.
fall.
c.
first rise and then fall.
d.
be unaffected since there is no direct relationship between the two.
Moderate
DISC: Costs of production
United States – BPROG: Analytic
Costs of production
Economies of Scale
172. Whether or not a production process shows economies of scale depends on
a.
the number of inputs used.
b.
technology.
c.
technology and input prices.
d.
technology and output prices.
Easy
DISC: Costs of production
United States – BPROG: Analytic
Costs of production
Economies of Scale
173. When economies of scale exist,
a.
production costs per unit increase as output expands.
b.
production costs per unit decline as output expands.
c.
total production costs decrease.
d.
total production costs increase.
DISC: Costs of production
United States – BPROG: Analytic
Costs of production
Economies of Scale
174. When economies of scale are present,
a.
costs per unit decline as output expands.
b.
the government feels responsible for breaking up the firm.
c.
firms always make handsome profits.
d.
costs fall as the size of the product is increased.
DISC: Costs of production
United States – BPROG: Analytic
Costs of production
Economies of Scale
175. Economies of scale
a.
require inputs’ MPP to fall as output increases (everything else equal).
b.
pertain to the long run only.
c.
refer to increased output generalized by an increase in the quantity of a single input.
d.
imply that the AC curve will fall continuously as output increases in the short run.
DISC: Costs of production
United States – BPROG: Reflective Thinking – BPROG: Analysis
Costs of production
Economies of Scale
176. A firm’s production process shows constant returns to scale. It can produce 5,000 widgets at a total cost of $2,500
and 10,000 widgets at an average cost of
a.
$10,000.
b.
$5,000.
c.
$2,000.
d.
$0.50.
Moderate
DISC: Costs of production
United States – BPROG: Analytic
Costs of production
Economies of Scale
BLOOMS: Application
177. Economies of scale is another term for
a.
increasing returns to scale.
b.
constant returns to scale.
c.
increasing marginal physical productivity.
d.
decreasing returns to scale.
a
Easy
DISC: Costs of production
United States – BPROG: Analytic
Costs of production
Economies of Scale
178. If a firm has increasing returns to scale at all levels of output, the
a.
slope of its long-run total cost curve is always negative.
b.
slopes of its short-run average cost curves are always negative.
c.
slope of its long-run average cost curve is always negative.
d.
slope of its production function is always negative.
c
Moderate
DISC: Costs of production
United States – BPROG: Analytic
Costs of production
Economies of Scale
179. If doubling the quantity of inputs more than doubles the quantity of outputs, the firm is experiencing
a.
increasing returns to scale.