Table 7-1
Workers
Toys
1
5
2
12
3
22
4
30
5
35
75. In Table 7-1, the marginal physical product of labor after the addition of the fourth worker is
a.
8.
b.
7.
c.
10.
d.
5.
a
1
Easy
DISC: Costs of production
United States – BPROG: Analytic
Costs of production
Production, Input Choice, and Cost with One Variable Input
BLOOMS: Application
76. In Table 7-1, the average physical product after five workers are hired is
a.
5.
b.
6.
c.
7.
d.
8.
c
1
Easy
DISC: Costs of production
United States – BPROG: Analytic
Costs of production
Production, Input Choice, and Cost with One Variable Input
BLOOMS: Application
77. In Table 7-1, the marginal physical product begins to diminish with the addition of the
a.
second worker.
b.
third worker.
c.
fourth worker.
d.
Marginal returns never diminish in Table 7-1.
c
1
Moderate
DISC: Costs of production
United States – BPROG: Analytic
Costs of production
Production, Input Choice, and Cost with One Variable Input
BLOOMS: Application
78. The marginal physical product of an input is the
a.
addition to output from using one more unit of an input.
b.
extra amount of an input needed to produce one additional unit of output.
c.
change in average physical product, given a change in the quantity of an input.
d.
slope of the production indifference curve for an output made using the input.
a
1
Easy
DISC: Costs of production
United States – BPROG: Analytic
Costs of production
Production, Input Choice, and Cost with One Variable Input
79. In which zone does the total physical product reach it maximum value?
a.
Increasing marginal return
b.
Negative marginal return
c.
Diminishing marginal return
d.
Decreasing total physical product
c
1
Easy
DISC: Costs of production
United States – BPROG: Analytic
Costs of production
Production, Input Choice, and Cost with One Variable Input
Table 7-2
Plastic (in pounds)
5
6
7
Widgets
14
17
19
80. Table 7-2 contains information on widget production. The marginal physical product of the sixth pound of plastic is
____.
a.
(19/7) − (17/6)
b.
1/3
c.
2
d.
3
d
Moderate
DISC: Costs of production
United States – BPROG: Analytic
Costs of production
Production, Input Choice, and Cost with One Variable Input
BLOOMS: Application
81. Table 7-2 contains information on widget production. The average physical product of the seventh pound of plastic is
calculated as ____.
a.
9/25
b.
2
c.
25/9
d.
19/7
d
1
Moderate
DISC: Costs of production
United States – BPROG: Analytic
Costs of production
Production, Input Choice, and Cost with One Variable Input
BLOOMS: Application
82. A total product curve shows the
a.
aggregate output of many firms in an industry.
b.
amount of product consumers will take off the market.
c.
maximum amount of product that it is technically possible to produce.
d.
relationship between units of inputs and total output.
d
1
Moderate
DISC: Costs of production
United States – BPROG: Analytic
Costs of production
Production, Input Choice, and Cost with One Variable Input
John Amaker owns orange groves and hires pickers for a two-week period as shown in Table 7-3.
Table 7-3
Pickers
Oranges Picked
1
1,000
2
2,000
3
3,000
4
3,900
5
4,700
6
5,400
7
6,000
8
6,200
9
6,000
83. In Table 7-3, diminishing returns set in with picker
a.
3.
b.
4.
c.
5.
d.
6.
e.
9.
1
DISC: Costs of production
United States – BPROG: Analytic
Costs of production
Production, Input Choice, and Cost with One Variable Input
BLOOMS: Application
84. In Table 7-3, negative returns set in with picker
a.
6.
b.
7.
c.
8.
d.
9.
e.
There are no negative returns in this table.
d
1
DISC: Costs of production
United States – BPROG: Analytic
Costs of production
Production, Input Choice, and Cost with One Variable Input
BLOOMS: Application
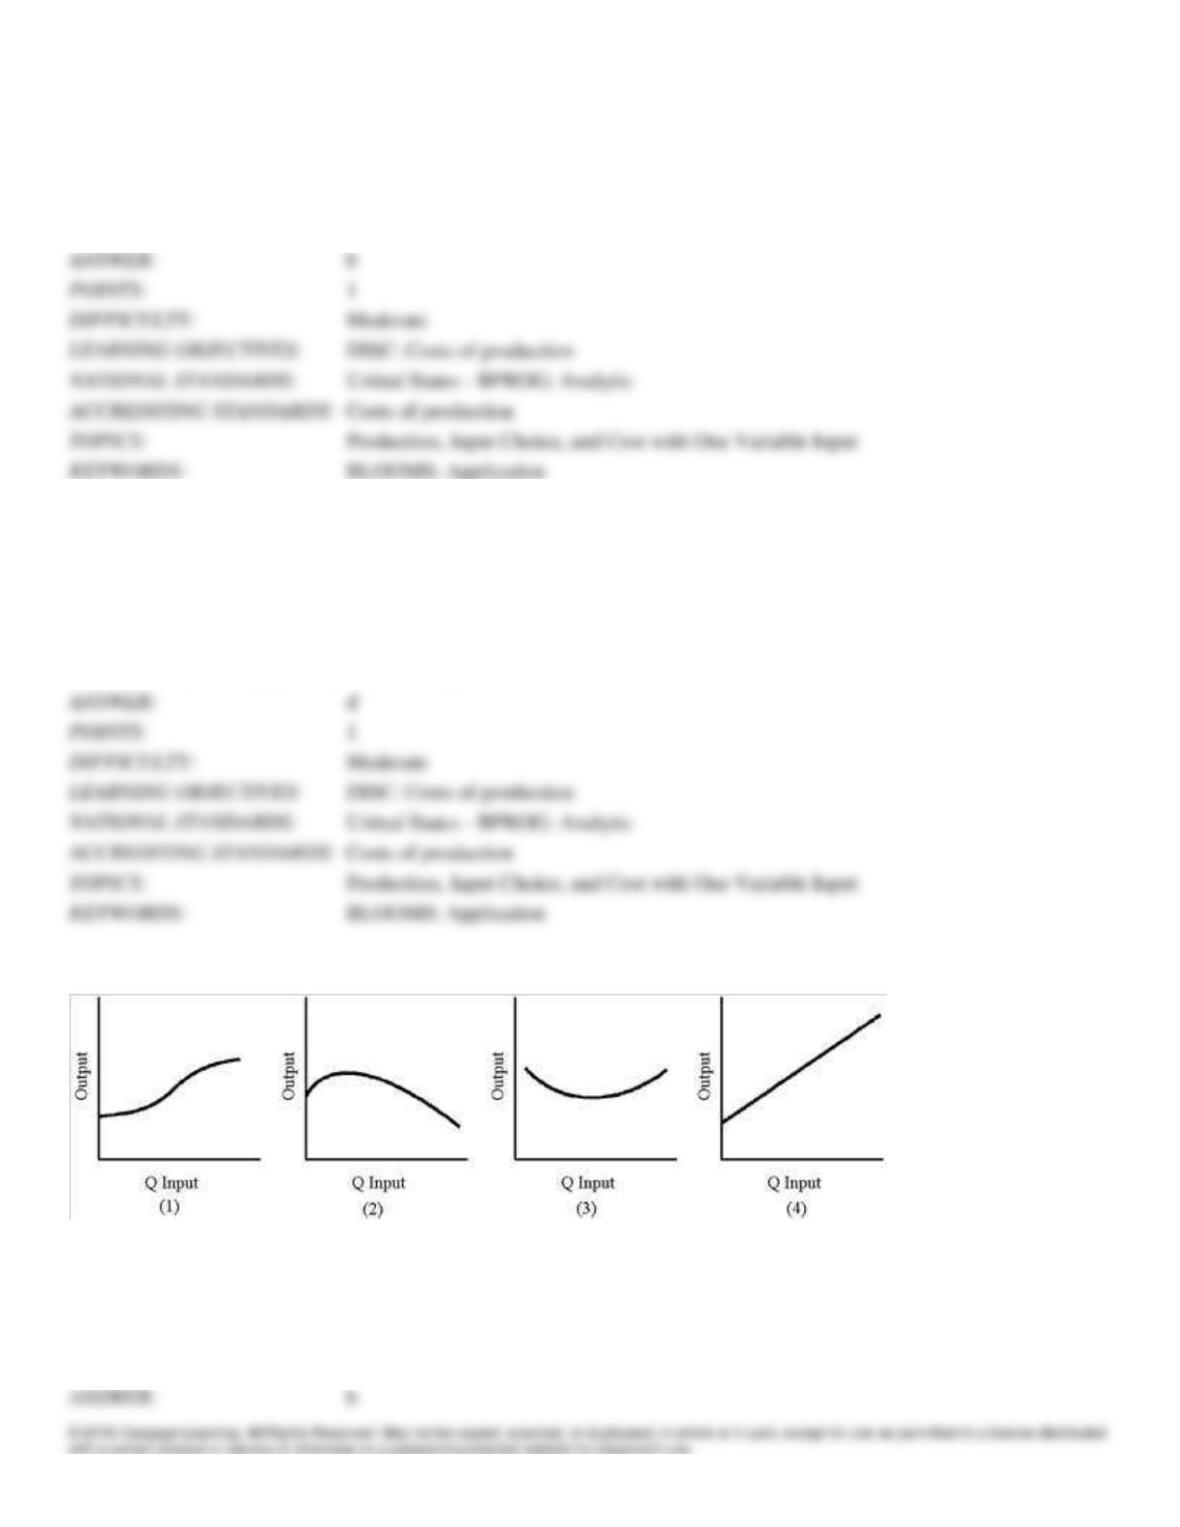
Figure 7-1
85. Of the graphs in Figure 7-1, which best represents marginal physical product?
a.
1
b.
2
c.
3
d.
4
b
1
DISC: Costs of production
United States – BPROG: Analytic
Costs of production
Production, Input Choice, and Cost with One Variable Input
BLOOMS: Application
86. In Figure 7-1, which graph best represents total physical product with diminishing returns?
a.
1
b.
2
c.
3
d.
4
1
DISC: Costs of production
United States – BPROG: Analytic
Costs of production
Production, Input Choice, and Cost with One Variable Input
BLOOMS: Application
87. USX, a steel company, reduced the number of man-hours required to produce a ton of steel from 10.8 in 1982 to 3.8 in
1990, thereby eliminating 55,000 jobs. Technically, this rise in productivity means the
a.
marginal product of labor increased.
b.
average product of labor increased.
c.
average product of capital fell.
d.
marginal product of capital fell.
b
1
DISC: Costs of production
United States – BPROG: Analytic
Costs of production
Production, Input Choice, and Cost with One Variable Input
88. The “law” of diminishing returns is also referred to as
a.
the “law” of diminishing returns to scale.
b.
the “law” of variable input proportions.
c.
diminishing average physical product.
d.
the “law” of decreasing cost.
b
1
DISC: Costs of production
United States – BPROG: Analytic
Costs of production
Production, Input Choice, and Cost with One Variable Input
89. The “law” of diminishing returns
a.
is deduced from the basic biochemical relationship of agricultural theory.
b.
was constructed as the basis of observation during experiments on the impact of fertilizer on output in the
1930s.
c.
is based on regular observations of input-output relationships over the last two centuries.
d.
is borrowed from physical laws related to conversion of matter and energy.
c
Moderate
DISC: Costs of production
United States – BPROG: Analytic
Costs of production
Production, Input Choice, and Cost with One Variable Input
90. Which of the following statements is equivalent to the law of diminishing marginal returns?
a.
A stitch in time saves nine.
b.
You can’t make an omelet without breaking eggs.
c.
Too many cooks spoil the broth.
d.
If you can’t stand the heat, get out of the kitchen.
c
Moderate
DISC: Costs of production
United States – BPROG: Reflective Thinking – BPROG: Analysis
Costs of production
Production, Input Choice, and Cost with One Variable Input
91. The marginal revenue product of an hour of labor used in steel production is equal to
a.
its marginal physical product times the hourly wage rate.
b.
its marginal physical product times the price of steel.
c.
the hourly wage rate.
d.
its marginal physical product divided by the price of steel.
Easy
DISC: Costs of production
United States – BPROG: Analytic
Costs of production
Production, Input Choice, and Cost with One Variable Input
92. When the marginal revenue product of an input is less than its price, the
a.
producer should expand the use of that input.
b.
price of the input will automatically rise in a free market.
c.
producer should reduce the use of that input.
d.
marginal physical product of that input must be below its average physical product.
DISC: Costs of production
United States – BPROG: Analytic
Costs of production
Production, Input Choice, and Cost with One Variable Input
93. In August 1988, the Los Angeles Kings hired Wayne Gretzky for $15 million in cash. The hockey team’s decision
must have been based on the expectation that
a.
Gretzky’s opportunity cost will exceed $15 million.
b.
Gretzky’s marginal revenue product will equal or exceed $15 million.
c.
the team’s total revenue will equal $15 million.
d.
Gretzky’s marginal revenue product will rise in the long run.
DISC: Costs of production
United States – BPROG: Analytic
Costs of production
Production, Input Choice, and Cost with One Variable Input
94. Marginal revenue product is the
a.
additional revenue from one additional dollar increase in price.
b.
change in the revenue product resulting from one additional unit of input.
c.
additional revenue from one additional unit of input.
d.
change in revenue resulting in one additional dollar in price.
DISC: Costs of production
United States – BPROG: Analytic
Costs of production
Production, Input Choice, and Cost with One Variable Input
95. Which of the following will not lead to increase in the marginal revenue product?
a.
MPP increases without any changes in the price.
b.
Price of the product increases without any changes in MPP.
c.
MPP and price of the product increases.
d.
MPP remains the same and price of the product falls.
DISC: Costs of production
United States – BPROG: Analytic
Costs of production
Production, Input Choice, and Cost with One Variable Input
96. If the firm’s marginal physical product is 8, and its handicrafts sell for $70, at a labor cost of $150, the firm is
operating
a.
short of an optimal input point.
b.
at the optimum input point.
c.
beyond the optimum input point.
d.
There isn’t enough information to determine if the input point is optimal.
DISC: Costs of production
United States – BPROG: Analytic
Costs of production
Production, Input Choice, and Cost with One Variable Input
97. Which of the following equations defines marginal revenue product?
a.
MRP = P times Q.
b.
MRP = total cost.
c.
MRP = total revenue minus total cost.
d.
MRP = MPP times price of the product.
DISC: Costs of production
United States – BPROG: Analytic
Costs of production
Production, Input Choice, and Cost with One Variable Input
BLOOMS: Application
98. The rule for the optimal use of any input says that
a.
when MRP is less than price, it pays to expand resource use.
b.
when MRP is greater than price, it pays to expand resource use.
c.
when MRP equals price, resource use should be cut back.
d.
resources should be used only if MRP exceeds price.
DISC: Costs of production
United States – BPROG: Analytic
Costs of production
Production, Input Choice, and Cost with One Variable Input
99. Which of the following indicates an input is being overused relative to the optimal level?
a.
MRP = P of input.
b.
MRP > P of input.
c.
MRP < P of input.
d.
MPP > P of output.
DISC: Costs of production
United States – BPROG: Analytic
Costs of production
Production, Input Choice, and Cost with One Variable Input
100. The optimal level of resource use comes when
a.
MRP exceeds input price.
b.
MRP is less than input price.
c.
MRP equals input price.
d.
use of the resource exhausts the producer’s funds.
DISC: Costs of production
United States – BPROG: Analytic
Costs of production
Production, Input Choice, and Cost with One Variable Input
101. The optimum quantity of an input occurs when
a.
diminishing returns set in.
b.
marginal revenue product equals input price.
c.
marginal physical product equals input price.
d.
marginal revenue product equals output price.
DISC: Costs of production
United States – BPROG: Analytic
Costs of production
Production, Input Choice, and Cost with One Variable Input
102. Which of the following is the correct statement of the marginal rule for optimal input proportions? The input
proportion is optimal when
a.
PA = PB.
b.
MPPA = MPPB.
c.
PA × MPPA = PB × MPPB.
d.
PA/PB = MPPA/MPPB.
DISC: Costs of production
United States – BPROG: Analytic
Costs of production
Production, Input Choice, and Cost with One Variable Input
103. A firm practices input substitution when it
a.
retrains Joe the welder as a painter and Pat the painter as a welder.
b.
buys extra machines for its workers to use.
c.
allows fixed cost to become variable.
d.
replaces unskilled labor with automated machinery.
DISC: Costs of production
United States – BPROG: Analytic
Costs of production
Multiple Input Decisions: The Choice of Optimal Input Combinations
104. Determining the optimal choice of input combinations generally does not involve
a.
substitution of one input for another.
b.
fixing the level of technology in the long run.
c.
minimizing cost, given the prices of inputs.
d.
assessing the productivity of various inputs.
DISC: Costs of production
United States – BPROG: Analytic
Costs of production
Multiple Input Decisions: The Choice of Optimal Input Combinations
105. If the marginal physical product of more labor is twice as high as the marginal physical product of more machinery, a
rational firm should
a.
reduce the labor used and increase the machinery used if labor costs half as much as machinery.
b.
reduce the labor used and increase the machinery used if labor and machinery cost the same amount.
c.
reduce the labor used and increase the machinery used only if labor costs more than twice as much as
machinery.
d.
reduce the labor used and increase the machinery used only if labor costs exactly twice as much as machinery.
DISC: Costs of production
United States – BPROG: Reflective Thinking – BPROG: Analysis
Costs of production
Multiple Input Decisions: The Choice of Optimal Input Combinations
106. At a given level of wheat output, one more unit of labor would produce 10 extra bushels, and one more unit of seed
would produce 30 extra bushels. A unit of labor costs $6, and a unit of seed costs $12. The farmer should
a.
produce less wheat.
b.
buy only seed.
c.
buy more seed and less labor.
d.
buy less seed and more labor.
DISC: Costs of production
United States – BPRPOG: Analysis
Costs of production
Multiple Input Decisions: The Choice of Optimal Input Combinations
107. A firm is operating with an optimal combination of inputs. Suddenly the price of one input rises. The firm should
a.
buy less of that input and more of the other input.
b.
change its input mix so that the marginal physical product of the input whose price has risen falls and the
marginal physical product of the other input rises.
c.
buy less of whichever input now has the highest money price and more of the other input.
d.
reduce its output.
DISC: Costs of production
United States – BPRPOG: Analysis
Costs of production
Multiple Input Decisions: The Choice of Optimal Input Combinations
108. A firm’s optimal input proportions may change if
a.
input prices change.
b.
the relative marginal productivities of the inputs change.
c.
the firm’s optimal output level changes.
d.
All of the above are correct.
DISC: Costs of production
United States – BPROG: Reflective Thinking – BPROG: Analysis
Costs of production
Multiple Input Decisions: The Choice of Optimal Input Combinations
109. A firm uses two inputs, A and B. At its optimal choice of input proportions,
a.
MRP of A = MRP of B.
b.
MRPA/PA = MRPB/PB.
c.
MPP of A = MPP of B.
d.
All of the above are correct.
DISC: Costs of production
United States – BPRPOG: Analysis
Costs of production
Multiple Input Decisions: The Choice of Optimal Input Combinations
110. Where should a producer stop devoting more of his spending on labor if initially the MRP of the additional dollar
spent on labor is higher than the MRP of the additional unit spent on tools?
a.
MRP/$ of additional labor falls below MRP/$ of additional tools.
b.
MRP/$ of additional capital increases above MRP/$ of additional tools.
c.
MRP/$ of additional labor becomes equal to MRP/$ of additional tools.
d.
MRP/$ of the additional labor falls to zero.
DISC: Costs of production
United States – BPRPOG: Analysis
Costs of production
Multiple Input Decisions: The Choice of Optimal Input Combinations
111. If the MPP of labor is 60 and the price of labor per period is $20, the MPP of machinery is 75 and the price of the
machinery per period is $25, in order to achieve optimal input proportions the firm should use
a.
more labor and less machinery.
b.
more machinery and less labor.
c.
more labor with the same amount of machinery.
d.
the current combination.
d
1
Difficult
DISC: Costs of production
United States – BPRPOG: Analysis
Costs of production
Multiple Input Decisions: The Choice of Optimal Input Combinations
BLOOM’S: Analysis
112. The firm can calculate all points on its total cost curve if it knows
a.
its production function.
b.
the prices of inputs and of output.
c.
its average cost at its optimal output level.
d.
the prices of inputs and its production function.
d
1
Moderate
DISC: Costs of production
United States – BPROG: Analytic
Costs of production
Multiple Input Decisions: The Choice of Optimal Input Combinations
Table 7-4
6
346
490
600
692
775
846
5
316
448
548
632
705
775
4
282
400
480
564
632
692
CAPITAL
3
245
346
423
490
548
600
2
200
282
346
400
448
490
1
141
200
245
282
316
346
0
1
2
3
4
5
6
LABOR
113. Table 7-4 shows a production relationship. Assuming the capital stock is fixed at three units and the cost per day of
labor is $65, what is the most labor that it is efficient to hire if the product price is $1 per unit?
a.
2
b.
3
c.
4
d.
5
1
DISC: Costs of production
United States – BPROG: Analytic
Costs of production
Multiple Input Decisions: The Choice of Optimal Input Combinations
114. Table 7-4 shows a production relationship. The cost of one day of labor is $65 and the product price is $1 per unit.
How much will the labor input increase if the capital stock were increased from 3 to 4?
a.
from 3 to 4
b.
from 4 to 5
c.
from 4 to 6
d.
stays the same
b
1
DISC: Costs of production
United States – BPRPOG: Analysis
Costs of production
Multiple Input Decisions: The Choice of Optimal Input Combinations
115. The production relationship in Table 7-4 indicates a process characterized by
a.
decreasing returns to scale.
b.
constant returns to scale.
c.
increasing returns to scale.
d.
increasing then decreasing returns to scale.
b
1
DISC: Costs of production
United States – BPROG: Reflective Thinking – BPROG: Analysis
Costs of production
Multiple Input Decisions: The Choice of Optimal Input Combinations
116. Table 7-4 shows a production relationship. Assuming the labor input is fixed at 4, what will be the optimum capital
input assuming an output price of $1 and a $90-per-day cost for one unit of capital?
a.
1
b.
2
c.
3
d.
4
1
DISC: Costs of production
United States – BPRPOG: Analysis
Costs of production
Multiple Input Decisions: The Choice of Optimal Input Combinations
117. To determine total cost, the businessperson must know
a.
input quantity and output price.
b.
output quantity and output price.
c.
output quantity and input price.
d.
input quantity and input price.
DISC: Costs of production
United States – BPROG: Analytic
Costs of production
Cost and Its Dependence on Output
118. Marginal cost
a.
is the increase in total cost resulting from production of one additional unit of output.
b.
is the cost of the marginal unit of output.
c.
and the average cost curve are U-shaped.
d.
All of the above are correct.
DISC: Costs of production
United States – BPROG: Analytic
Costs of production
Cost and Its Dependence on Output
119. On Naomi’s pig farm, Naomi hires all the labor used, grows all the grain fed to the pigs, and owns the barn. The costs
used to calculate the total cost curve include
a.
only the cost of labor.
b.
only the cost of labor and the cost of grain, which is completely consumed in the period in which it is grown.
c.
only the variable cost of growing grain.
d.
the cost of labor, the cost of growing grain, and the opportunity cost of the barn.
DISC: Costs of production
United States – BPROG: Analytic
Costs of production
Cost and Its Dependence on Output
120. A factory produces 1,000 radios a year, AVC = $10 and TFC = $5,000. The factory’s TC
a.
equals $15.
b.
equals $5,005.
c.
equals $15,000.
d.
cannot be determined from the information given.
DISC: Costs of production
United States – BPROG: Analytic
Costs of production
Cost and Its Dependence on Output
BLOOMS: Application
121. Marginal cost is the
a.
change in total cost resulting from the purchase of one more unit of the variable input.
b.
change in total cost resulting from the production of one more unit of output.
c.
difference between total fixed cost and total variable cost.
d.
difference between total cost and total expenditure.
DISC: Costs of production
United States – BPROG: Analytic
Costs of production
Cost and Its Dependence on Output
122. Where marginal cost is less than average cost,
a.
opportunity cost must have been excluded from the calculation of marginal cost.
b.
marginal cost must be falling.
c.
marginal cost must be rising.
d.
marginal cost may be rising, falling, or constant.
DISC: Costs of production
United States – BPROG: Reflective Thinking – BPROG: Analysis
Costs of production
Cost and Its Dependence on Output
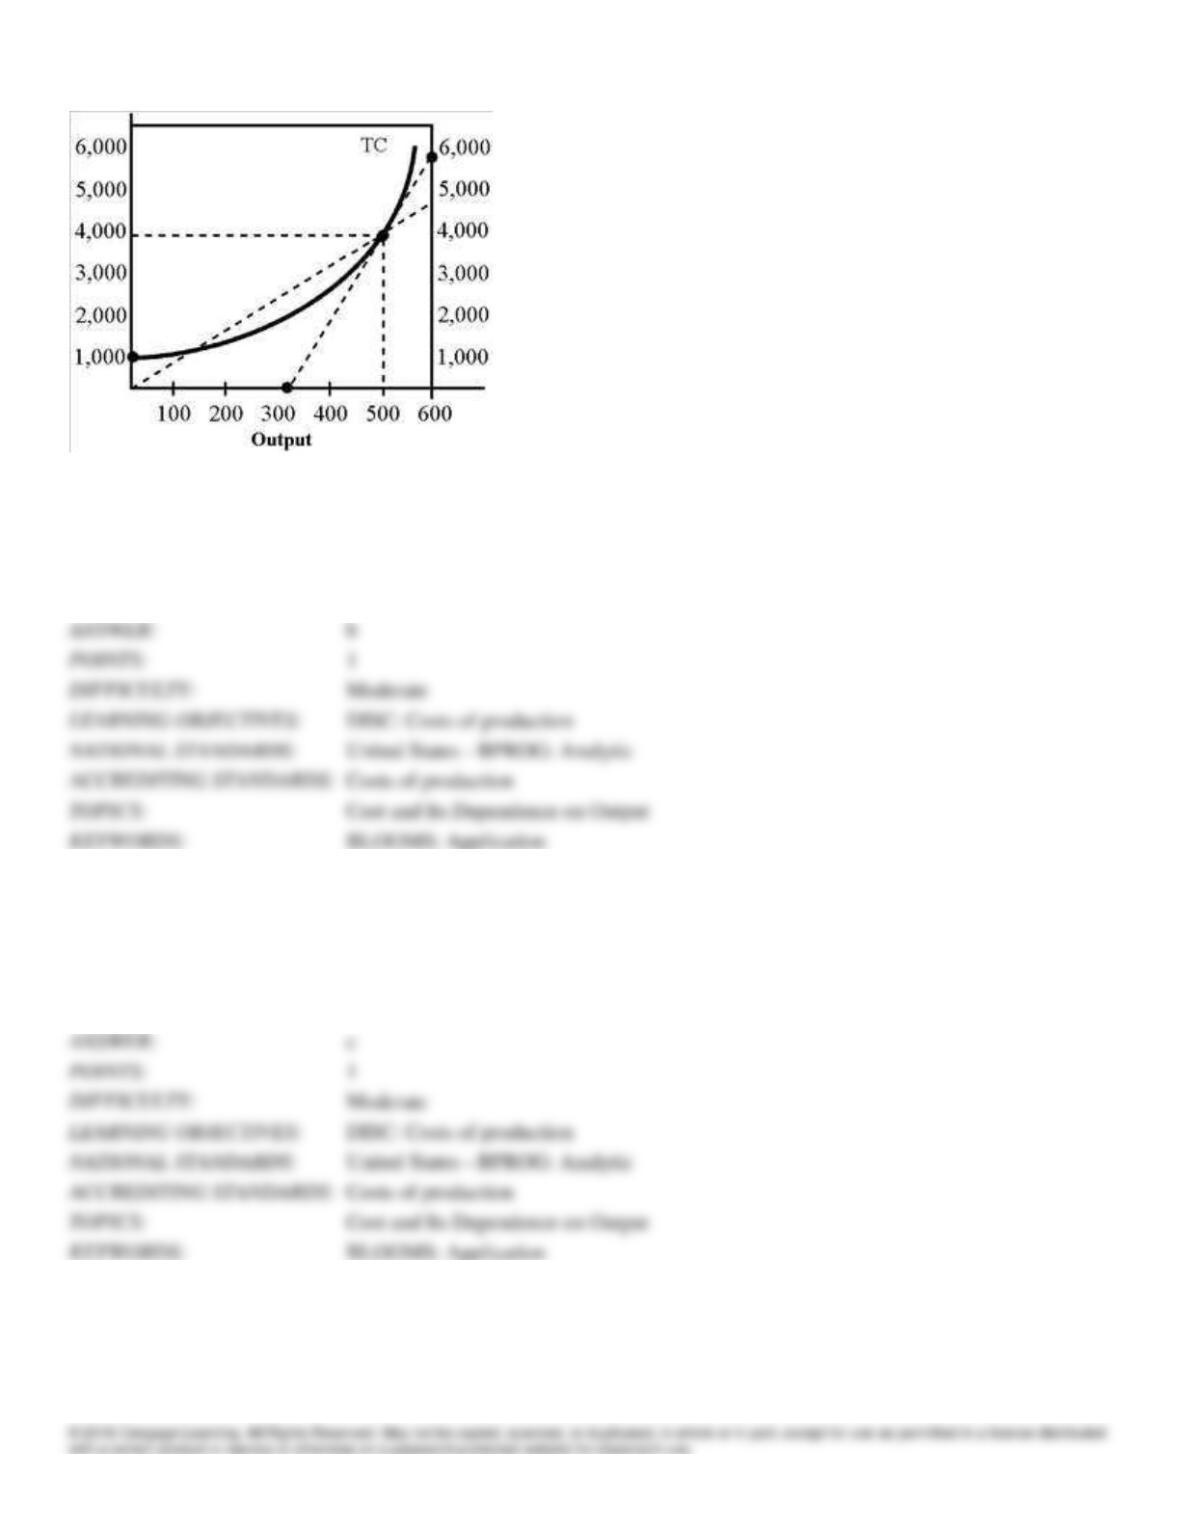
Figure 7-2
123. In Figure 7-2 at an output of 500, marginal cost equals
a.
10.
b.
20.
c.
30.
d.
40.
Moderate
DISC: Costs of production
United States – BPROG: Analytic
Costs of production
Cost and Its Dependence on Output
BLOOMS: Application
124. In Figure 7-2, average cost at 500 units of output equals
a.
4,000.
b.
200.
c.
8.
d.
6.
c
Moderate
DISC: Costs of production
United States – BPROG: Analytic
Costs of production
Cost and Its Dependence on Output
BLOOMS: Application
125. Al’s Donuts produces about 600 dozen doughnuts daily. If flour prices increase 20 percent
a.
only marginal cost will shift up.
b.
only marginal cost and average total cost will shift up.
c.
marginal cost, average variable cost, and average total cost will shift up.
d.
marginal cost, average total cost, average variable cost, and average fixed cost will shift up.
DISC: Costs of production
United States – BPROG: Reflective Thinking – BPROG: Analysis
Costs of production
Cost and Its Dependence on Output
BLOOMS: Application
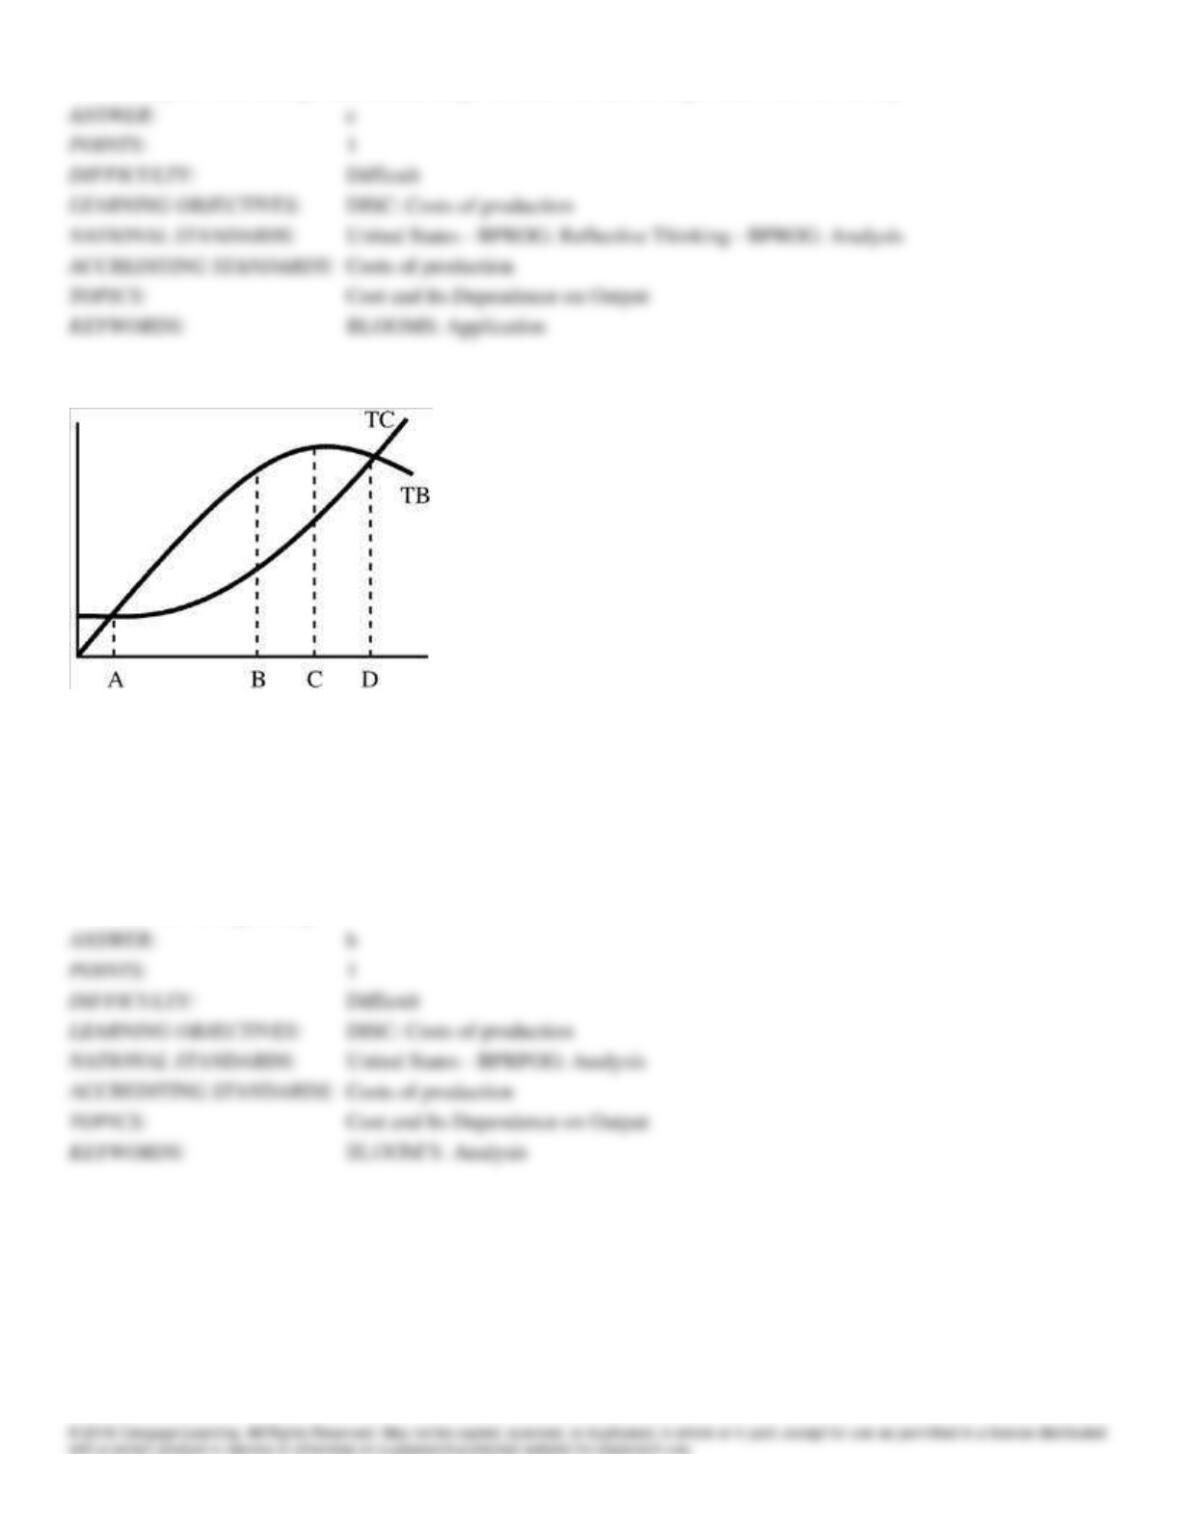
Figure 7-3
126. Government provides many goods and services to the public because they are not provided by free markets. Some
economists believe bureaucrats who manage the programs have no interest in maximizing net benefits (profits) but instead
maximize the size of a program constrained only by the need to have total benefits exceed total costs. Figure 7-3 shows
total benefits and cost curves for a program. What point is the efficient point, and what point will the bureaucrat choose?
a.
A and B, respectively
b.
B and D, respectively
c.
D and C, respectively
d.
D and A, respectively
DISC: Costs of production
United States – BPRPOG: Analysis
Costs of production
Cost and Its Dependence on Output
Figure 7-4
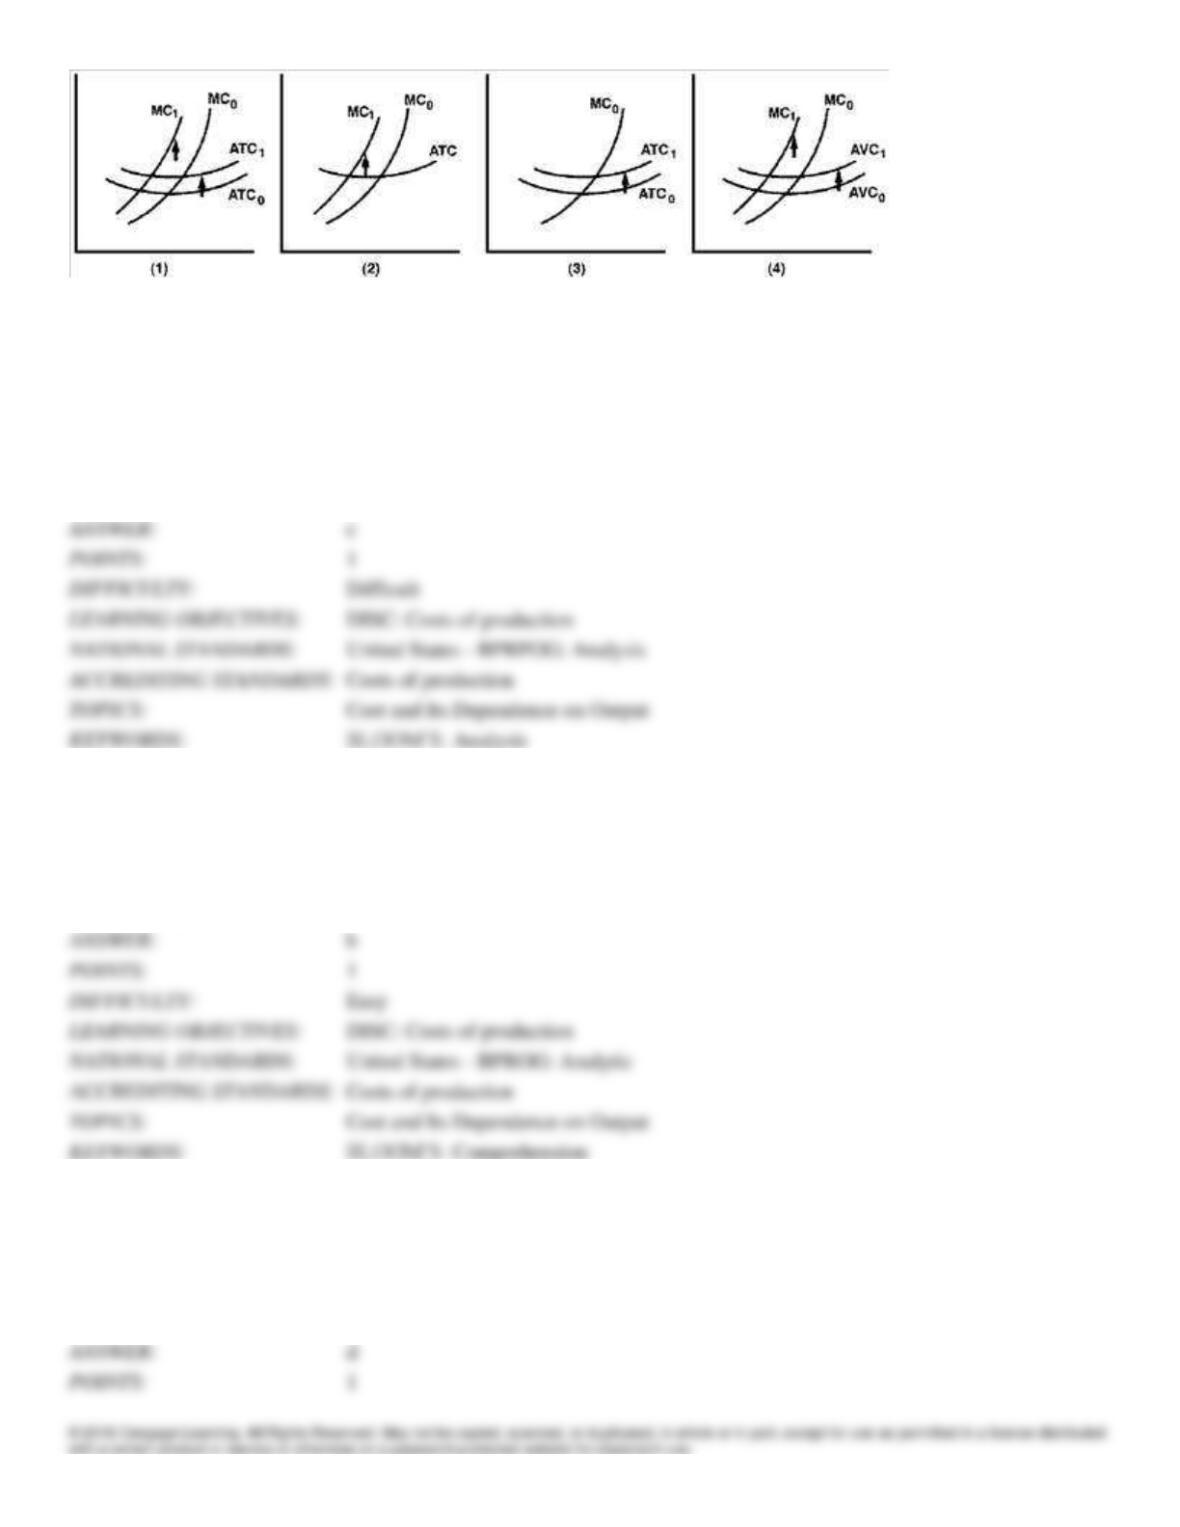
127. Following a rash of airplane bombs, the airlines have been forced to increase security at a cost of $30 million per
year. The number of inspectors and machines does not vary with the number of passengers-the airlines must have
sufficient staff available to handle the full-capacity load. Which graph in Figure 7-4 best illustrates the impact of the
security expenditures?
a.
1
b.
2
c.
3
d.
4
1
DISC: Costs of production
United States – BPRPOG: Analysis
Costs of production
Cost and Its Dependence on Output
128. Average cost curves have the same shape as
a.
total cost curves.
b.
marginal cost curves.
c.
total fixed cost curves.
d.
average fixed cost curves.
b
1
DISC: Costs of production
United States – BPROG: Analytic
Costs of production
Cost and Its Dependence on Output
129. Total fixed cost
a.
increases as output increases.
b.
declines as output increases.
c.
is always zero.
d.
remains constant even if the firm shuts down.
d
1
DISC: Costs of production
United States – BPROG: Analytic
Costs of production
Cost and Its Dependence on Output
130. Which of the following observations is true?
a.
TFC remains the same irrespective of units of output produced.
b.
TVC remains the same irrespective of units of output produced.
c.
TVC falls as the unit of output increases.
d.
AFC increases as output increases further and further.
DISC: Costs of production
United States – BPROG: Analytic
Costs of production
Cost and Its Dependence on Output
131. A roller coaster operator produces thrill-packed rides using electricity and a roller coaster. For the roller coaster
operator, electricity is
a.
an opportunity cost.
b.
a variable cost.
c.
a fixed cost.
d.
a sunk cost.
DISC: Costs of production
United States – BPROG: Analytic
Costs of production
Cost and Its Dependence on Output
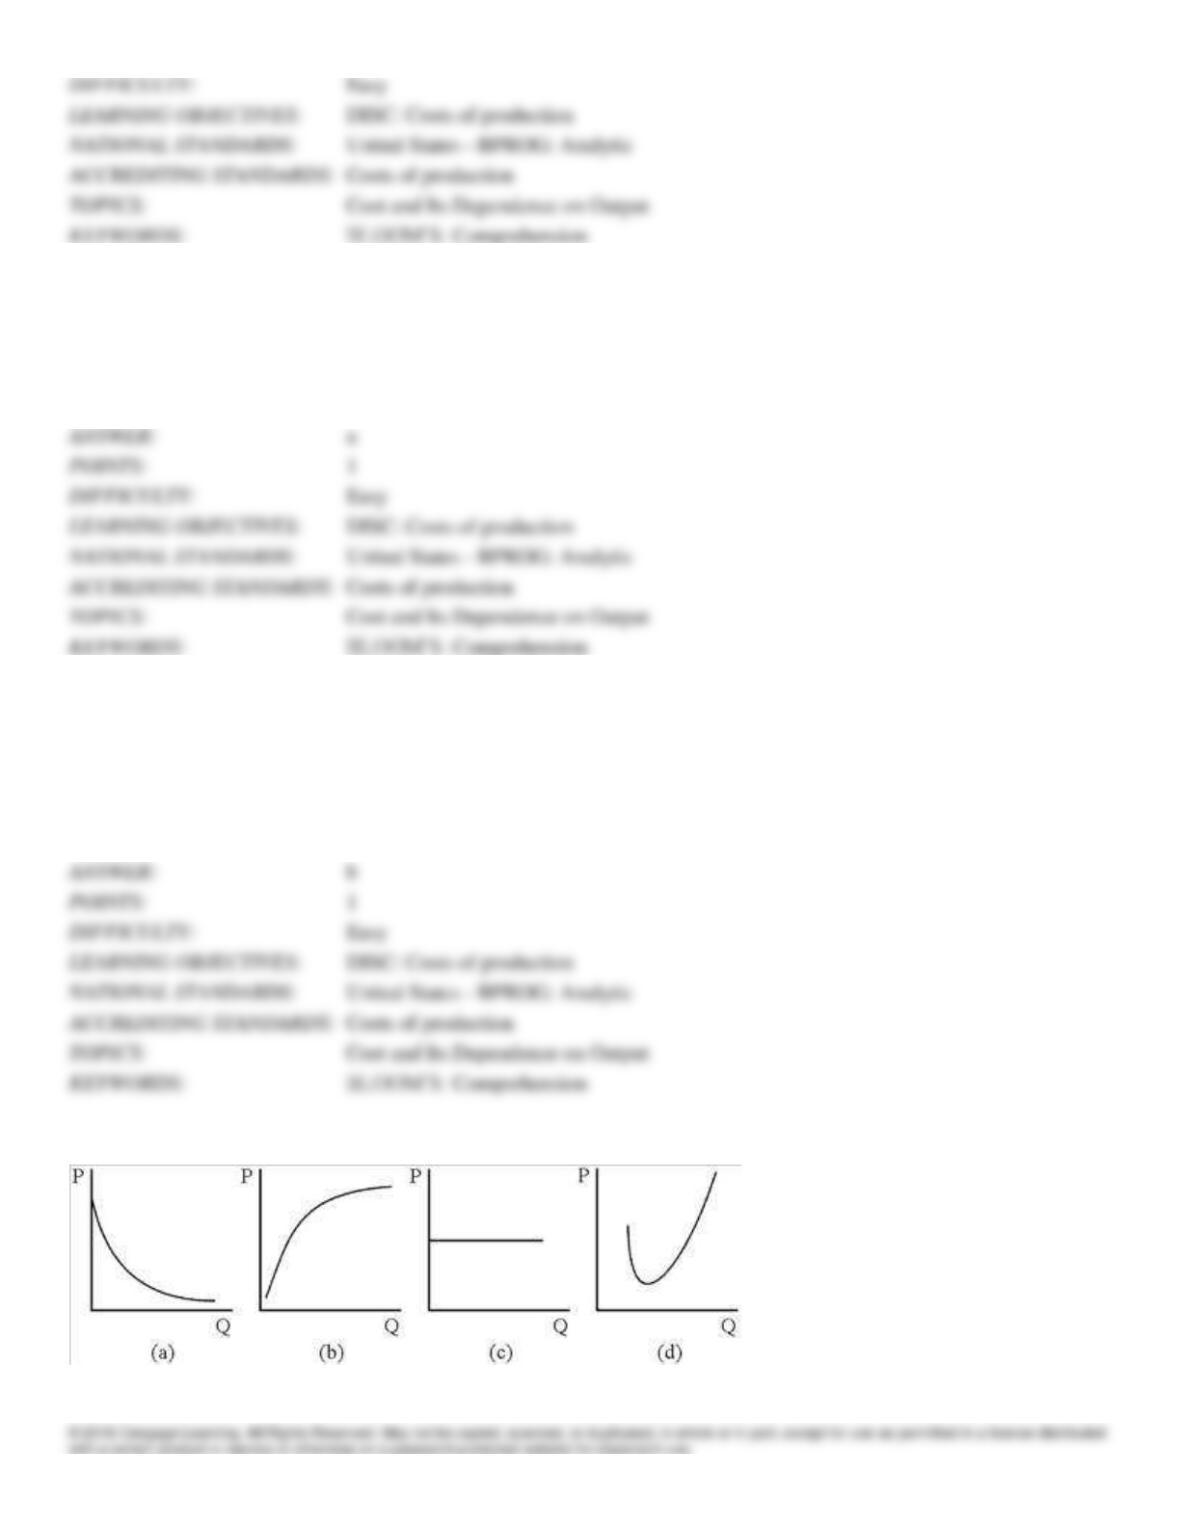
Figure 7-5
132. Which of the curves in Figure 7-5 could be a firm’s average fixed cost curve?