DEPENDENT VARIABLE:
QT
R−SQUARE
F−RATIO
P−VALUE ON F
OBSERVATIONS:
43
0.8644
127.5
0.0001
VARIABLE
PARAMETER
ESTIMATE
STANDARD
ERROR
T−RATIO
P−VALUE
INTERCEPT
22.5
9.32
2.41
0.0201
T
1.86
0.55
3.38
0.0016
D
2.0
0.71
2.82
0.0075
Given the above, what is the estimated intercept of the trend line in the second quarter?
a. 22.50
b. 24.50
c. 24.36
d. 2.00
e. none of the above
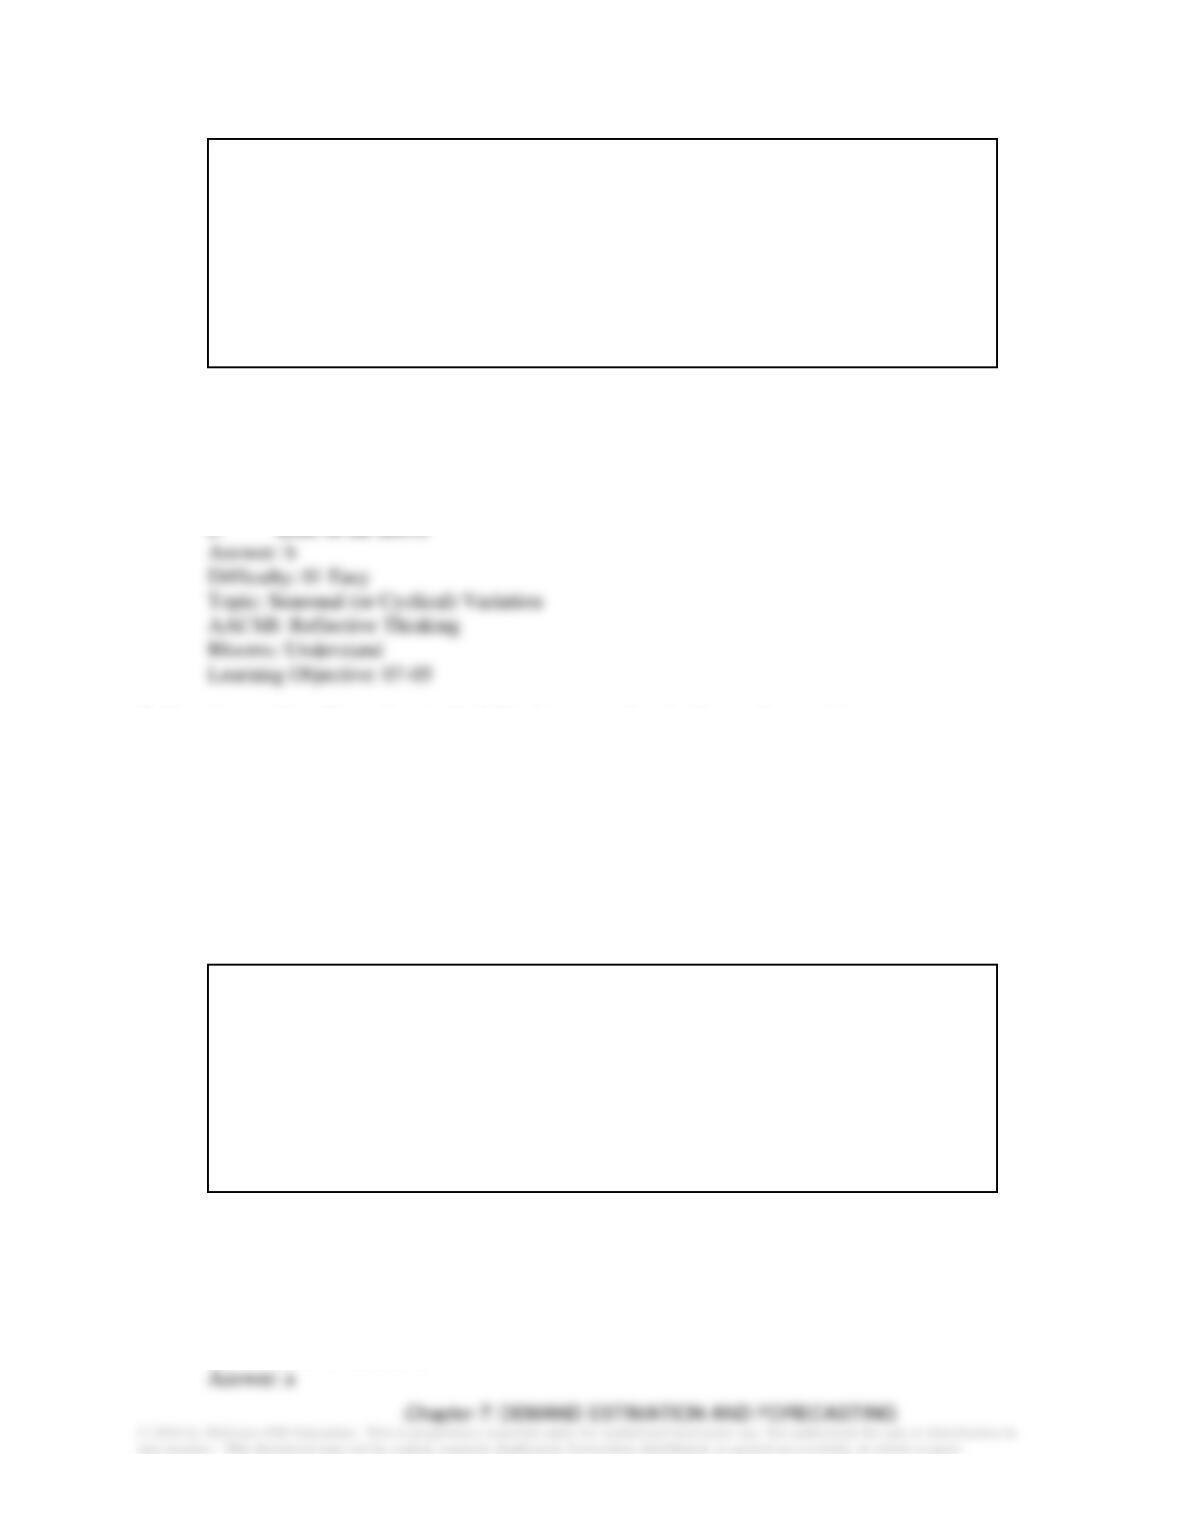
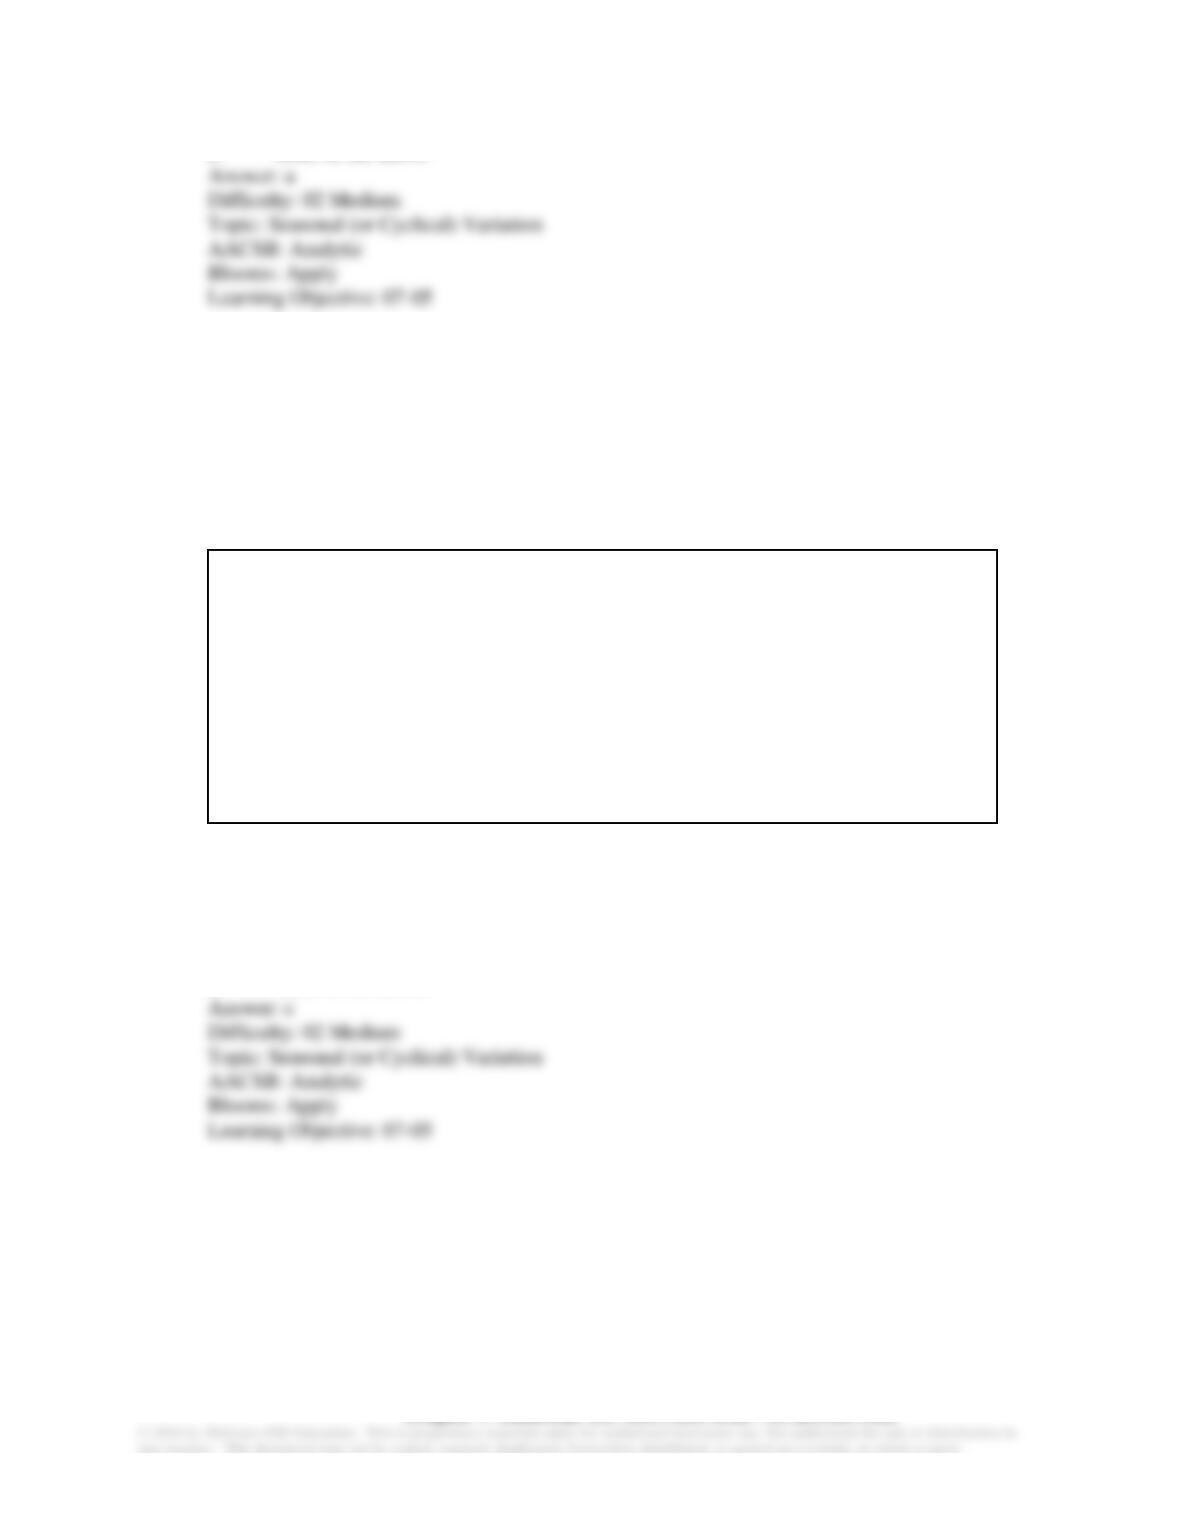
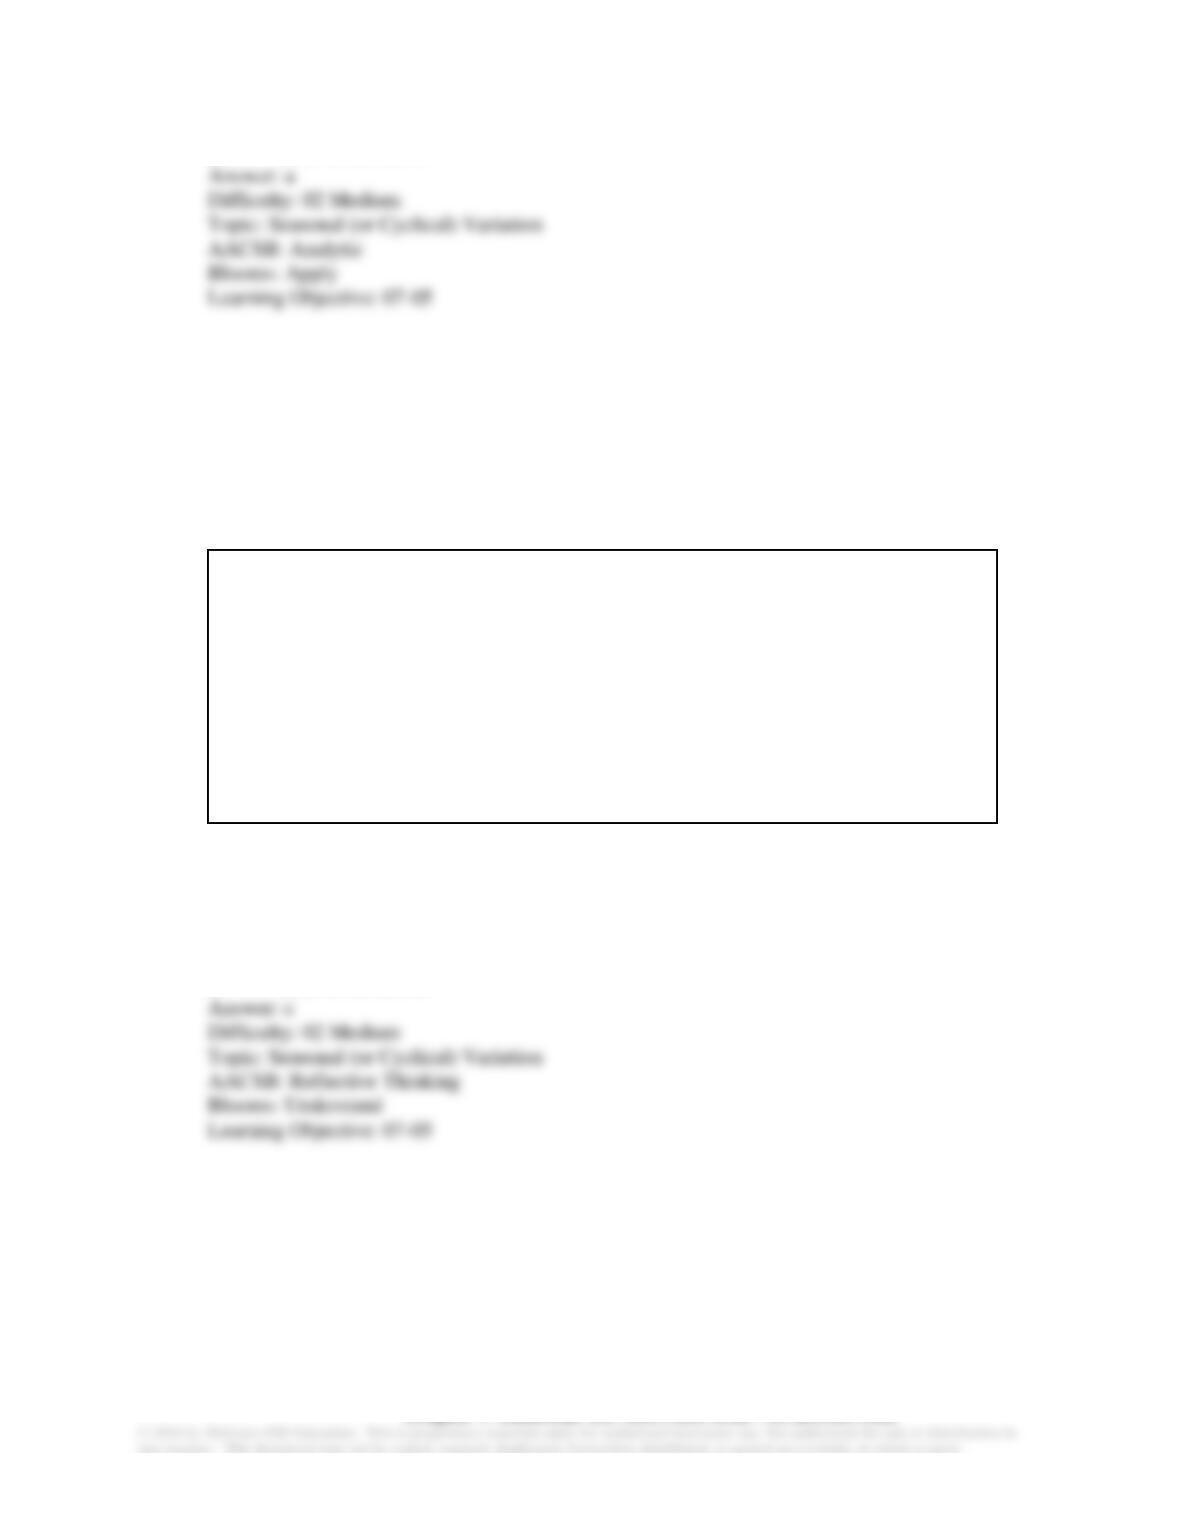
7-45 A consulting firm estimates the following quarterly sales forecasting model:
Qt=a+bt +cD
The equation is estimated using quarterly data from 2005I–2015III (t = 1,…, 43). The variable D
is a dummy variable for the second quarter where:
D = 1 in the second quarter, and 0 otherwise.
The results of the estimation are:
DEPENDENT VARIABLE:
QT
R−SQUARE
F−RATIO
P−VALUE ON F
OBSERVATIONS:
43
0.8644
127.5
0.0001
VARIABLE
PARAMETER
ESTIMATE
STANDARD
ERROR
T−RATIO
P−VALUE
INTERCEPT
22.5
9.32
2.41
0.0201
T
1.86
0.55
3.38
0.0016
D
2.0
0.71
2.82
0.0075
Given the above, what is the estimated intercept of the trend line in the third quarter?
a. 22.50
b. 24.50
c. 24.36
d. 2.00
e. none of the above
Chapter 7: DEMAND ESTIMATION AND FORECASTING
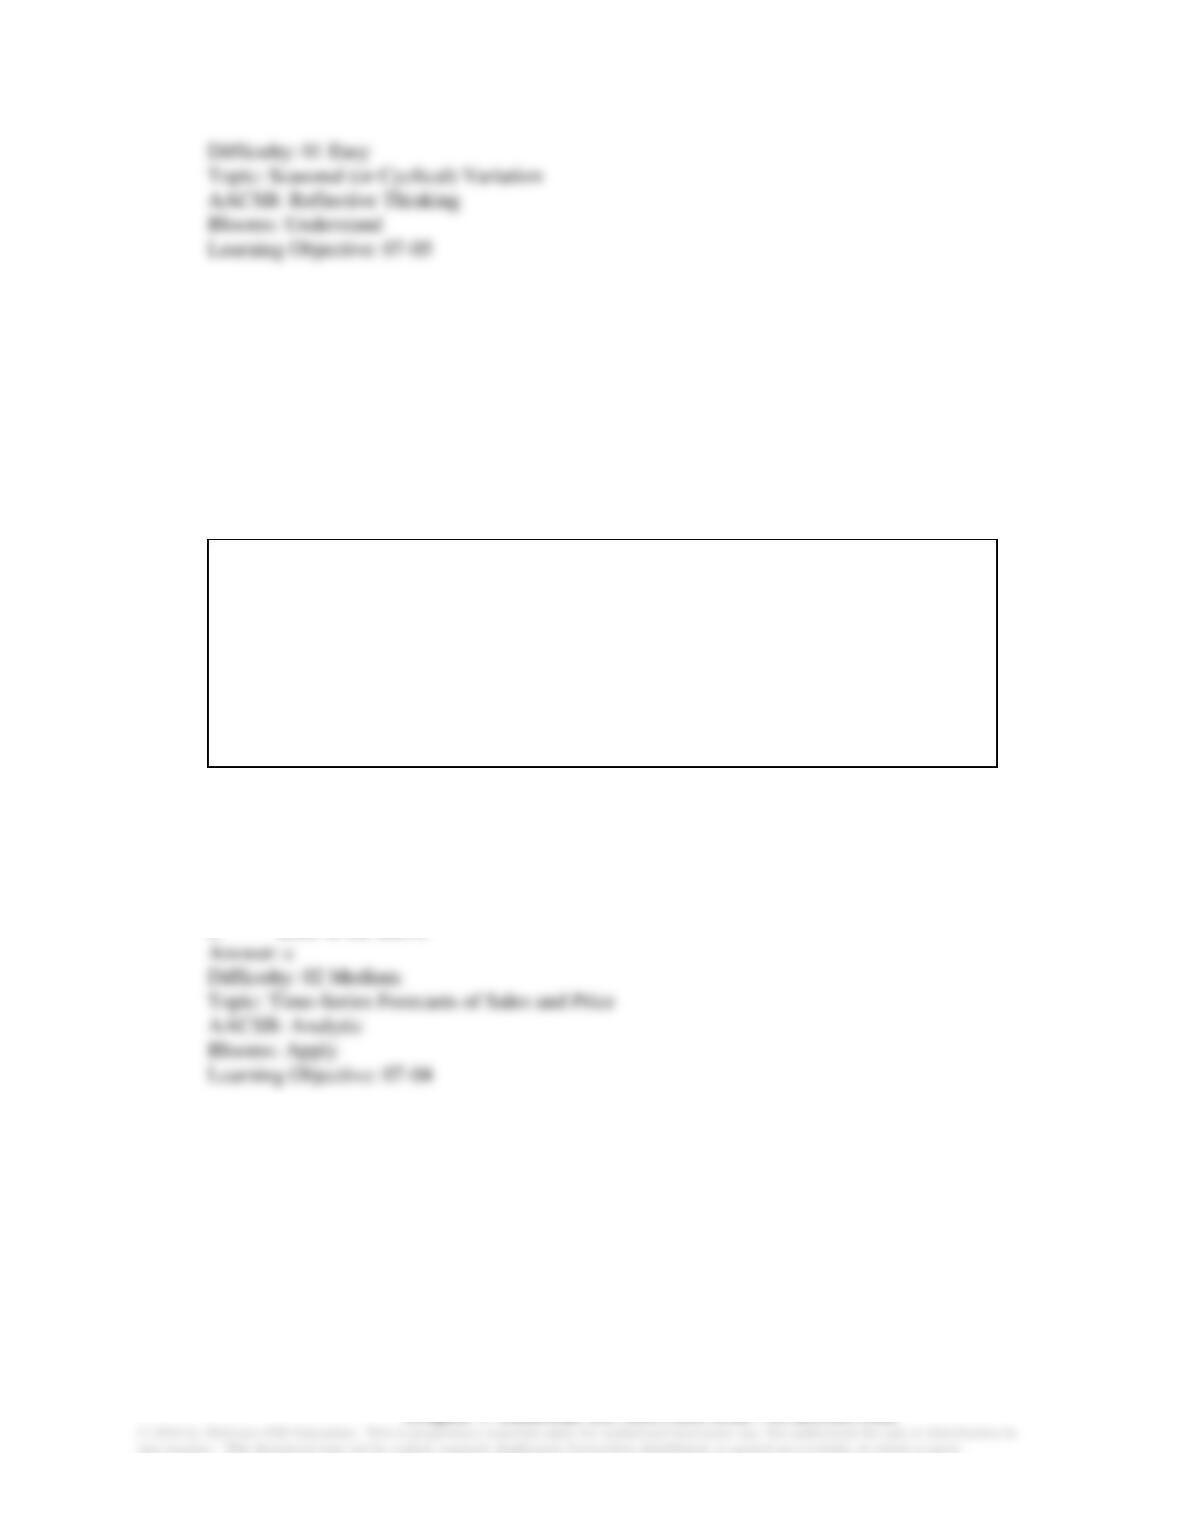
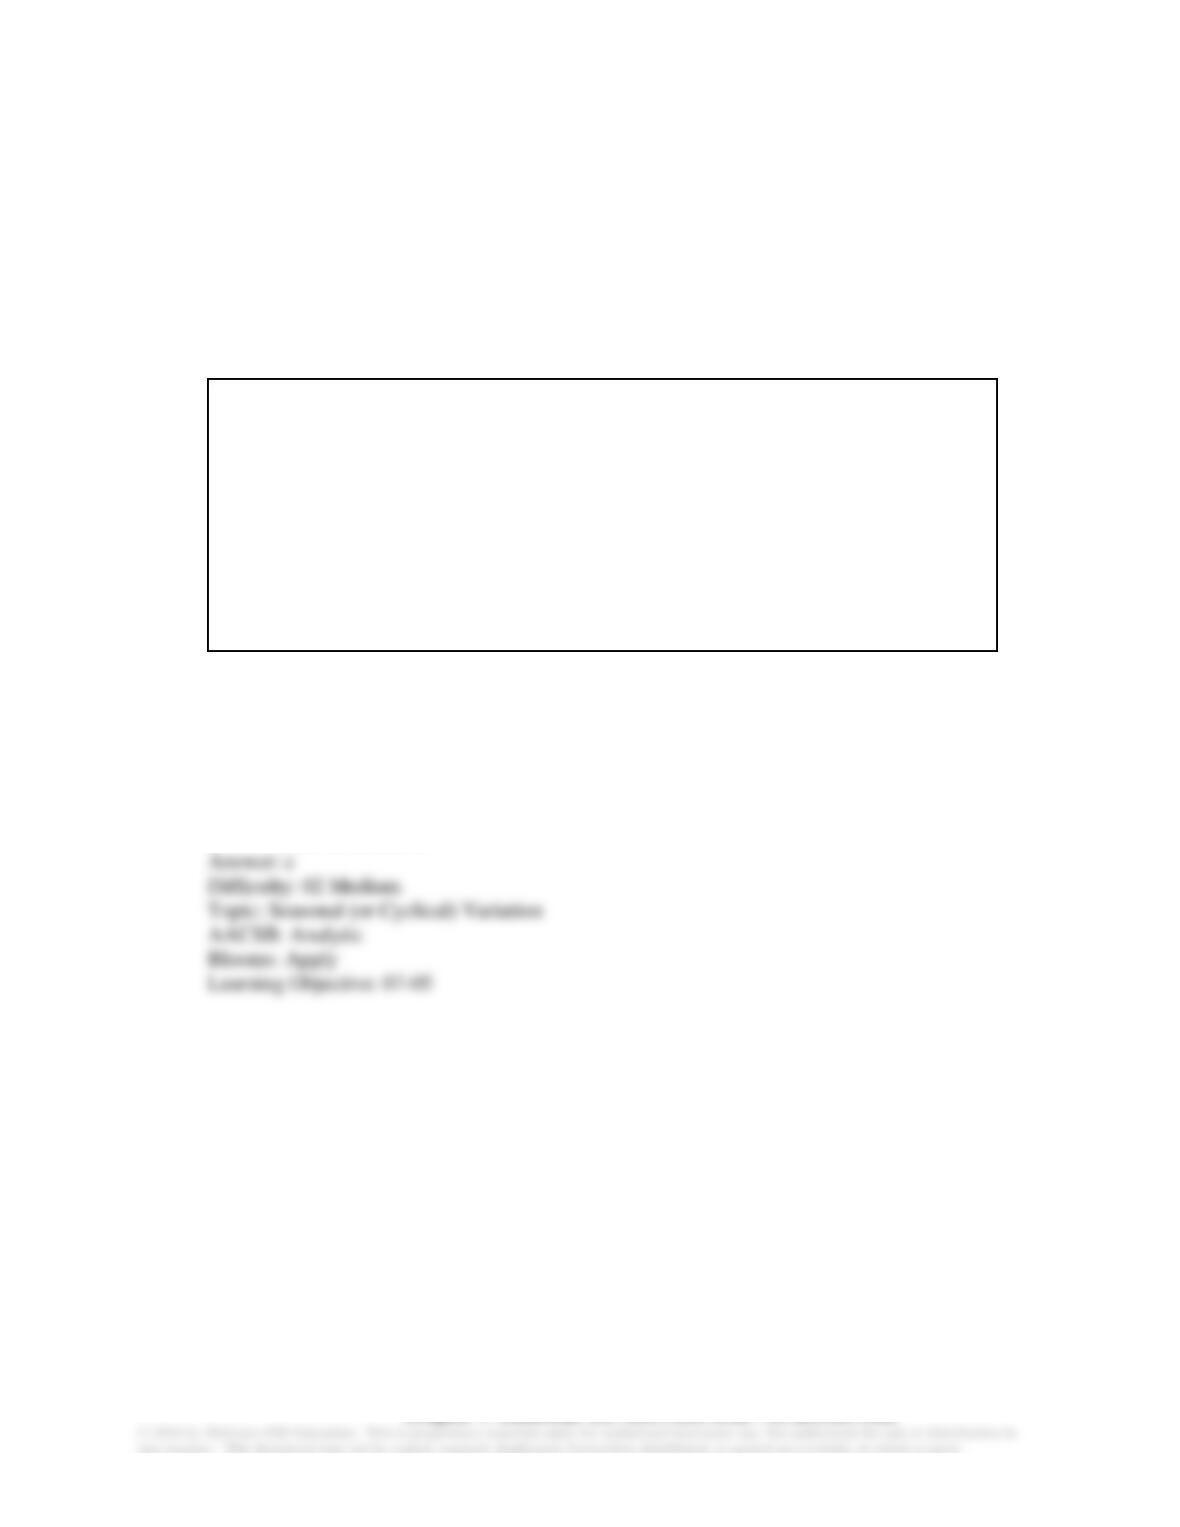
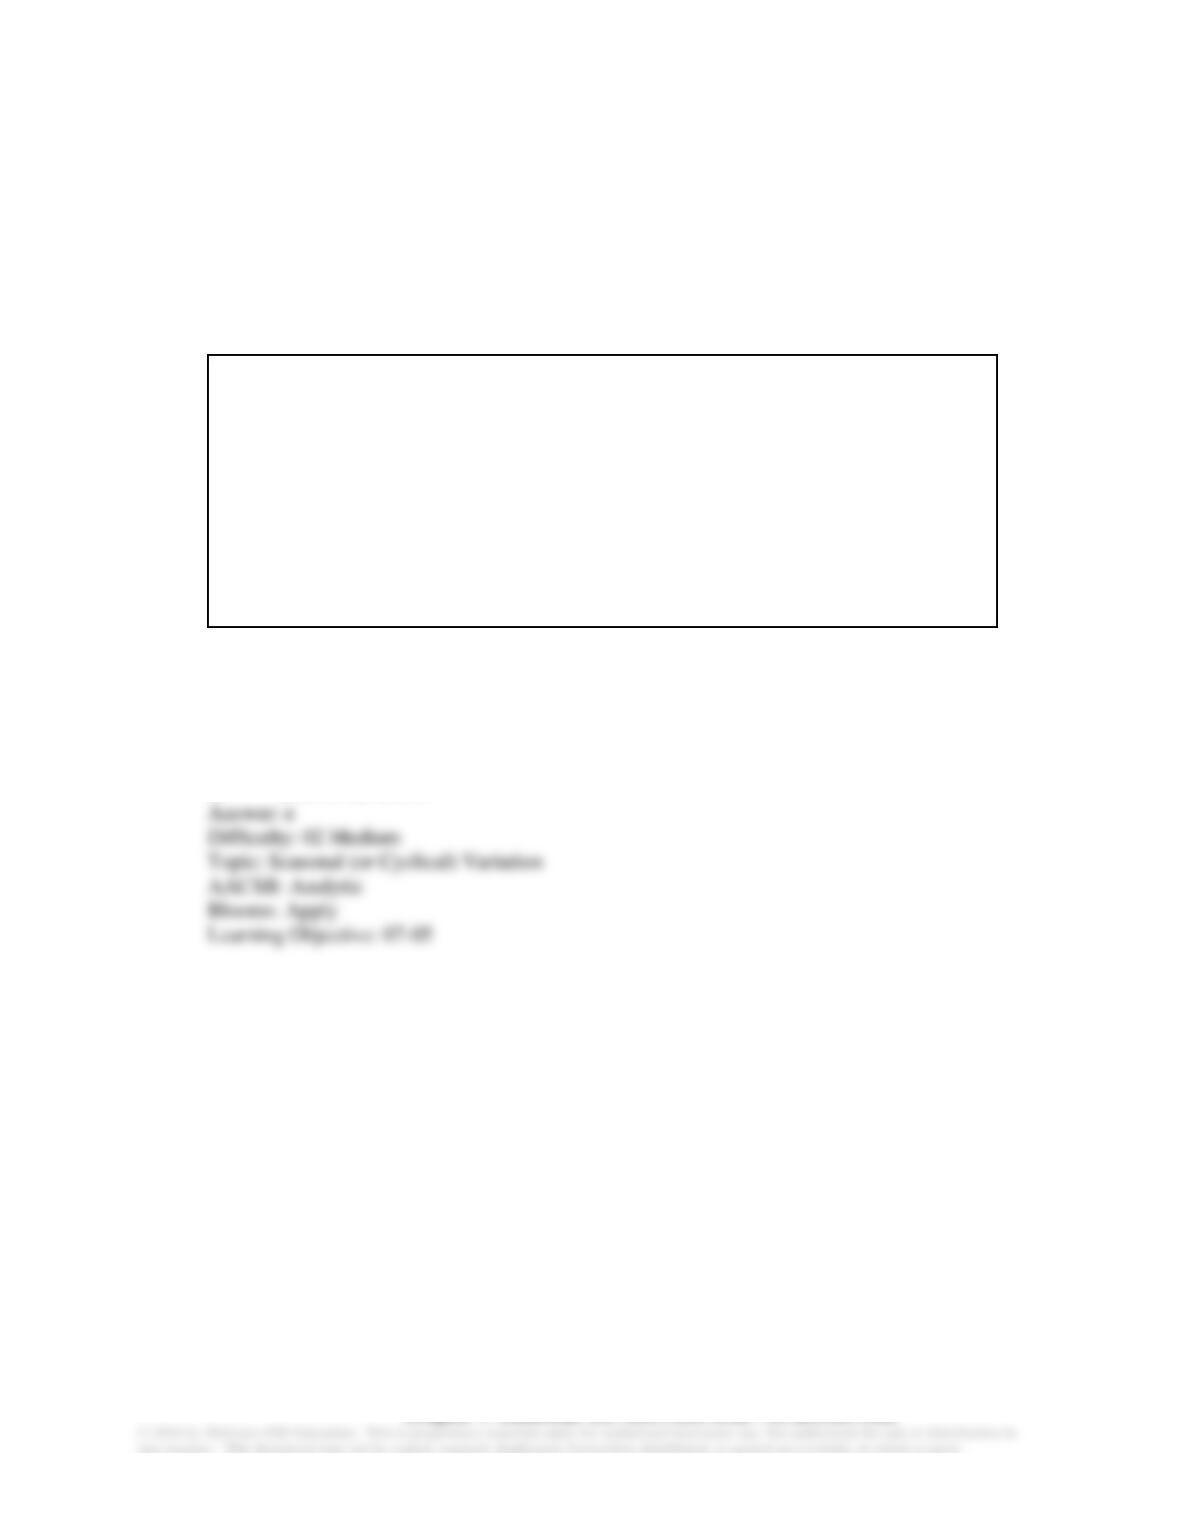
7-46 A consulting firm estimates the following quarterly sales forecasting model:
Qt=a+bt +cD
The equation is estimated using quarterly data from 2005I–2015III (t = 1,…, 43). The variable D
is a dummy variable for the second quarter where:
D = 1 in the second quarter, and 0 otherwise.
The results of the estimation are:
DEPENDENT VARIABLE:
QT
R−SQUARE
F−RATIO
P−VALUE ON F
OBSERVATIONS:
43
0.8644
127.5
0.0001
VARIABLE
PARAMETER
ESTIMATE
STANDARD
ERROR
T−RATIO
P−VALUE
INTERCEPT
22.5
9.32
2.41
0.0201
T
1.86
0.55
3.38
0.0016
D
2.0
0.71
2.82
0.0075
Using the estimated trend line above, what is the predicted level of sales in 2015IV ?
a. 110.06
b. 106.20
c. 104.34
d. 102.2
e. none of the above
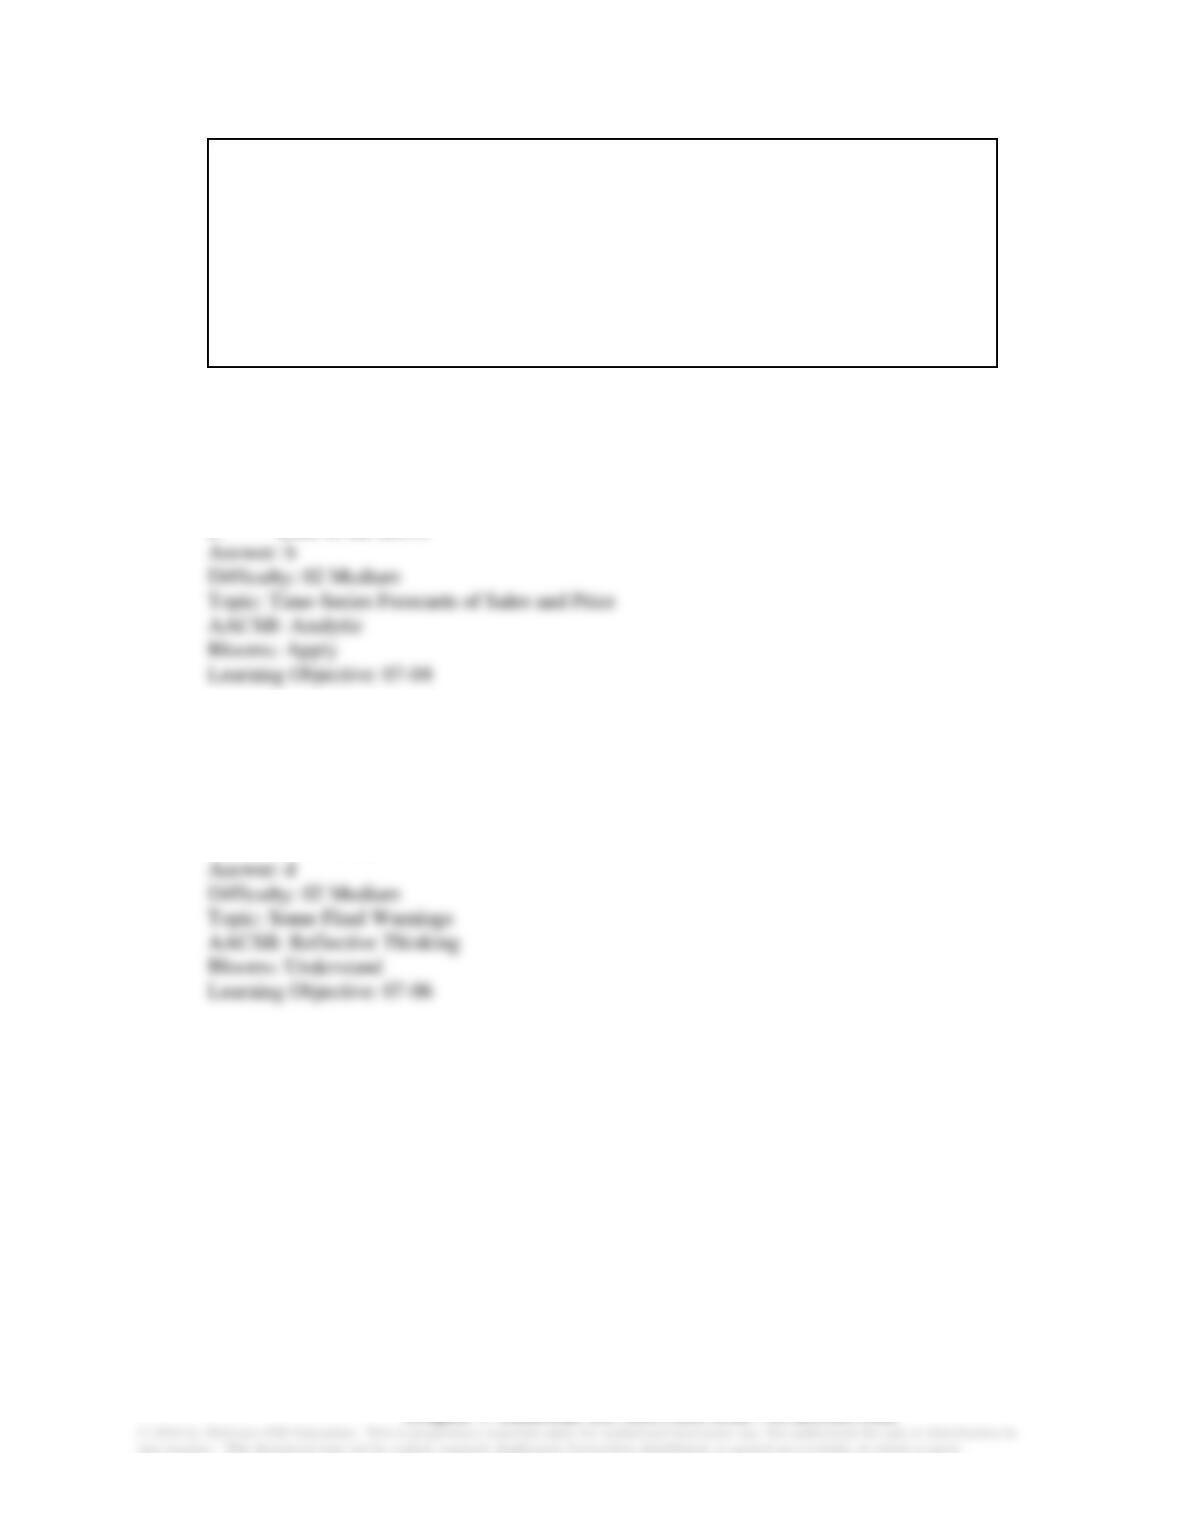
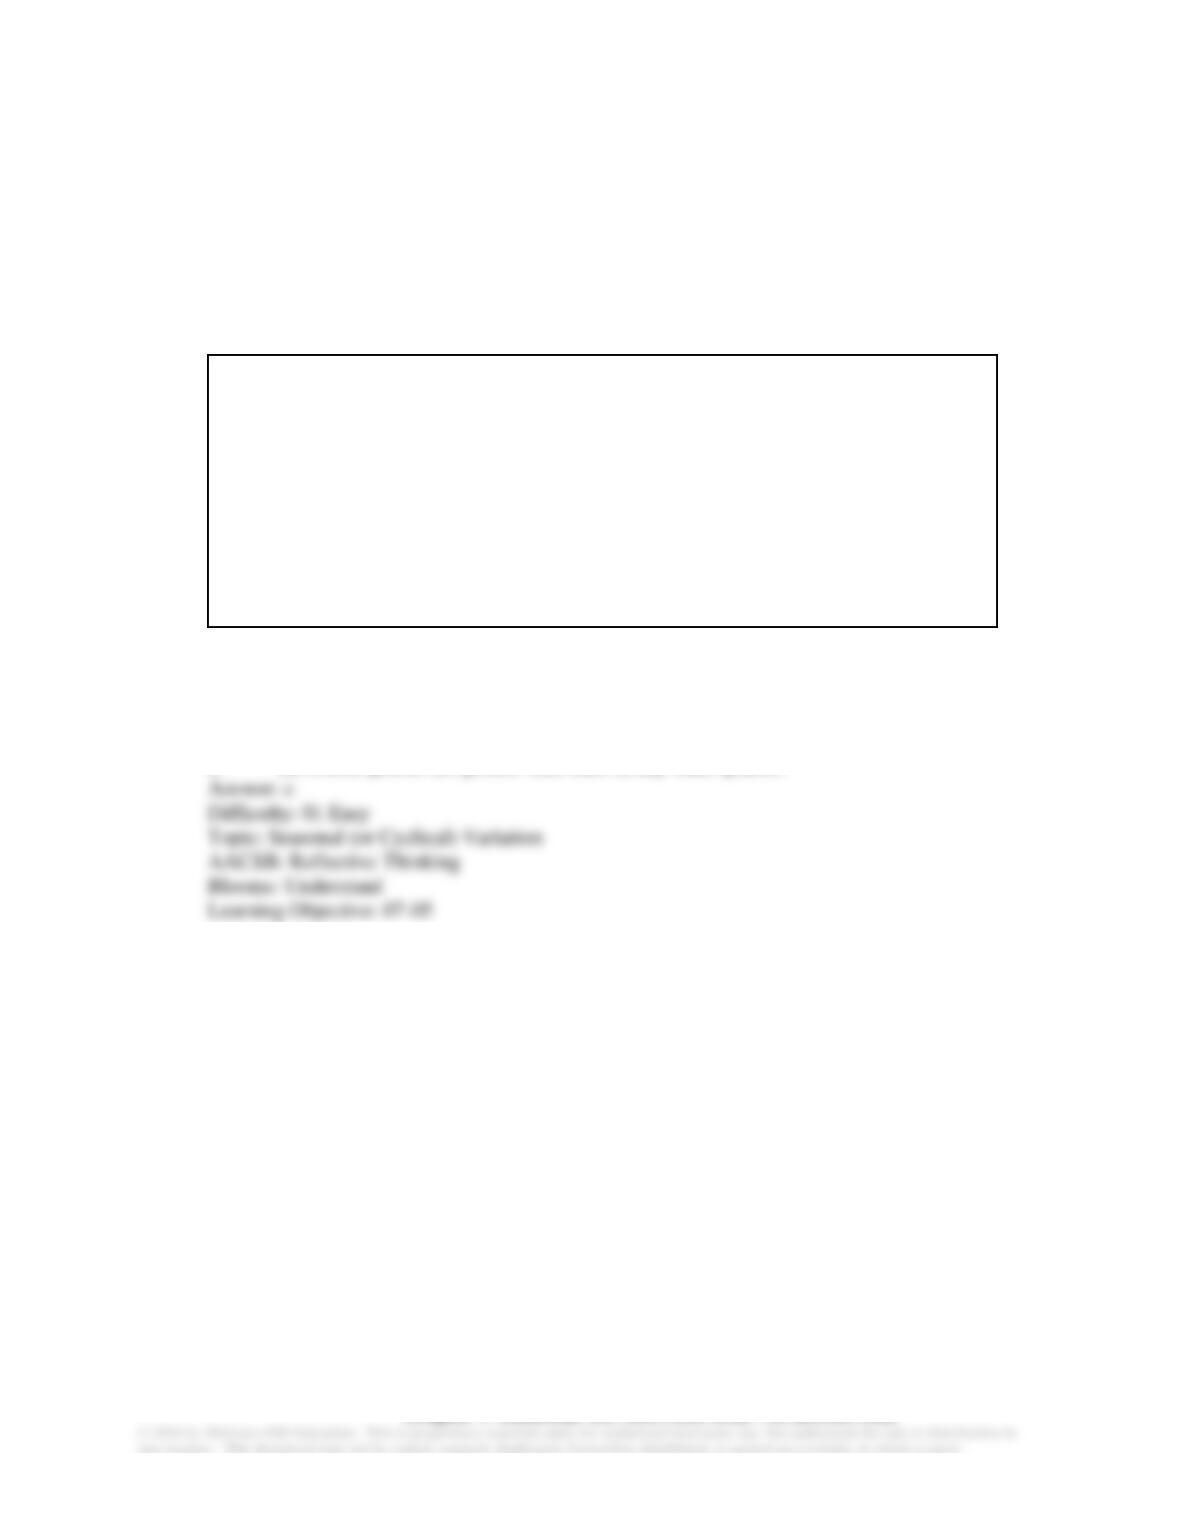
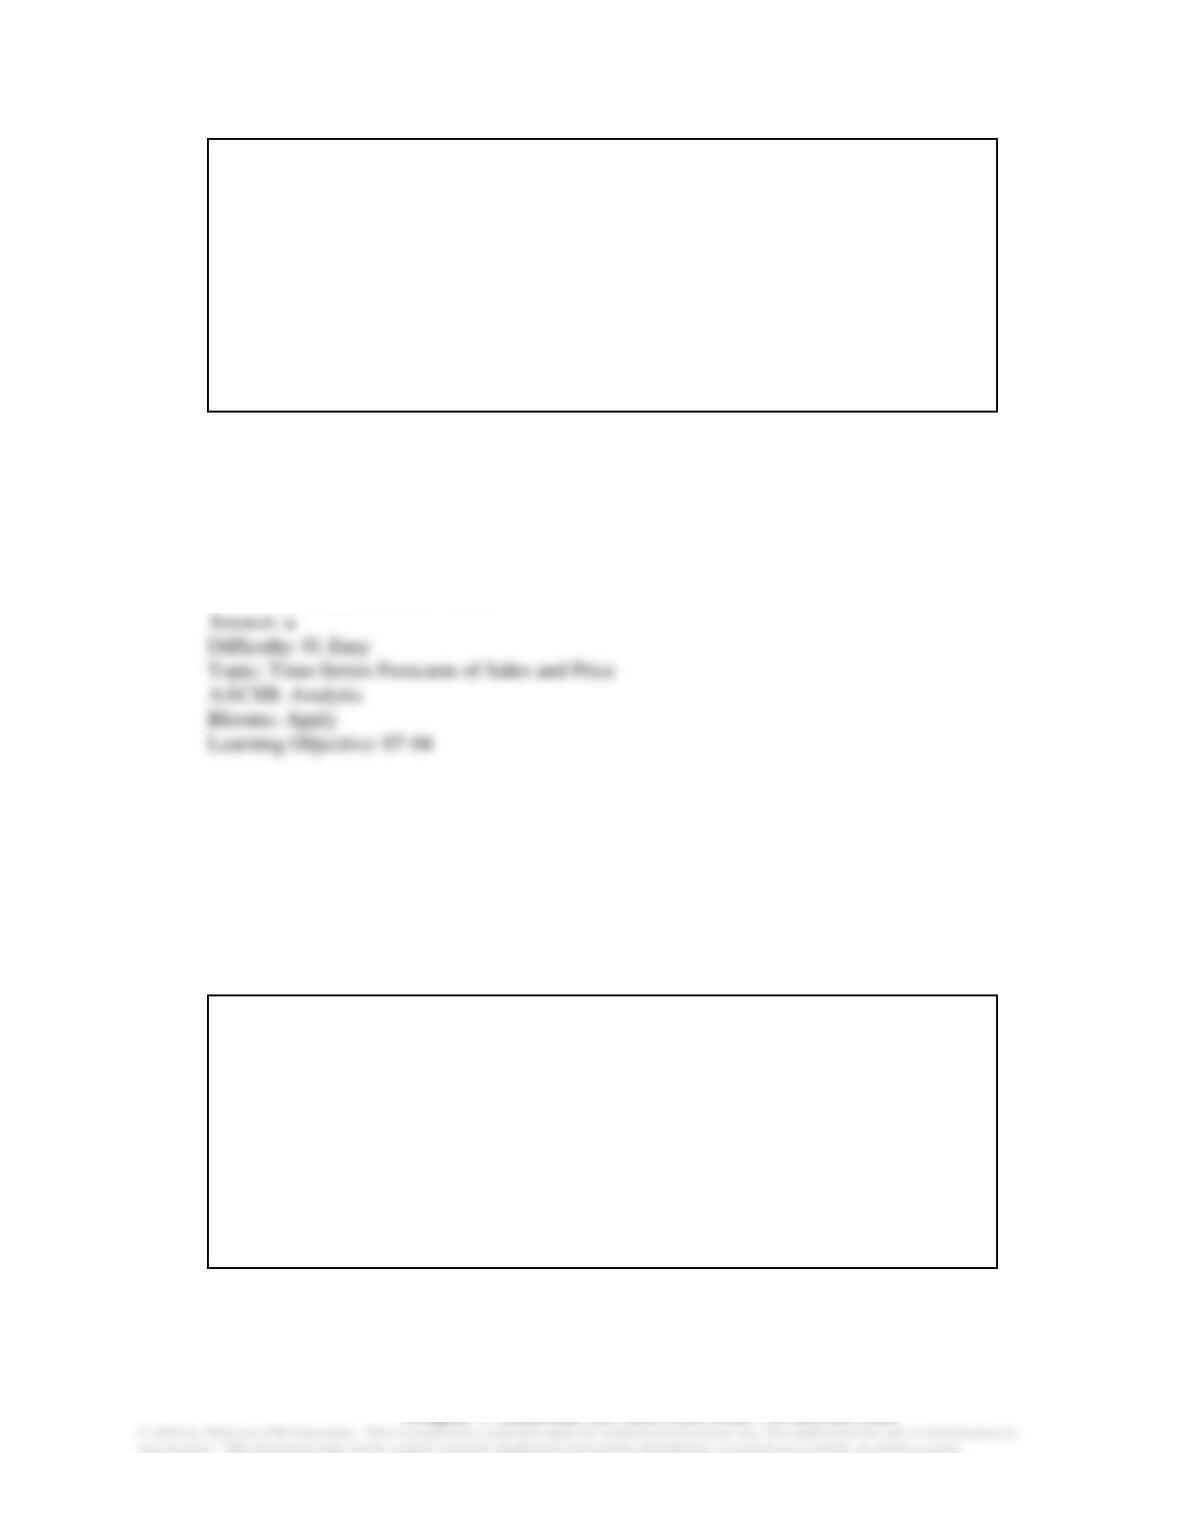
7-47 A consulting firm estimates the following quarterly sales forecasting model:
Qt=a+bt +cD
The equation is estimated using quarterly data from 2005I–2015III (t = 1,…, 43). The variable D
is a dummy variable for the second quarter where:
D = 1 in the second quarter, and 0 otherwise.
The results of the estimation are:
Chapter 7: DEMAND ESTIMATION AND FORECASTING
DEPENDENT VARIABLE:
QT
R−SQUARE
F−RATIO
P−VALUE ON F
OBSERVATIONS:
43
0.8644
127.5
0.0001
VARIABLE
PARAMETER
ESTIMATE
STANDARD
ERROR
T−RATIO
P−VALUE
INTERCEPT
22.5
9.32
2.41
0.0201
T
1.86
0.55
3.38
0.0016
D
2.0
0.71
2.82
0.0075
Using the estimated trend line above, what is the predicted level of sales in 2016I ?
a. 110.06
b. 106.20
c. 104.34
d. 102.2
e. none of the above
7-48 Problems in forecasting include:
a. estimates becoming more reliable the further you forecast into the future
b. specification error
c. cyclical variation
d. both b and c
e. all of the above
Chapter 7: DEMAND ESTIMATION AND FORECASTING
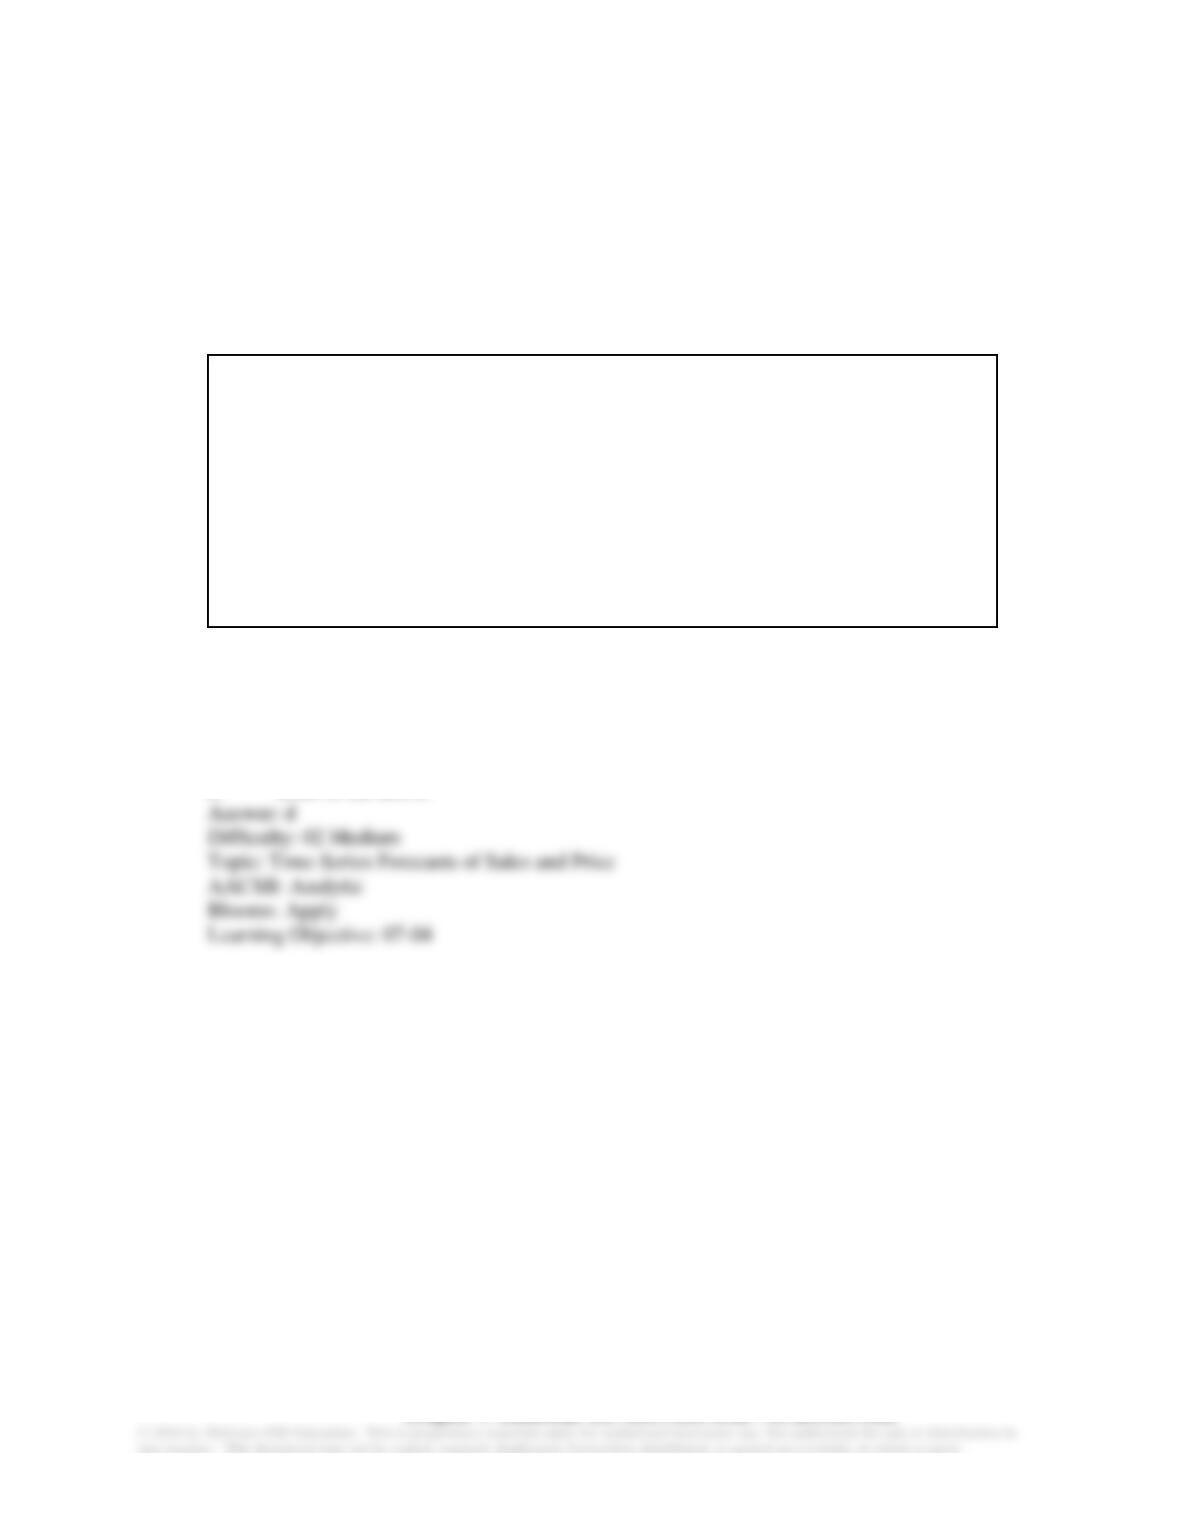
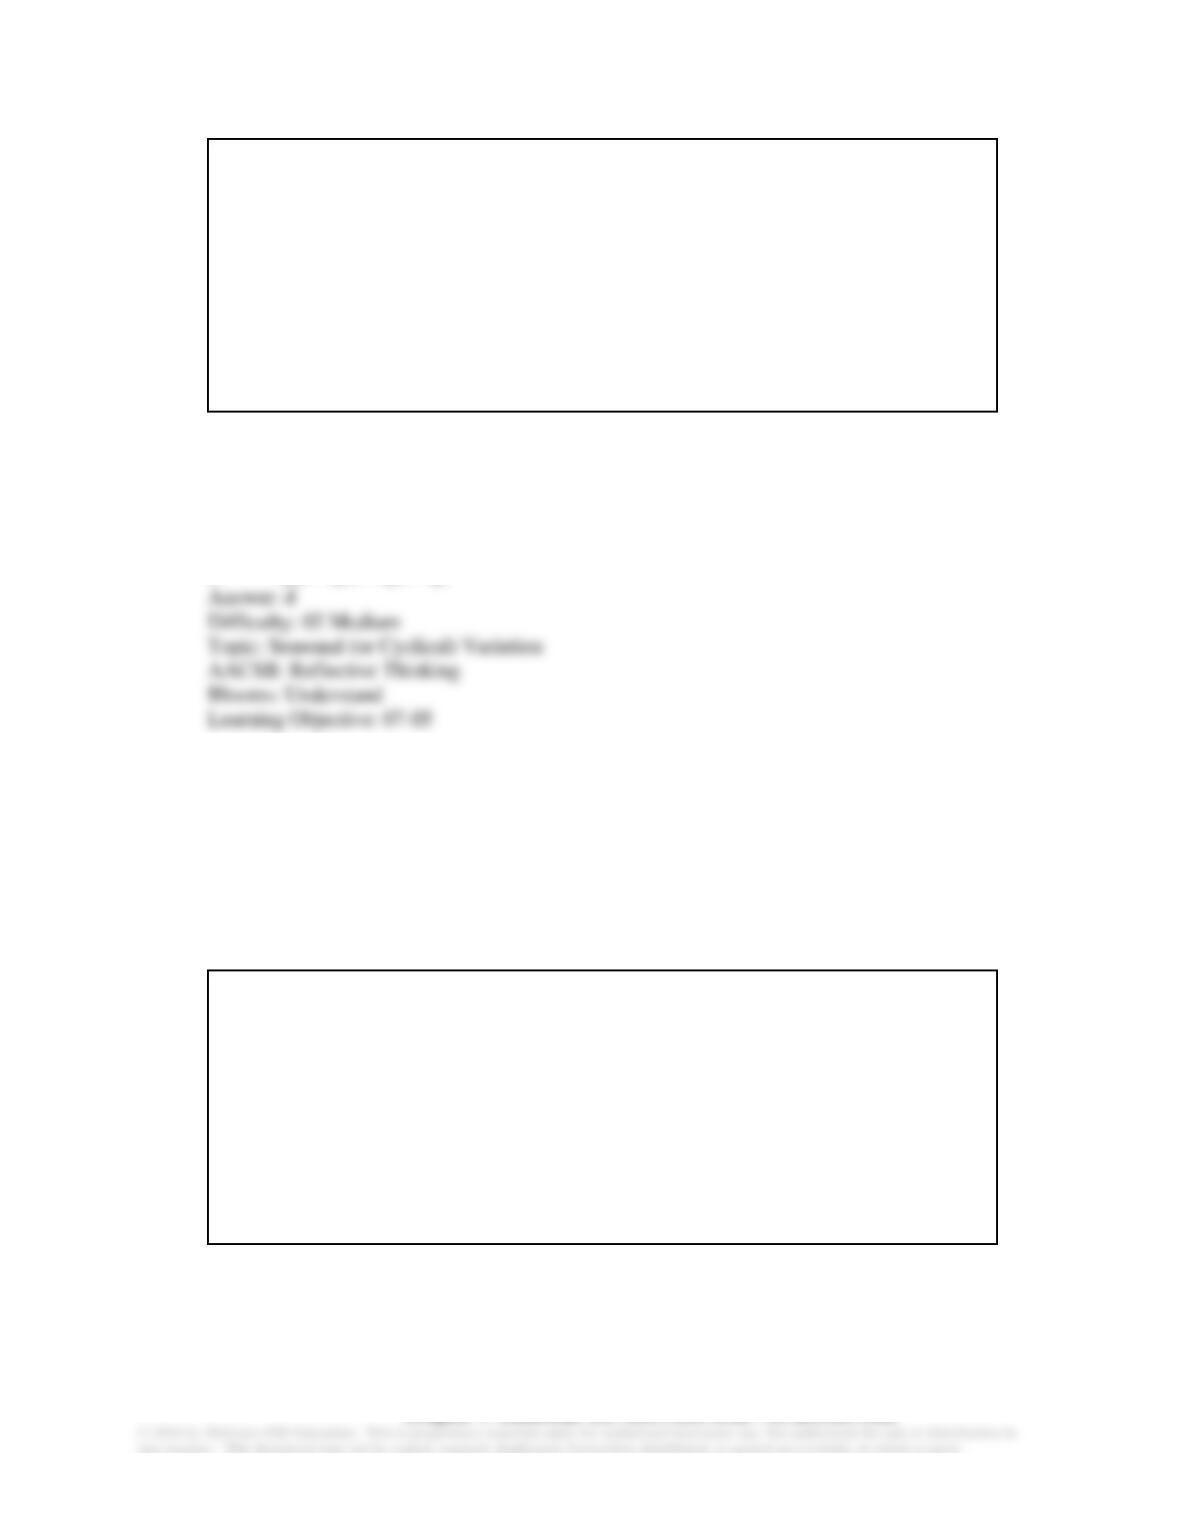
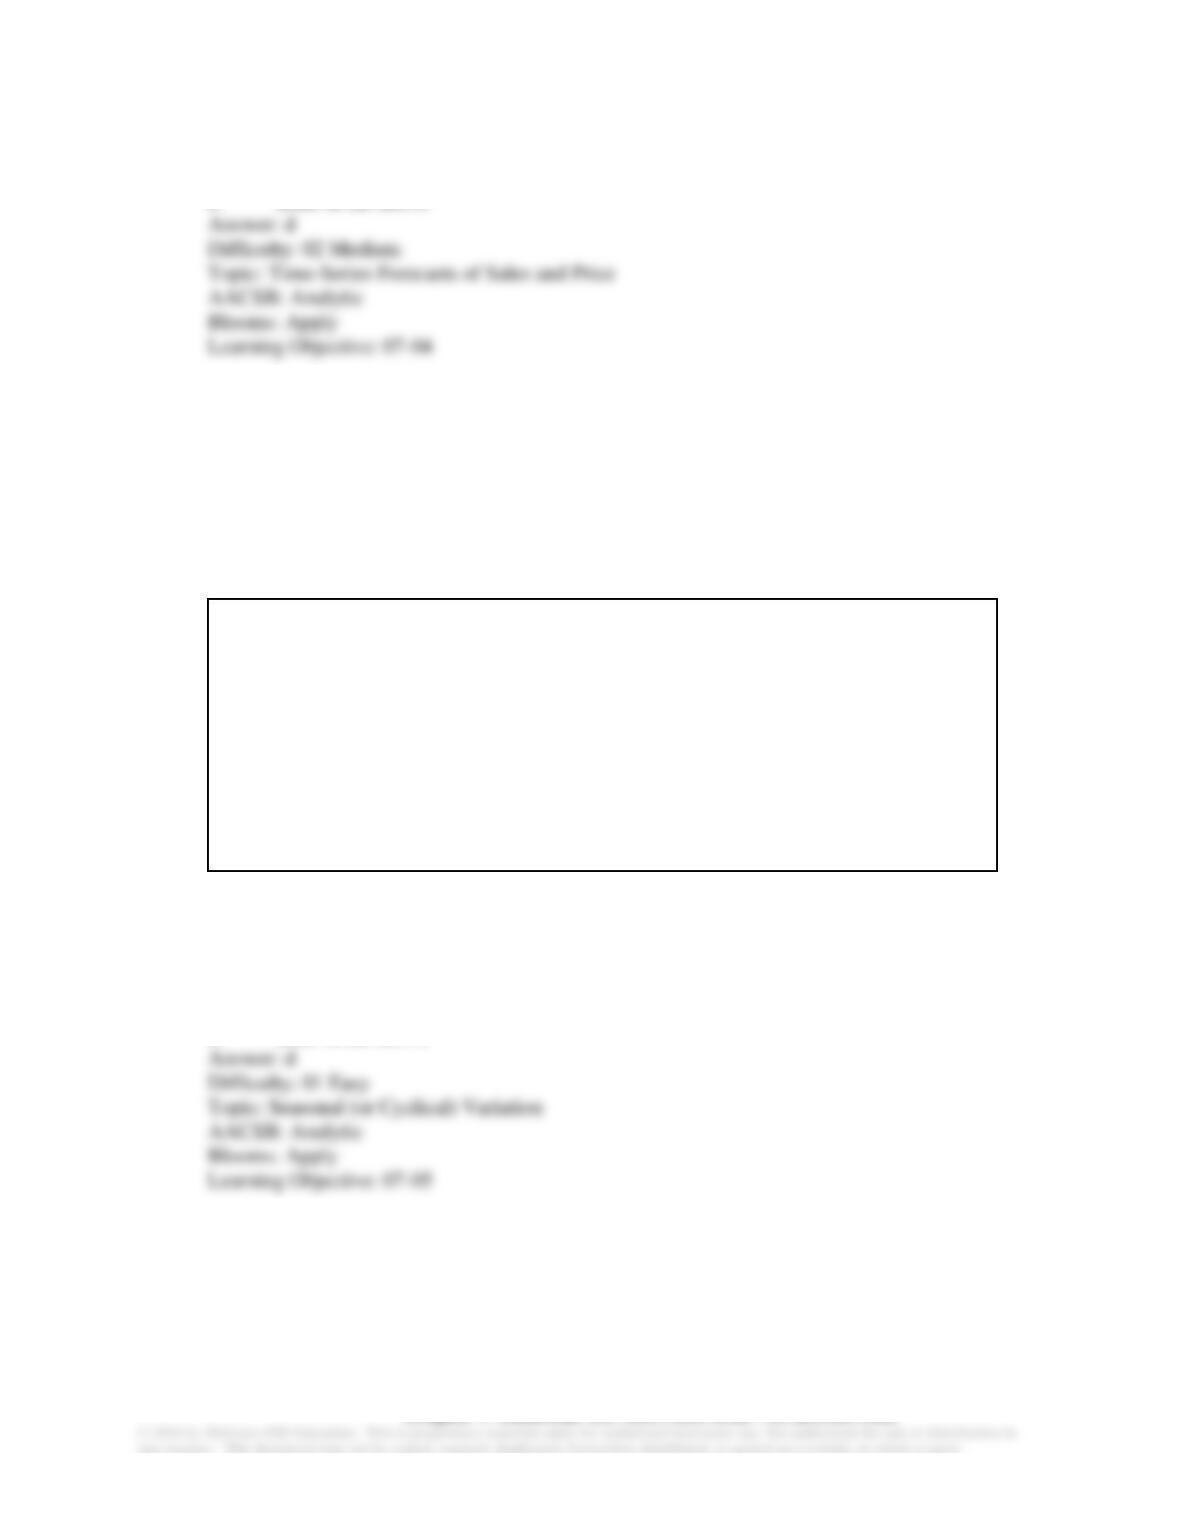
7-49 A forecaster used the regression equation
Qt=a+bt +c1D1+c2D2+c3D3
and quarterly sales data for 1996I–2013IV (t = 1, ..., 64) for an appliance manufacturer to obtain
the results shown below. Q is quarterly sales, and
D1,D2
and
D3
are dummy variables for quarters
I, II, and III.
DEPENDENT VARIABLE:
QT
R−SQUARE
F−RATIO
P−VALUE ON F
OBSERVATIONS:
64
0.8768
107.982
0.0001
VARIABLE
PARAMETER
ESTIMATE
STANDARD
ERROR
T−RATIO
P−VALUE
INTERCEPT
30.0
12.8
2.34
0.0224
T
1.5
0.70
2.14
0.0362
D1
10.0
3.0
3.33
0.0015
D2
25.0
7.2
3.47
0.0010
D3
40.0
15.8
2.53
0.0140
At the 5 percent level of significance, is there a statistically significant trend in sales?
a. No, because 1.5 < 2.66.
b. No, because 1.5 < 2.00.
c. No, because 2.14 < 2.66.
d. Yes, because 2.14 > 2.00.
e. none of the above
7-50 A forecaster used the regression equation
Qt=a+bt +c1D1+c2D2+c3D3
and quarterly sales data for 1996I–2013IV (t = 1, ..., 64) for an appliance manufacturer to obtain
the results shown below. Q is quarterly sales, and
D1,D2
and
D3
are dummy variables for quarters
I, II, and III.

Chapter 7: DEMAND ESTIMATION AND FORECASTING
DEPENDENT VARIABLE:
QT
R−SQUARE
F−RATIO
P−VALUE ON F
OBSERVATIONS:
64
0.8768
107.982
0.0001
VARIABLE
PARAMETER
ESTIMATE
STANDARD
ERROR
T−RATIO
P−VALUE
INTERCEPT
30.0
12.8
2.34
0.0224
T
1.5
0.70
2.14
0.0362
D1
10.0
3.0
3.33
0.0015
D2
25.0
7.2
3.47
0.0010
D3
40.0
15.8
2.53
0.0140
At the 5 percent level of significance, is there a statistically significant trend in sales?
a. Yes, because 0.0362 < 0.05.
b. No, because 0.0362 > 0.01.
c. Yes, because 0.700 > 0.05.
d. Yes, because 2.14 >0.05.
e. both c and d
7-51 A forecaster used the regression equation
Qt=a+bt +c1D1+c2D2+c3D3
and quarterly sales data for 1996I–2013IV (t = 1, ..., 64) for an appliance manufacturer to obtain
the results shown below. Q is quarterly sales, and
D1,D2
and
D3
are dummy variables for quarters
I, II, and III.
DEPENDENT VARIABLE:
QT
R−SQUARE
F−RATIO
P−VALUE ON F
OBSERVATIONS:
64
0.8768
107.982
0.0001
VARIABLE
PARAMETER
ESTIMATE
STANDARD
ERROR
T−RATIO
P−VALUE
INTERCEPT
30.0
12.8
2.34
0.0224
T
1.5
0.70
2.14
0.0362
D1
10.0
3.0
3.33
0.0015
D2
25.0
7.2
3.47
0.0010
D3
40.0
15.8
2.53
0.0140
The estimated QUARTERLY increase in sales is ______ units, and the estimated ANNUAL
increase in sales is ______ units.
a. 1.5; 6
b. 1.4; 4
c. 30; 4
d. 1.5; 40
Chapter 7: DEMAND ESTIMATION AND FORECASTING
e. none of the above
7-52 A forecaster used the regression equation
Qt=a+bt +c1D1+c2D2+c3D3
and quarterly sales data for 1996I–2013IV (t = 1, ..., 64) for an appliance manufacturer to obtain
the results shown below. Q is quarterly sales, and
D1,D2
and
D3
are dummy variables for quarters
I, II, and III.
DEPENDENT VARIABLE:
QT
R−SQUARE
F−RATIO
P−VALUE ON F
OBSERVATIONS:
64
0.8768
107.982
0.0001
VARIABLE
PARAMETER
ESTIMATE
STANDARD
ERROR
T−RATIO
P−VALUE
INTERCEPT
30.0
12.8
2.34
0.0224
T
1.5
0.70
2.14
0.0362
D1
10.0
3.0
3.33
0.0015
D2
25.0
7.2
3.47
0.0010
D3
40.0
15.8
2.53
0.0140
What is the estimated intercept of the trend line in the second quarter?
a. 25
b. 26.6
c. 55
d. 65
e. none of the above
Chapter 7: DEMAND ESTIMATION AND FORECASTING
7-53 A forecaster used the regression equation
Qt=a+bt +c1D1+c2D2+c3D3
and quarterly sales data for 1996I–2013IV (t = 1, ..., 64) for an appliance manufacturer to obtain
the results shown below. Q is quarterly sales, and
D1,D2
and
D3
are dummy variables for quarters
I, II, and III.
DEPENDENT VARIABLE:
QT
R−SQUARE
F−RATIO
P−VALUE ON F
OBSERVATIONS:
64
0.8768
107.982
0.0001
VARIABLE
PARAMETER
ESTIMATE
STANDARD
ERROR
T−RATIO
P−VALUE
INTERCEPT
30.0
12.8
2.34
0.0224
T
1.5
0.70
2.14
0.0362
D1
10.0
3.0
3.33
0.0015
D2
25.0
7.2
3.47
0.0010
D3
40.0
15.8
2.53
0.0140
What is the estimated intercept of the trend line in the fourth quarter?
a. 0
b. 40
c. 55
d. 70
e. none of the above
Chapter 7: DEMAND ESTIMATION AND FORECASTING
7-54 A forecaster used the regression equation
Qt=a+bt +c1D1+c2D2+c3D3
and quarterly sales data for 1996I–2013IV (t = 1, ..., 64) for an appliance manufacturer to obtain
the results shown below. Q is quarterly sales, and
D1,D2
and
D3
are dummy variables for quarters
I, II, and III.
DEPENDENT VARIABLE:
QT
R−SQUARE
F−RATIO
P−VALUE ON F
OBSERVATIONS:
64
0.8768
107.982
0.0001
VARIABLE
PARAMETER
ESTIMATE
STANDARD
ERROR
T−RATIO
P−VALUE
INTERCEPT
30.0
12.8
2.34
0.0224
T
1.5
0.70
2.14
0.0362
D1
10.0
3.0
3.33
0.0015
D2
25.0
7.2
3.47
0.0010
D3
40.0
15.8
2.53
0.0140
Using a 5 percent significance level, these estimation results indicate that sales in
a. the first quarter are greater than sales in any other quarter.
b. the second quarter are greater than sales in any other quarter.
c. the third quarter are greater than sales in any other quarter.
d. the fourth quarter are greater than sales in any other quarter.
7-55 A forecaster used the regression equation
Qt=a+bt +c1D1+c2D2+c3D3
and quarterly sales data for 1996I–2013IV (t = 1, ..., 64) for an appliance manufacturer to obtain
the results shown below. Q is quarterly sales, and
D1,D2
and
D3
are dummy variables for quarters
I, II, and III.
Chapter 7: DEMAND ESTIMATION AND FORECASTING
DEPENDENT VARIABLE:
QT
R−SQUARE
F−RATIO
P−VALUE ON F
OBSERVATIONS:
64
0.8768
107.982
0.0001
VARIABLE
PARAMETER
ESTIMATE
STANDARD
ERROR
T−RATIO
P−VALUE
INTERCEPT
30.0
12.8
2.34
0.0224
T
1.5
0.70
2.14
0.0362
D1
10.0
3.0
3.33
0.0015
D2
25.0
7.2
3.47
0.0010
D3
40.0
15.8
2.53
0.0140
In any given year, quarterly sales tend to vary as follows:
a. QI > QII > QIII > QIV
b. QI > QII > QIV > QIII
c. QII > QIII > QIV > QI
d. QIII > QII > QI > QIV
e. QIII > QIV > QII > QI
7-56 A forecaster used the regression equation
Qt=a+bt +c1D1+c2D2+c3D3
and quarterly sales data for 1996I–2013IV (t = 1, ..., 64) for an appliance manufacturer to obtain
the results shown below. Q is quarterly sales, and
D1,D2
and
D3
are dummy variables for quarters
I, II, and III.
DEPENDENT VARIABLE:
QT
R−SQUARE
F−RATIO
P−VALUE ON F
OBSERVATIONS:
64
0.8768
107.982
0.0001
VARIABLE
PARAMETER
ESTIMATE
STANDARD
ERROR
T−RATIO
P−VALUE
INTERCEPT
30.0
12.8
2.34
0.0224
T
1.5
0.70
2.14
0.0362
D1
10.0
3.0
3.33
0.0015
D2
25.0
7.2
3.47
0.0010
D3
40.0
15.8
2.53
0.0140
Using the estimation results given above, the predicted level of sales in 2014I is _______ units.
a. 137.5
b. 139
c. 133.5
d. 132
Chapter 7: DEMAND ESTIMATION AND FORECASTING
e. none of the above
7-57 A forecaster used the regression equation
Qt=a+bt +c1D1+c2D2+c3D3
and quarterly sales data for 1996I–2013IV (t = 1, ..., 64) for an appliance manufacturer to obtain
the results shown below. Q is quarterly sales, and
D1,D2
and
D3
are dummy variables for quarters
I, II, and III.
DEPENDENT VARIABLE:
QT
R−SQUARE
F−RATIO
P−VALUE ON F
OBSERVATIONS:
64
0.8768
107.982
0.0001
VARIABLE
PARAMETER
ESTIMATE
STANDARD
ERROR
T−RATIO
P−VALUE
INTERCEPT
30.0
12.8
2.34
0.0224
T
1.5
0.70
2.14
0.0362
D1
10.0
3.0
3.33
0.0015
D2
25.0
7.2
3.47
0.0010
D3
40.0
15.8
2.53
0.0140
Using the estimation results given above, the predicted level of sales in 2014II is _______ units.
a. 127.5
b. 137.5
c. 154
d. 155.5
e. none of the above
Chapter 7: DEMAND ESTIMATION AND FORECASTING
7-58 A forecaster used the regression equation
Qt=a+bt +c1D1+c2D2+c3D3
and quarterly sales data for 1996I–2013IV (t = 1, ..., 64) for an appliance manufacturer to obtain
the results shown below. Q is quarterly sales, and
D1,D2
and
D3
are dummy variables for quarters
I, II, and III.
DEPENDENT VARIABLE:
QT
R−SQUARE
F−RATIO
P−VALUE ON F
OBSERVATIONS:
64
0.8768
107.982
0.0001
VARIABLE
PARAMETER
ESTIMATE
STANDARD
ERROR
T−RATIO
P−VALUE
INTERCEPT
30.0
12.8
2.34
0.0224
T
1.5
0.70
2.14
0.0362
D1
10.0
3.0
3.33
0.0015
D2
25.0
7.2
3.47
0.0010
D3
40.0
15.8
2.53
0.0140
Using the estimation results given above, the predicted level of sales in 2014III is _______ units.
a. 141.5
b. 156
c. 172
d. 173.5
e. none of the above

Chapter 7: DEMAND ESTIMATION AND FORECASTING
7-59 A forecaster used the regression equation
Qt=a+bt +c1D1+c2D2+c3D3
and quarterly sales data for 1996I–2013IV (t = 1, ..., 64) for an appliance manufacturer to obtain
the results shown below. Q is quarterly sales, and
D1,D2
and
D3
are dummy variables for quarters
I, II, and III.
DEPENDENT VARIABLE:
QT
R−SQUARE
F−RATIO
P−VALUE ON F
OBSERVATIONS:
64
0.8768
107.982
0.0001
VARIABLE
PARAMETER
ESTIMATE
STANDARD
ERROR
T−RATIO
P−VALUE
INTERCEPT
30.0
12.8
2.34
0.0224
T
1.5
0.70
2.14
0.0362
D1
10.0
3.0
3.33
0.0015
D2
25.0
7.2
3.47
0.0010
D3
40.0
15.8
2.53
0.0140
Using the estimation results given above, the predicted level of sales in 2014IV is _______ units.
a. 125
b. 127.50
c. 132
d. 133.5
e. none of the above
7-60 The manufacturer of Beanie Baby dolls used quarterly price data for 2005I – 2013IV (t = 1, ..., 36)
and the regression equation
P
t=a+bt +c1D1t+c2D2t+c3D3t
to forecast doll prices in the year 2014.
P
t
is the quarterly price of dolls, and
D1t,D2t,
and
D3t
are
dummy variables for quarters I, II, and III, respectively.
Chapter 7: DEMAND ESTIMATION AND FORECASTING
DEPENDENT VARIABLE:
PT
R−SQUARE
F−RATIO
P−VALUE ON F
OBSERVATIONS:
36
0.9078
76.34
0.0001
VARIABLE
PARAMETER
ESTIMATE
STANDARD
ERROR
T−RATIO
P−VALUE
INTERCEPT
24.0
6.20
3.87
0.0005
T
0.800
0.240
3.33
0.0022
D1
−8.0
2.60
−3.08
0.0043
D2
−6.00
1.80
−3.33
0.0022
D3
−4.0
0.60
−6.67
0.0001
At the 2 percent level of statistical significance, is there a statistically significant trend in the price
of dolls?
a. Yes, because 0.0022 < 0.02.
b. No, because 0.0022 > 0.02.
c. Yes, because 0.800 > 0.02.
d. Yes, because 0.240 > 0.02.
e. Yes, because 3.33 > 0.02.
7-61 The manufacturer of Beanie Baby dolls used quarterly price data for 2005I – 2013IV (t = 1, ..., 36)
and the regression equation
P
t=a+bt +c1D1t+c2D2t+c3D3t
to forecast doll prices in the year 2014.
P
t
is the quarterly price of dolls, and
D1t,D2t,
and
D3t
are
dummy variables for quarters I, II, and III, respectively.
DEPENDENT VARIABLE:
PT
R−SQUARE
F−RATIO
P−VALUE ON F
OBSERVATIONS:
36
0.9078
76.34
0.0001
VARIABLE
PARAMETER
ESTIMATE
STANDARD
ERROR
T−RATIO
P−VALUE
INTERCEPT
24.0
6.20
3.87
0.0005
T
0.800
0.240
3.33
0.0022
D1
−8.0
2.60
−3.08
0.0043
D2
−6.00
1.80
−3.33
0.0022
D3
−4.0
0.60
−6.67
0.0001
The estimated QUARTERLY increase in price is ______, and the estimated ANNUAL increase
in price is ______ .
a. $1.50; $6.00
b. $1.40; $4.00
Chapter 7: DEMAND ESTIMATION AND FORECASTING
c. $0.60; $2.40
d. $0.80; $3.20
e. none of the above
7-62 The manufacturer of Beanie Baby dolls used quarterly price data for 2005I – 2013IV (t = 1, ..., 36)
and the regression equation
P
t=a+bt +c1D1t+c2D2t+c3D3t
to forecast doll prices in the year 2014.
P
t
is the quarterly price of dolls, and
D1t,D2t,
and
D3t
are
dummy variables for quarters I, II, and III, respectively.
DEPENDENT VARIABLE:
PT
R−SQUARE
F−RATIO
P−VALUE ON F
OBSERVATIONS:
36
0.9078
76.34
0.0001
VARIABLE
PARAMETER
ESTIMATE
STANDARD
ERROR
T−RATIO
P−VALUE
INTERCEPT
24.0
6.20
3.87
0.0005
T
0.800
0.240
3.33
0.0022
D1
−8.0
2.60
−3.08
0.0043
D2
−6.00
1.80
−3.33
0.0022
D3
−4.0
0.60
−6.67
0.0001
What is the estimated intercept of the trend line in the 1st quarter?
a. 24
b. −8
c. 32
d. 16
e. none of the above
7-63 The manufacturer of Beanie Baby dolls used quarterly price data for 2005I – 2013IV (t = 1, ..., 36)
and the regression equation
P
t=a+bt +c1D1t+c2D2t+c3D3t
Chapter 7: DEMAND ESTIMATION AND FORECASTING
to forecast doll prices in the year 2014.
P
t
is the quarterly price of dolls, and
D1t,D2t,
and
D3t
are
dummy variables for quarters I, II, and III, respectively.
DEPENDENT VARIABLE:
PT
R−SQUARE
F−RATIO
P−VALUE ON F
OBSERVATIONS:
36
0.9078
76.34
0.0001
VARIABLE
PARAMETER
ESTIMATE
STANDARD
ERROR
T−RATIO
P−VALUE
INTERCEPT
24.0
6.20
3.87
0.0005
T
0.800
0.240
3.33
0.0022
D1
−8.0
2.60
−3.08
0.0043
D2
−6.00
1.80
−3.33
0.0022
D3
−4.0
0.60
−6.67
0.0001
What is the estimated intercept of the trend line in the 4th quarter?
a. 22.8
b. 16
c. 18
d. 20
e. none of the above
7-64 The manufacturer of Beanie Baby dolls used quarterly price data for 2005I – 2013IV (t = 1, ..., 36)
and the regression equation
P
t=a+bt +c1D1t+c2D2t+c3D3t
to forecast doll prices in the year 2014.
P
t
is the quarterly price of dolls, and
D1t,D2t,
and
D3t
are
dummy variables for quarters I, II, and III, respectively.
DEPENDENT VARIABLE:
PT
R−SQUARE
F−RATIO
P−VALUE ON F
OBSERVATIONS:
36
0.9078
76.34
0.0001
VARIABLE
PARAMETER
ESTIMATE
STANDARD
ERROR
T−RATIO
P−VALUE
INTERCEPT
24.0
6.20
3.87
0.0005
T
0.800
0.240
3.33
0.0022
D1
−8.0
2.60
−3.08
0.0043
D2
−6.00
1.80
−3.33
0.0022
D3
−4.0
0.60
−6.67
0.0001
Chapter 7: DEMAND ESTIMATION AND FORECASTING
At the 2 percent level of statistical significance, the estimation results indicate that price in the
________ quarter is significantly higher than in any other quarter.
a. 1st
b. 2nd
c. 3rd
d. 4th
7-65 The manufacturer of Beanie Baby dolls used quarterly price data for 2005I – 2013IV (t = 1, ..., 36)
and the regression equation
P
t=a+bt +c1D1t+c2D2t+c3D3t
to forecast doll prices in the year 2014.
P
t
is the quarterly price of dolls, and
D1t,D2t,
and
D3t
are
dummy variables for quarters I, II, and III, respectively.
DEPENDENT VARIABLE:
PT
R−SQUARE
F−RATIO
P−VALUE ON F
OBSERVATIONS:
36
0.9078
76.34
0.0001
VARIABLE
PARAMETER
ESTIMATE
STANDARD
ERROR
T−RATIO
P−VALUE
INTERCEPT
24.0
6.20
3.87
0.0005
T
0.800
0.240
3.33
0.0022
D1
−8.0
2.60
−3.08
0.0043
D2
−6.00
1.80
−3.33
0.0022
D3
−4.0
0.60
−6.67
0.0001
At the 2 percent level of statistical significance, the results indicate that price in the ________
quarter is significantly lower than in any other quarter.
a. 1st
b. 2nd
c. 3rd
d. 4th
7-66 The manufacturer of Beanie Baby dolls used quarterly price data for 2005I – 2013IV (t = 1, ..., 36)
and the regression equation
P
t=a+bt +c1D1t+c2D2t+c3D3t
Chapter 7: DEMAND ESTIMATION AND FORECASTING
to forecast doll prices in the year 2014.
P
t
is the quarterly price of dolls, and
D1t,D2t,
and
D3t
are
dummy variables for quarters I, II, and III, respectively.
DEPENDENT VARIABLE:
PT
R−SQUARE
F−RATIO
P−VALUE ON F
OBSERVATIONS:
36
0.9078
76.34
0.0001
VARIABLE
PARAMETER
ESTIMATE
STANDARD
ERROR
T−RATIO
P−VALUE
INTERCEPT
24.0
6.20
3.87
0.0005
T
0.800
0.240
3.33
0.0022
D1
−8.0
2.60
−3.08
0.0043
D2
−6.00
1.80
−3.33
0.0022
D3
−4.0
0.60
−6.67
0.0001
In any given year price tends to vary from quarter to quarter as follows:
a. PI > PII > PIII > PIV
b. PI > PIV > PIII > PII
c. PII > PIII > PIV > PI
d. PIII > PI > PII > PIV
e. PIV > PIII > PII > PI
7-67 The manufacturer of Beanie Baby dolls used quarterly price data for 2005I – 2013IV (t = 1, ..., 36)
and the regression equation
P
t=a+bt +c1D1t+c2D2t+c3D3t
to forecast doll prices in the year 2014.
P
t
is the quarterly price of dolls, and
D1t,D2t,
and
D3t
are
dummy variables for quarters I, II, and III, respectively.
Chapter 7: DEMAND ESTIMATION AND FORECASTING
DEPENDENT VARIABLE:
PT
R−SQUARE
F−RATIO
P−VALUE ON F
OBSERVATIONS:
36
0.9078
76.34
0.0001
VARIABLE
PARAMETER
ESTIMATE
STANDARD
ERROR
T−RATIO
P−VALUE
INTERCEPT
24.0
6.20
3.87
0.0005
T
0.800
0.240
3.33
0.0022
D1
−8.0
2.60
−3.08
0.0043
D2
−6.00
1.80
−3.33
0.0022
D3
−4.0
0.60
−6.67
0.0001
Using the estimated time-series regression, predicted price in the 1st quarter of 2014 is
a. $53.60.
b. $45.60.
c. $56.00.
d. $37.60.
e. none of the above
7-68 The manufacturer of Beanie Baby dolls used quarterly price data for 2005I – 2013IV (t = 1, ..., 36)
and the regression equation
P
t=a+bt +c1D1t+c2D2t+c3D3t
to forecast doll prices in the year 2014.
P
t
is the quarterly price of dolls, and
D1t,D2t,
and
D3t
are
dummy variables for quarters I, II, and III, respectively.
DEPENDENT VARIABLE:
PT
R−SQUARE
F−RATIO
P−VALUE ON F
OBSERVATIONS:
36
0.9078
76.34
0.0001
VARIABLE
PARAMETER
ESTIMATE
STANDARD
ERROR
T−RATIO
P−VALUE
INTERCEPT
24.0
6.20
3.87
0.0005
T
0.800
0.240
3.33
0.0022
D1
−8.0
2.60
−3.08
0.0043
D2
−6.00
1.80
−3.33
0.0022
D3
−4.0
0.60
−6.67
0.0001
Using the estimated time-series regression, predicted price in the 2nd quarter of 2014 is
a. $48.40
b. $54.40
c. $40.40

Chapter 7: DEMAND ESTIMATION AND FORECASTING
d. $51.40
e. none of the above