Subjective Short Answer
1. What do economists call the highest amount a consumer will pay to purchase a good?
2. If John’s willingness to pay for a good is $20 and the price of the good is $15, how much is John’s consumer surplus
from purchasing the good?
Table 7-17
The following table shows the willingness to pay for a good for the only four consumers in a market.
Consumer
Willingness to Pay
A
$25
B
$40
C
$15
D
$30
3. Refer to Table 7-17. If the price of the good is $20, how many units will be demanded?
4. Refer to Table 7-17. If the price of the good is $20, how much is the total consumer surplus?
Scenario 7-1
Suppose market demand is given by the equation
5. Refer to Scenario 7-1. If the market equilibrium price is $10, how much is total consumer surplus in this market?
6. Refer to Scenario 7-1. If the market equilibrium price rises from $10 to $15, what is the change in total consumer
surplus in the market?
7. Refer to Scenario 7-1. If the market equilibrium price falls from $10 to $5, what is the change in total consumer
surplus in the market?
8. Refer to Scenario 7-1. If the market equilibrium price falls from $10 to $5, how much additional consumer surplus do
consumers initially in the market at the $10 price receive?
9. Refer to Scenario 7-1. If the market equilibrium price falls from $10 to $5, how much consumer surplus do consumers
entering the market after the price drop receive?
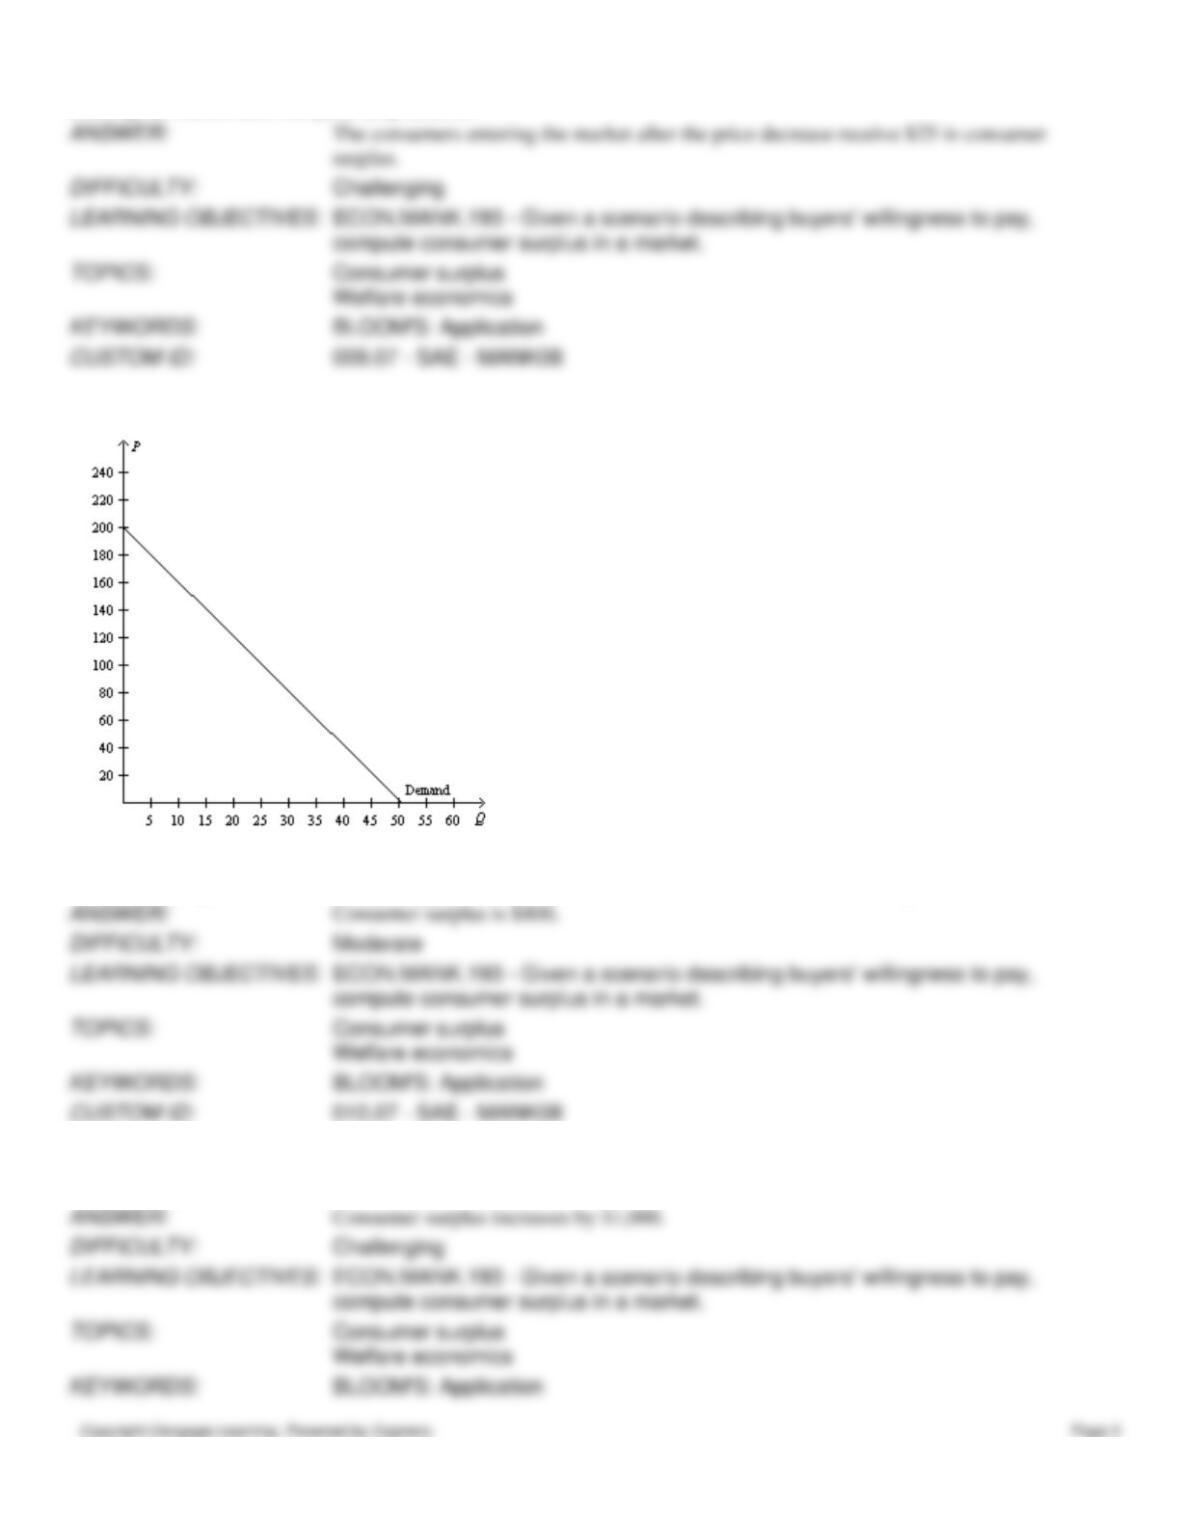
Figure 7-30
10. Refer to Figure 7-30. If the market equilibrium price is $120, how much is total consumer surplus?
11. Refer to Figure 7-30. If the market equilibrium price falls from $120 to $80, how much is the change in total
consumer surplus in the market?
12. Refer to Figure 7-30. If the market equilibrium price falls from $120 to $80, how much is the increase in consumer
surplus to the consumers who were initially in the market at the $120 price?
13. Refer to Figure 7-30. If the market equilibrium price falls from $120 to $80, how much consumer surplus do
consumers entering the market after the price drop receive?
14. Suppose John’s cost for performing some carpentry work is $120. If John is paid $200 for the carpentry work, what is
his producer surplus?
Table 7-18
The following table shows the cost of producing a good for the only four producers in a market.
Producer
Cost
W
$40
X
$30
Y
$20
Z
$10
15. Refer to Table 7-18. If the market price is $28, which producers will supply units in the market?
16. Refer to Table 7-18. If the market equilibrium price is $28, what is total producer surplus in the market?
17. Refer to Table 7-18. If these four producers bid in an auction to supply one unit to a consumer, at what price will the
good be sold?
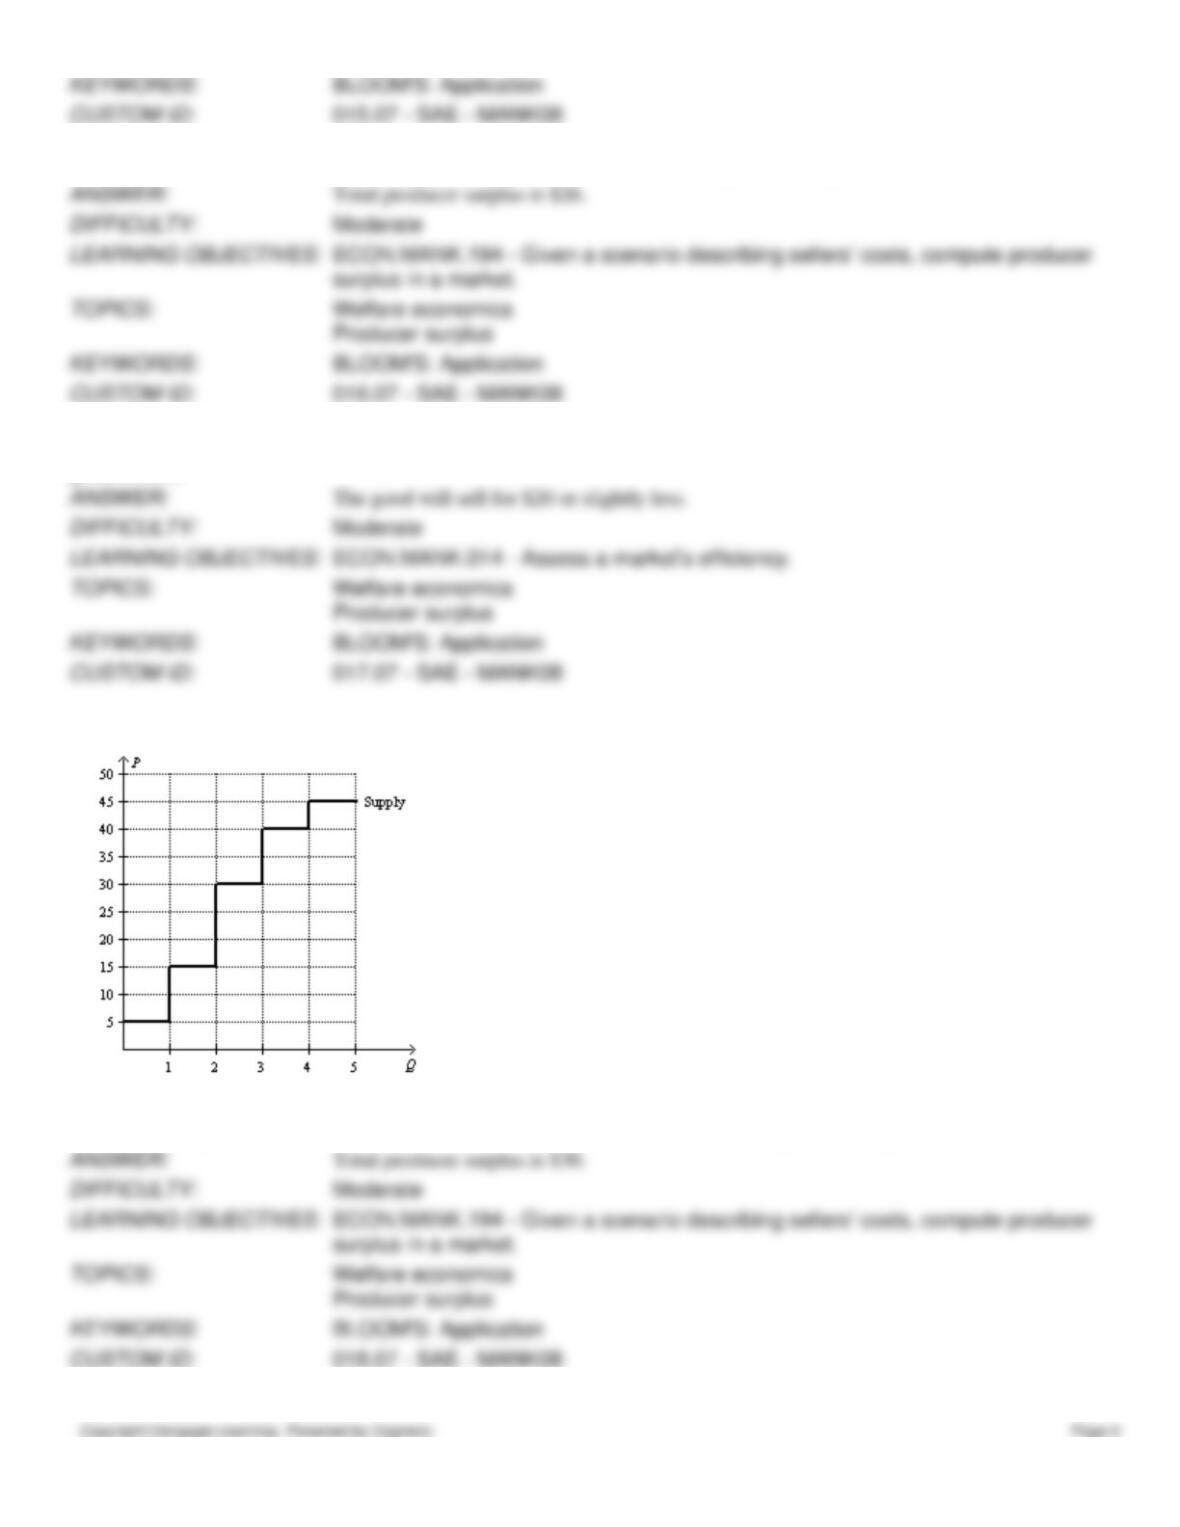
Figure 7-31
18. Refer to Figure 7-31. If the market equilibrium price is $25, how much is total producer surplus in this market?
19. Refer to Figure 7-31. If the market equilibrium price is $35, how much is total producer surplus in this market?
20. Refer to Figure 7-31. If the market equilibrium price rises from $25 to $35, how much is the increase in producer
surplus to the producers supplying units at the initial $25 price?
21. Refer to Figure 7-31. If the market equilibrium price rises from $25 to $35, how much is the producer surplus for the
producers entering the market after the price increase?
Table 7-19
Buyer
Willingness to
Pay ($)
Seller
Cost ($)
A
15
W
10
B
30
X
20
C
45
Y
30
D
60
Z
40
22. Refer to Table 7-19. How much is total consumer surplus at the equilibrium price in this market?
23. Refer to Table 7-19. How much is total producer surplus at the equilibrium price in this market?
24. Refer to Table 7-19. How much is total surplus at the equilibrium price in this market?
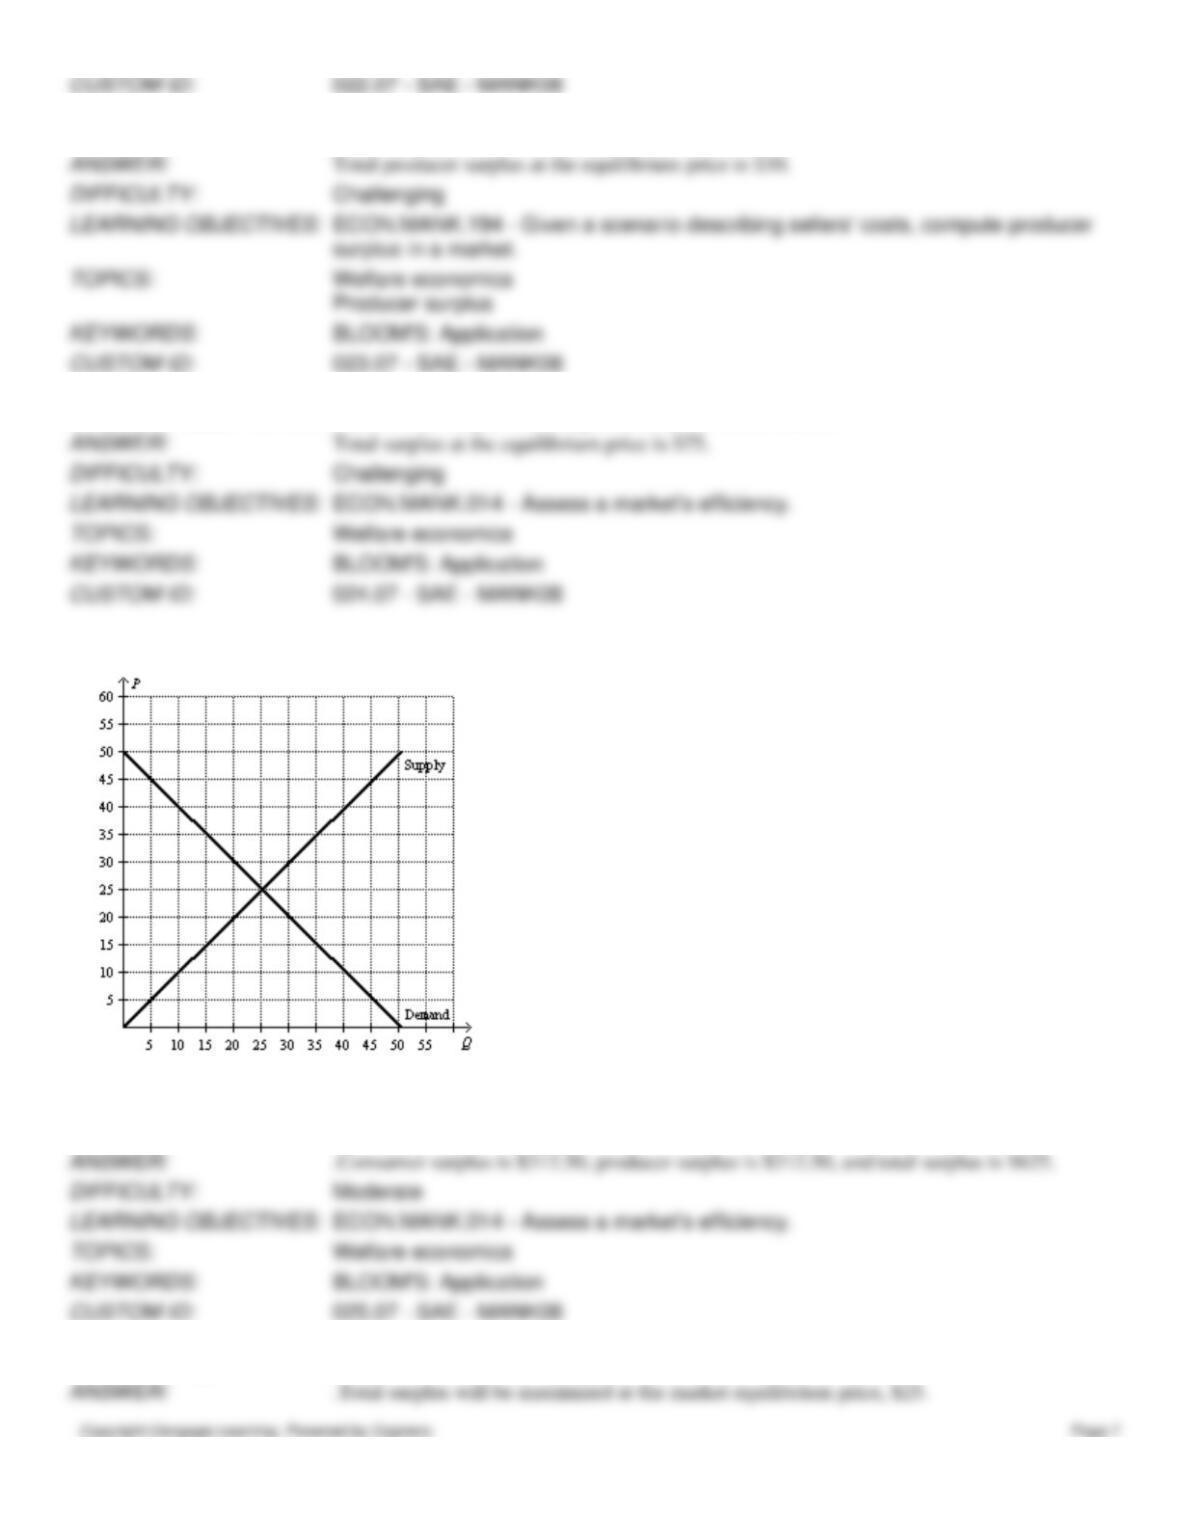
Figure 7-32
25. Refer to Figure 7-32. How much are consumer surplus, producer surplus, and total surplus at the market equilibrium
price?
26. Refer to Figure 7-32. At what price will total surplus be maximized in this market?
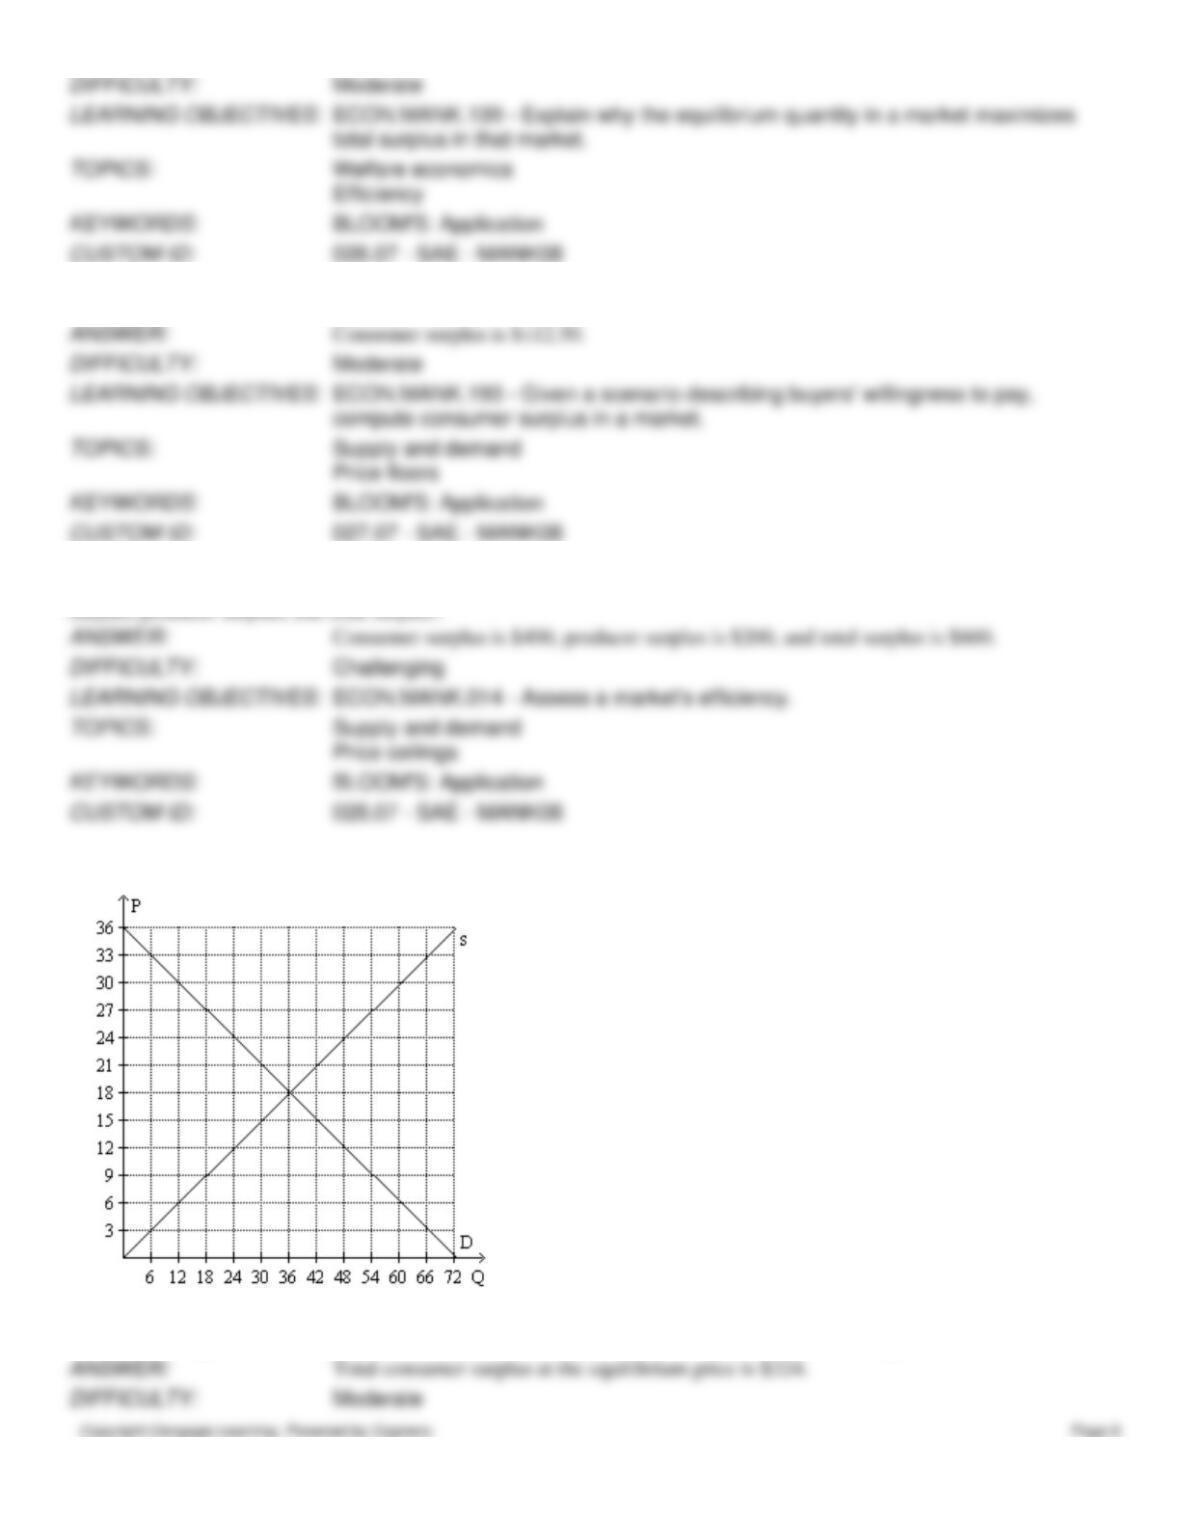
27. Refer to Figure 7-32. If the government imposed a price floor at $35 in this market, how much is consumer surplus?
28. Refer to Figure 7-32. If the government imposed a price ceiling at $20 in this market, how much are consumer
Figure 7-33
29. Refer to Figure 7-33. How much is total consumer surplus in this market at the equilibrium price?
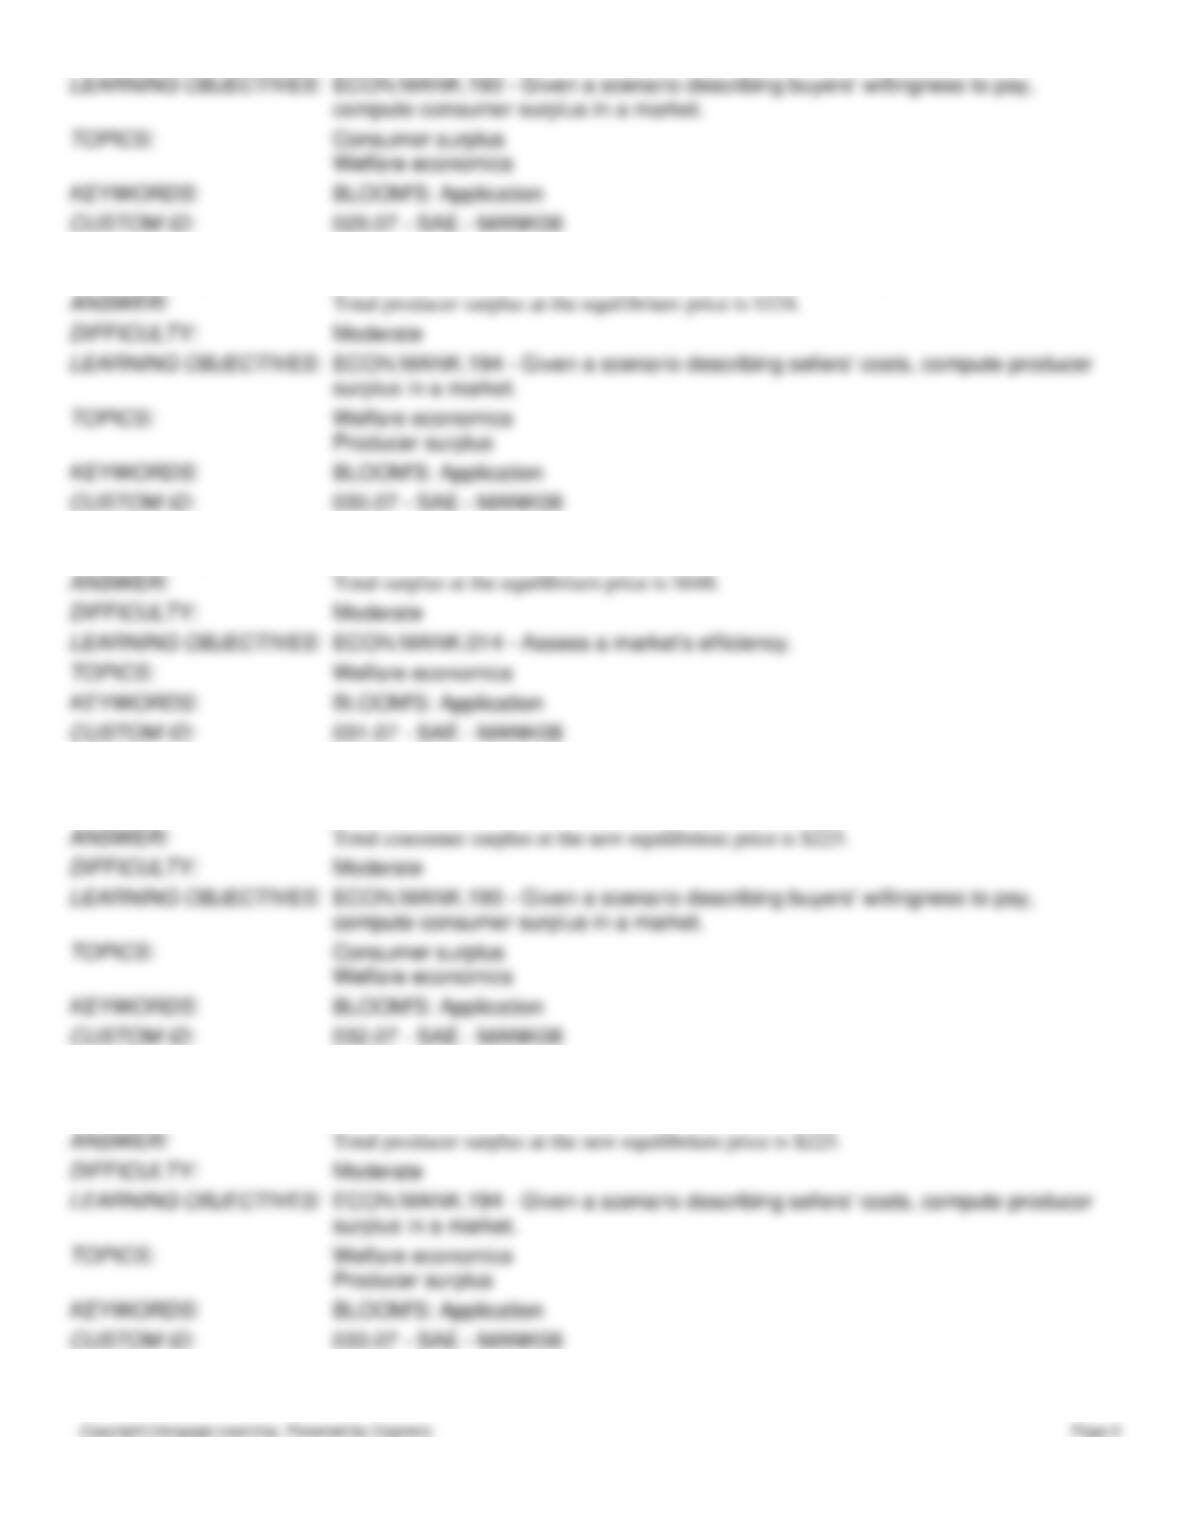
30. Refer to Figure 7-33. How much is total producer surplus in this market at the equilibrium price?
31. Refer to Figure 7-33. How much is total surplus in this market at the equilibrium price?
32. Refer to Figure 7-33. Suppose demand shifts such that consumers wish to purchase 12 fewer units at every price.
How much is total consumer surplus in this market at the new equilibrium price?
33. Refer to Figure 7-33. Suppose demand shifts such that consumers wish to purchase 12 fewer units at every price.
How much is total producer surplus in this market at the new equilibrium price?
34. Refer to Figure 7-33. Suppose demand shifts such that consumers wish to purchase 12 fewer units at every price.
How much is total surplus in this market at the new equilibrium price?
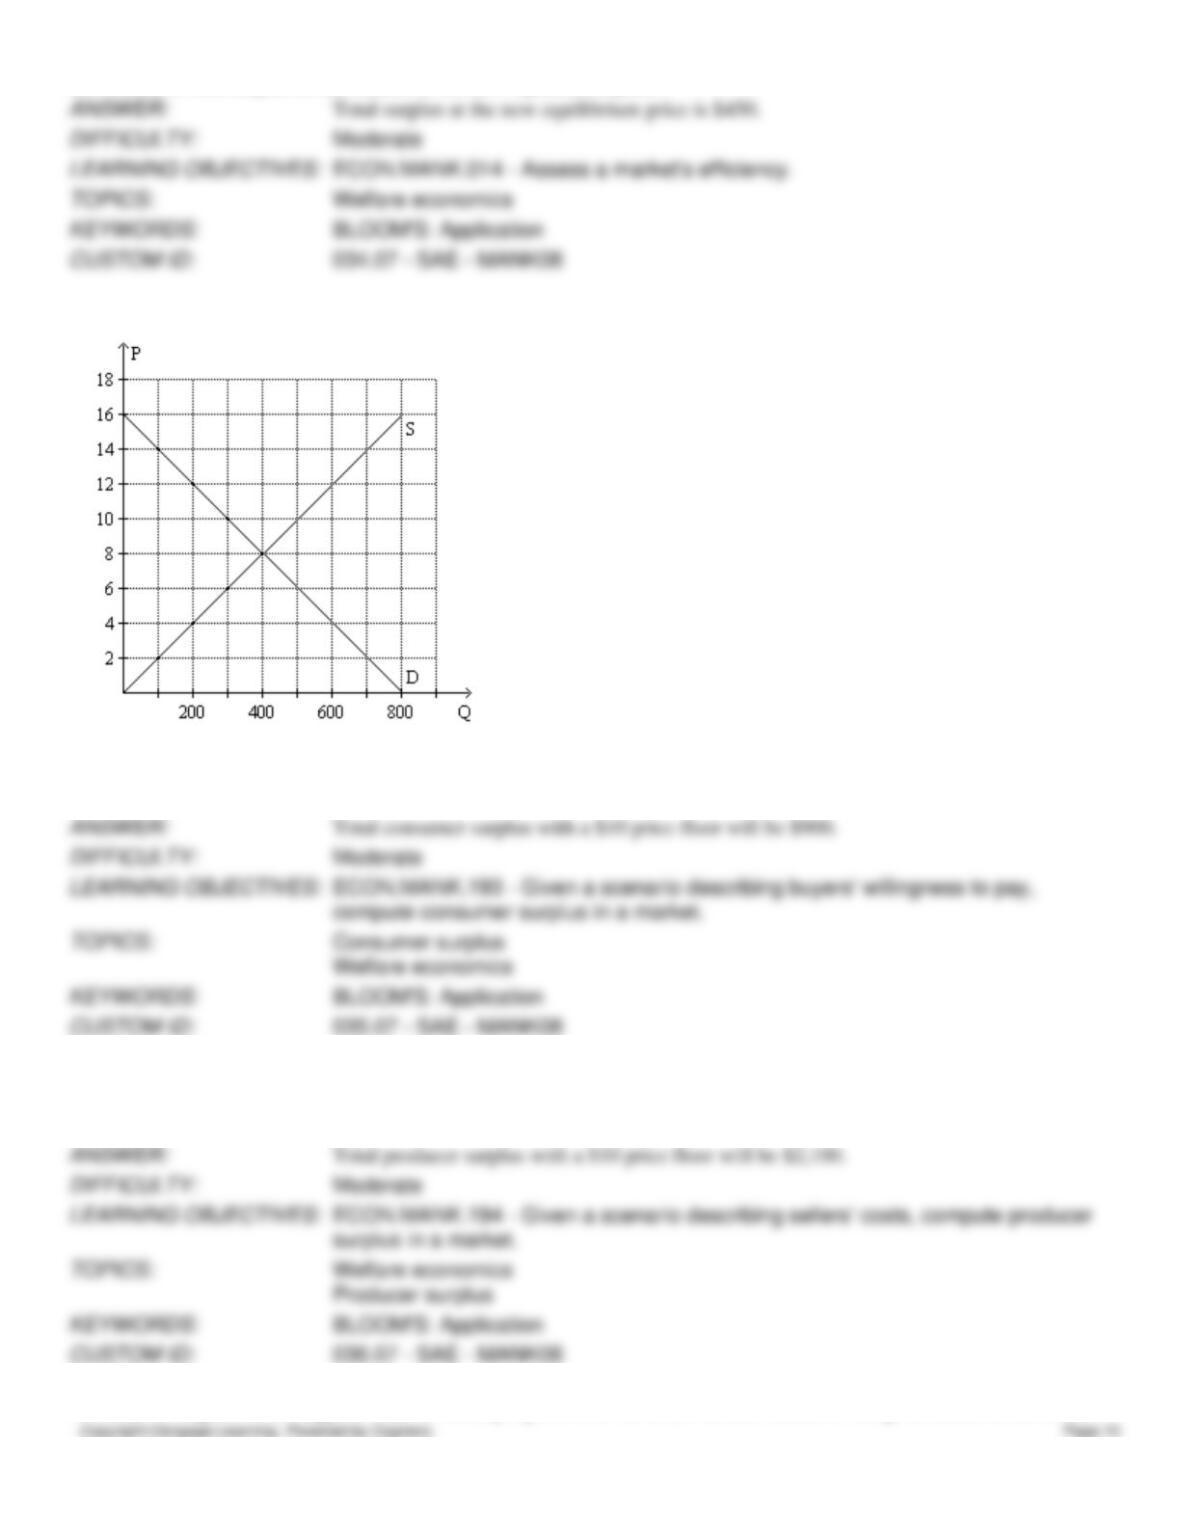
Figure 7-34
35. Refer to Figure 7-34. Suppose the government imposes a price floor at $10 per unit in this market. With the price
floor, how much is total consumer surplus?
36. Refer to Figure 7-34. Suppose the government imposes a price floor at $10 per unit in this market. With the price
floor, how much is total producer surplus assuming those producers with the lowest cost are the ones who supply the
market?
37. Refer to Figure 7-34. Suppose there is initially a price floor set at $10 in this market. If the government removed the
price floor, by how much would total consumer surplus increase?
38. Refer to Figure 7-34. Suppose there is initially a price floor set at $10 in this market. If the government removed the
price floor, by how much would total consumer surplus increase for those consumers who were purchasing the good when
the price floor was in place?
39. Refer to Figure 7-34. Suppose there is initially a price floor set at $10 in this market. If the government removed the
price floor, by how much would total consumer surplus increase for those consumers who enter the market after the price
floor is removed?
40. Refer to Figure 7-34. Suppose there is initially a price floor set at $10 in this market. If the government removed the
price floor, by how much would total producer surplus change, assuming the producers with the lowest cost were the ones
supplying the market when the price floor was in place?
41. Refer to Figure 7-34. Suppose there is initially a price ceiling set at $4 in this market. How much is total producer
surplus with the price ceiling in place?
42. Refer to Figure 7-34. Suppose there is initially a price ceiling set at $4 in this market. If the government removed the
price ceiling, by how much would total producer surplus change?
43. Refer to Figure 7-34. Suppose there is initially a price ceiling set at $4 in this market. If the government removed the
price ceiling, by how much would total producer surplus increase for those producers entering the market after the price
Scenario 7-2
Suppose market demand and market supply are given by the equations:
44. Refer to Scenario 7-2. How much is total consumer surplus at the equilibrium price in this market?
45. Refer to Scenario 7-2. How much is total producer surplus at the equilibrium price in this market?
46. Refer to Scenario 7-2. How much is total surplus at the equilibrium price in this market?
47. Refer to Scenario 7-2. Suppose a reduction in input prices shifts the market supply curve to
By how much does total consumer surplus increase as a result of this supply shift?
48. Refer to Scenario 7-2. Suppose a reduction in input prices shifts the market supply curve to
By how much does total consumer surplus increase for those consumers who were already willing to purchase the good
with the original supply curve?
49. Refer to Scenario 7-2. Suppose a reduction in input prices shifts the market supply curve to
How much total consumer surplus goes to new consumers who enter the market after the supply curve shifts?
Total consumer surplus increases by $2 for those consumers who enter the market after the
supply curve shifts.
50. Refer to Scenario 7-2. Suppose a reduction in input prices shifts the market supply curve to
By how much does total producer surplus increase as a result of this supply shift?
Total producer surplus prior to the shift is $162, and total producer surplus after the shift is
$200. Therefore, total producer surplus increases by $38 as a result of the supply shift.
51. Answer each of the following questions about demand and consumer surplus.
a.
What is consumer surplus, and how is it measured?
b.
What is the relationship between the demand curve and the willingness to pay?
c.
Other things equal, what happens to consumer surplus if the price of a good falls? Why?
Illustrate using a demand curve.
d.
In what way does the demand curve represent the benefit consumers receive from
participating in a market? In addition to the demand curve, what else must be considered
to determine consumer surplus?
For the market, total consumer surplus is the area under the demand curve and above
the price, from the origin to the quantity purchased.
b.
Because the demand curve shows the maximum amount buyers are willing to pay for a
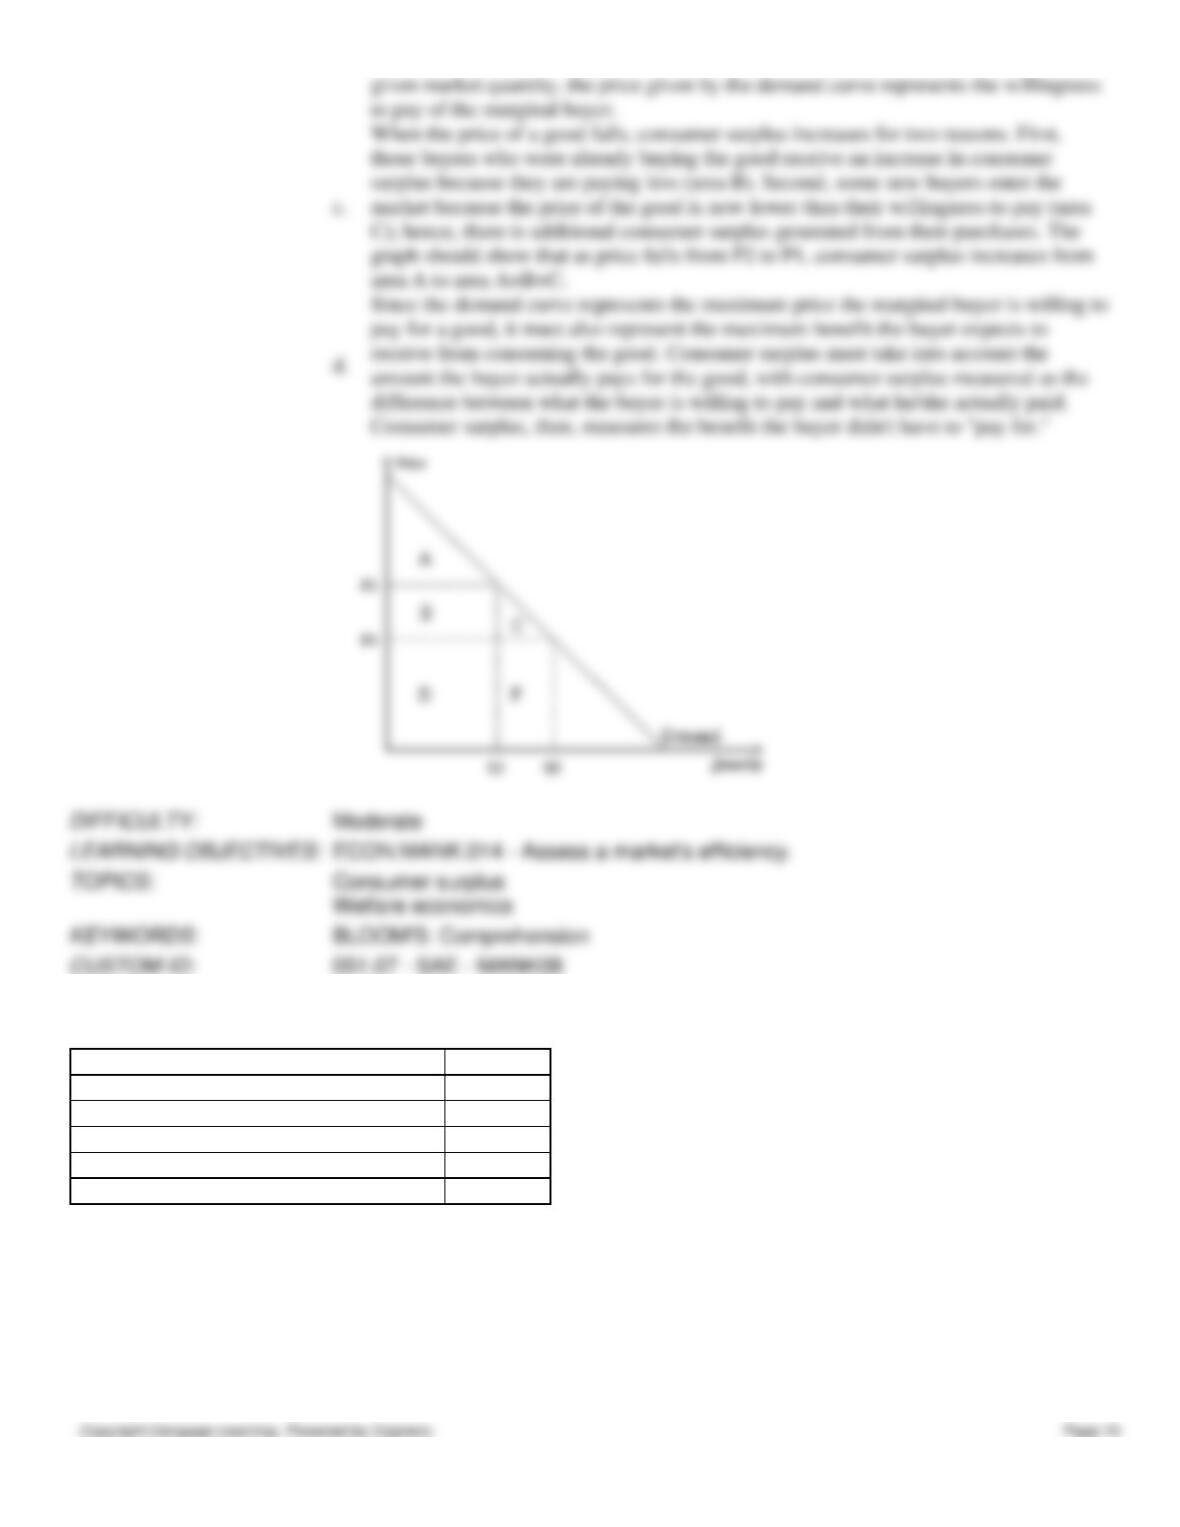
area A to area A+B+C.
Consumer surplus, then, measures the benefit the buyer didn’t have to “pay for.”
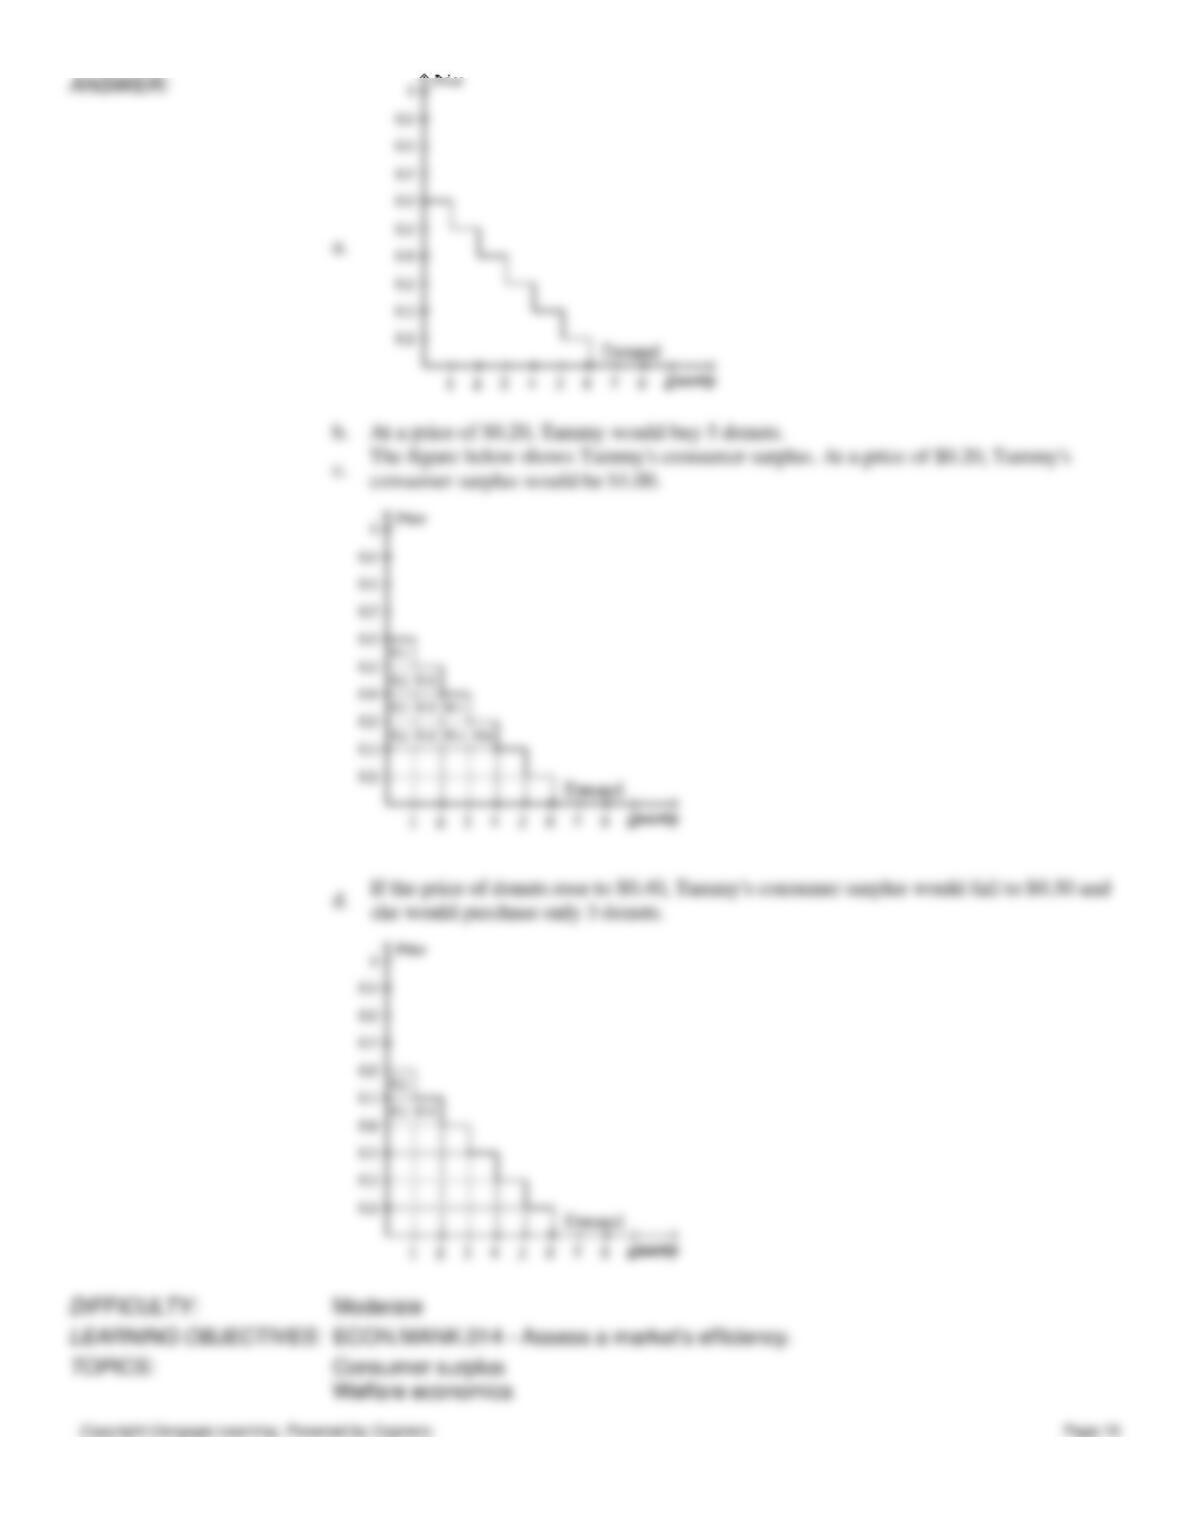
52. Tammy loves donuts. The table shown reflects the value Tammy places on each donut she eats:
Value of first donut
$0.60
Value of second donut
$0.50
Value of third donut
$0.40
Value of fourth donut
$0.30
Value of fifth donut
$0.20
Value of sixth donut
$0.10
a.
Use this information to construct Tammy’s demand curve for donuts.
b.
If the price of donuts is $0.20, how many donuts will Tammy buy?
c.
Show Tammy’s consumer surplus on your graph. How much consumer surplus would
she have at a price of $0.20?
d.
If the price of donuts rose to $0.40, how many donuts would she purchase now? What
would happen to Tammy’s consumer surplus? Show this change on your graph.
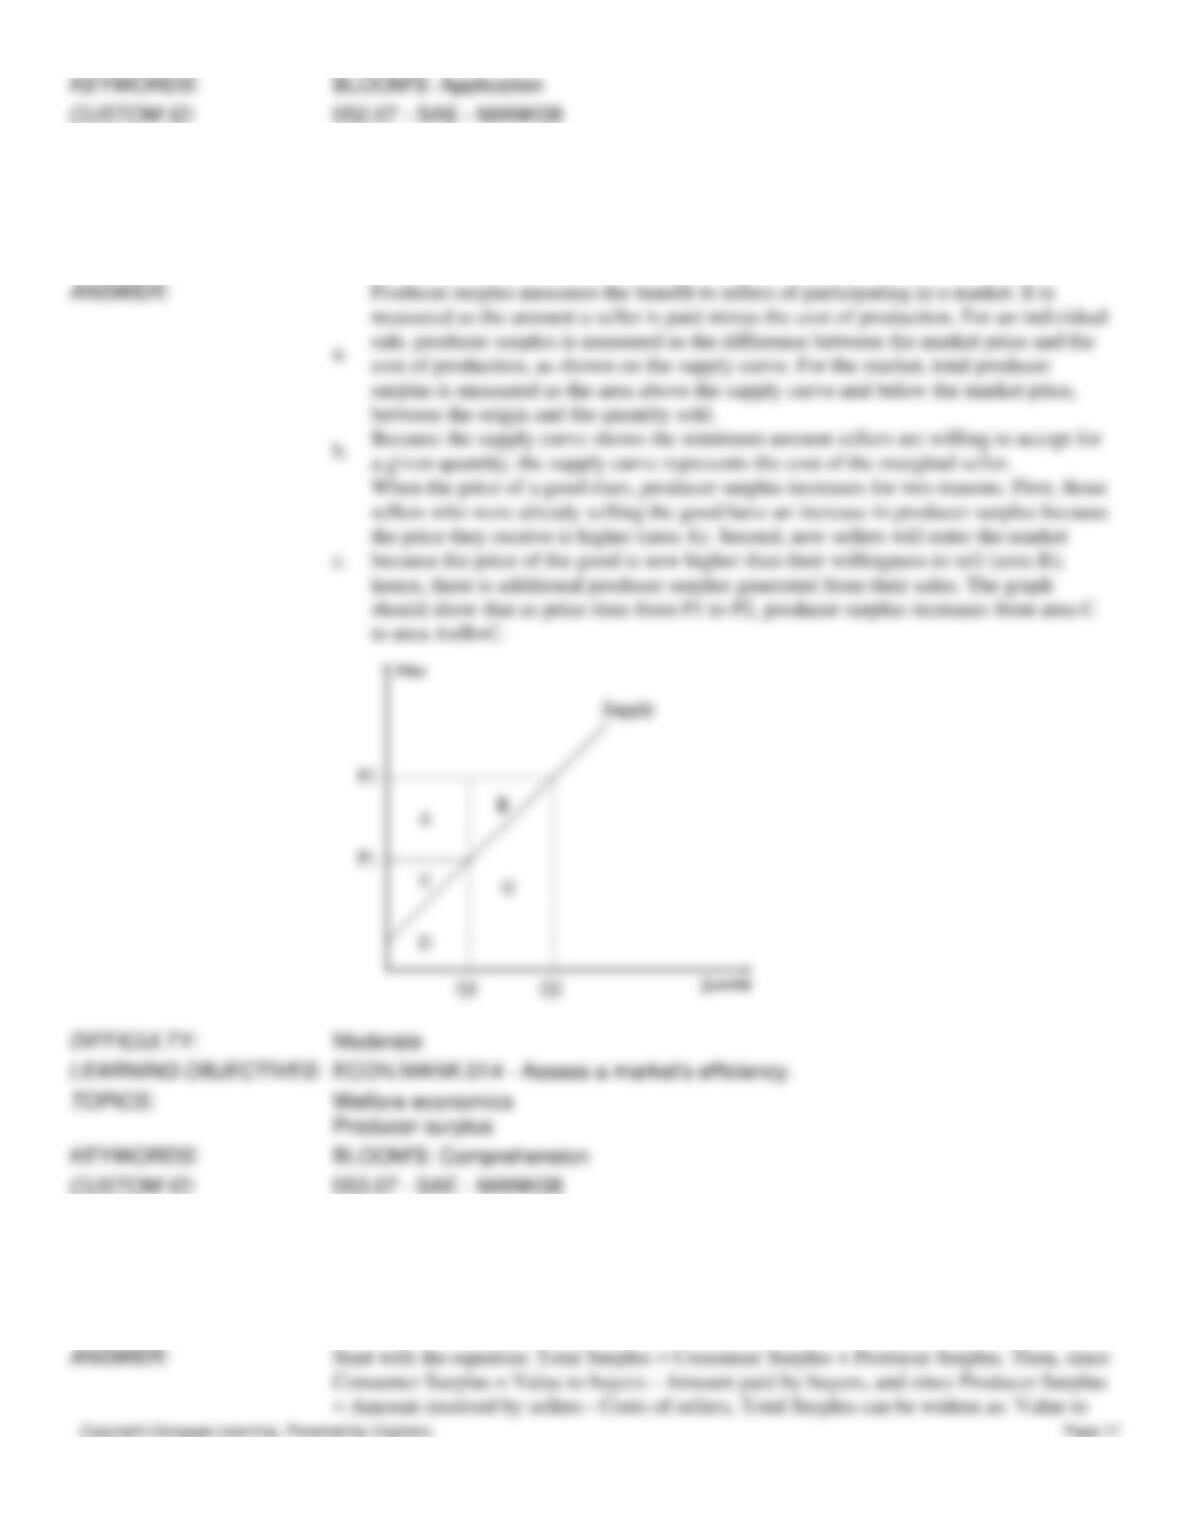
53. Answer each of the following questions about supply and producer surplus.
a.
What is producer surplus, and how is it measured?
b.
What is the relationship between the cost to sellers and the supply curve?
c.
Other things equal, what happens to producer surplus when the price of a good rises?
Illustrate your answer on a supply curve.
between the origin and the quantity sold.
a given quantity, the supply curve represents the cost of the marginal seller.
54. Given the following two equations:
1)
Total Surplus = Consumer Surplus + Producer Surplus
2)
Total Surplus = Value to Buyers – Cost to Sellers
Show how equation (1) can be used to derive equation (2).
= Amount received by sellers – Costs of sellers, Total Surplus can be written as: Value to
cancel out and the result is:
Total Surplus = Value to buyers – Costs of sellers.
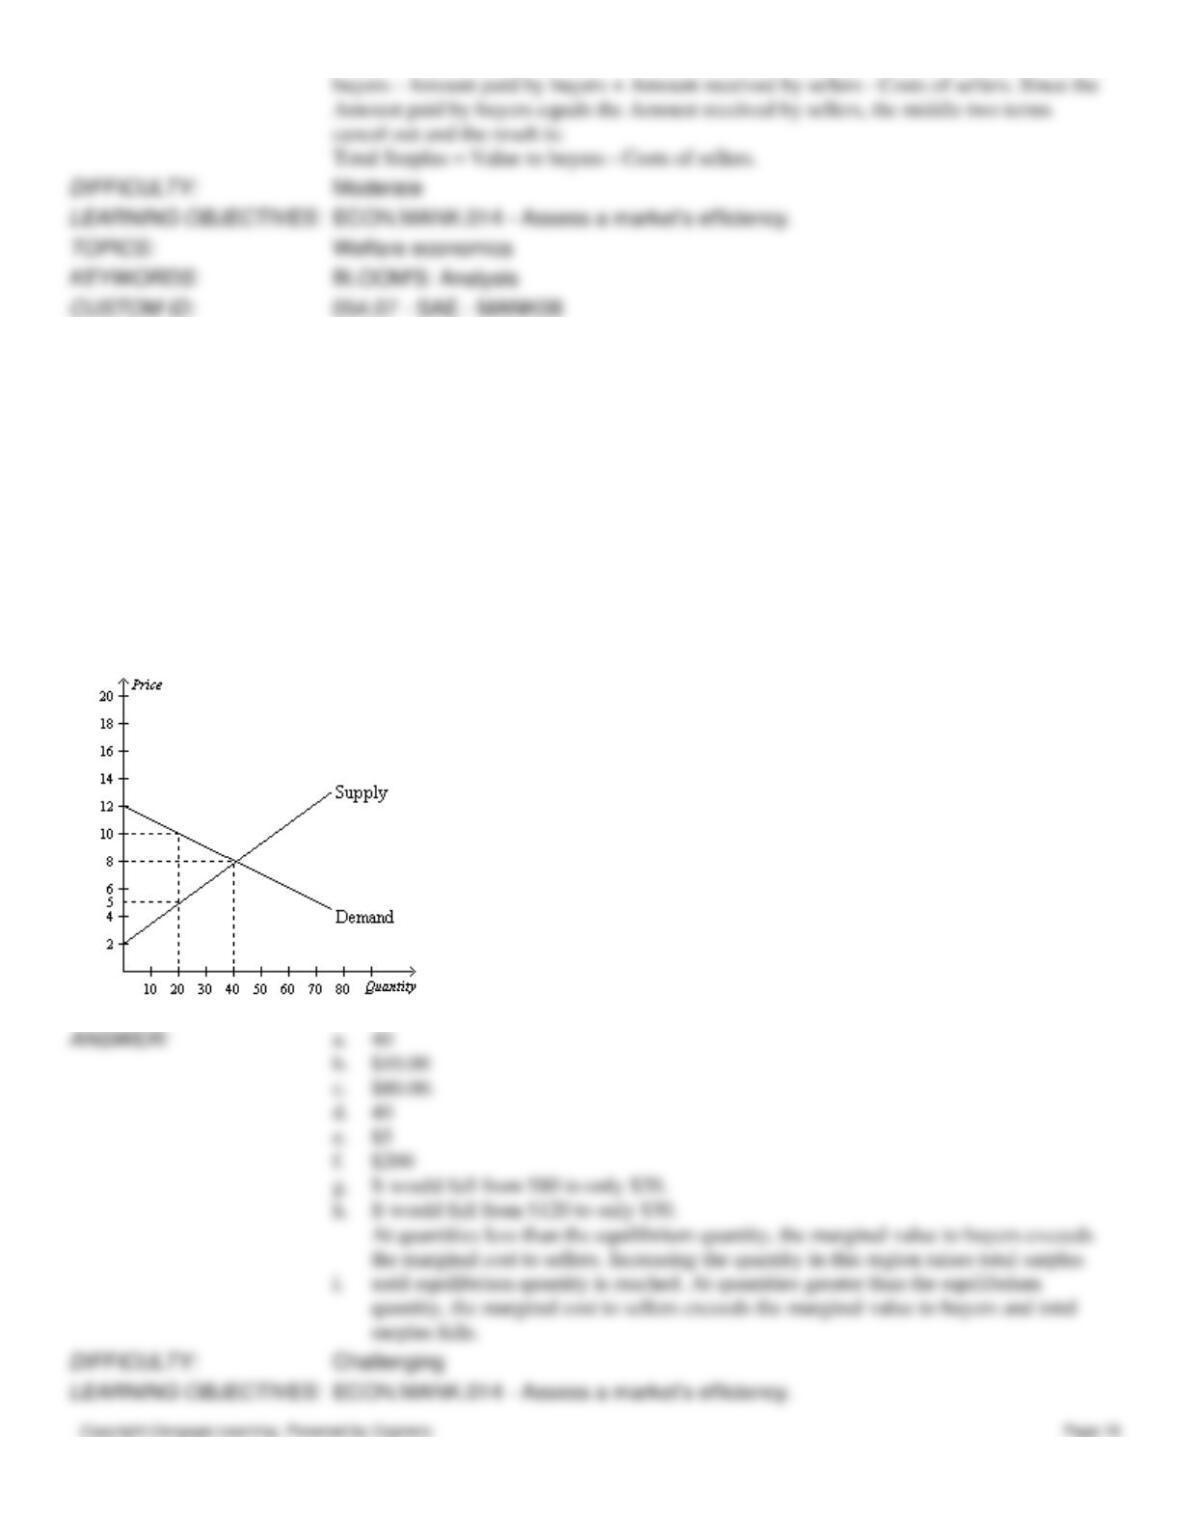
55. Answer the following questions based on the graph that represents J.R.’s demand for ribs per week at Judy’s Rib
Shack.
a.
At the equilibrium price, how many ribs would J.R. be willing to purchase?
b.
How much is J.R. willing to pay for 20 ribs?
c.
What is the magnitude of J.R.’s consumer surplus at the equilibrium price?
d.
At the equilibrium price, how many ribs would Judy be willing to sell?
e.
How high must the price of ribs be for Judy to supply 20 ribs to the market?
f.
At the equilibrium price, what is the magnitude of total surplus in the market?
g.
If the price of ribs rose to $10, what would happen to J.R.’s consumer surplus?
h.
If the price of ribs fell to $5, what would happen to Judy’s producer surplus?
i.
Explain why the graph that is shown verifies the fact that the market equilibrium
(quantity) maximizes the sum of producer and consumer surplus.
a.
40
b.
c.
d.
40
e.
$5
f.
$200
g.
It would fall from $80 to only $20.
h.
It would fall from $120 to only $30.
quantity, the marginal cost to sellers exceeds the marginal value to buyers and total
surplus falls.