49) If the real interest rate increases from 3 percent to 5 percent
A) the nominal interest rate will also increase.
B) the demand for loanable funds curve will shift rightward.
C) there will be a movement up along the demand for loanable funds curve.
D) the supply of loanable funds curve will shift rightward.
50) A rise in the real interest rate
A) shifts the demand for loanable funds curve rightward.
B) shifts the demand for loanable funds curve leftward.
C) creates a movement upward along the demand for loanable funds curve.
D) creates a movement downward along the demand for loanable funds curve.
51) A decrease in the real interest rate leads to
A) an increase in investment demand so that the demand for loanable funds curve shifts
rightward.
B) a fall in the capital stock.
C) an increase in the expected profit.
D) a movement downward along the demand for loanable funds curve.
52) When the real interest rate rises
A) there is a downward movement along the demand for loanable funds curve.
B) there is an upward movement along the demand for loanable funds curve.
C) the demand for loanable funds curve shifts rightward.
D) the demand for loanable funds curve shifts leftward.
53) A movement downward along the demand for loanable funds curve occurs when
A) the expected profit from investment increases.
B) business expectations become more optimistic.
C) the real interest rate falls.
D) the supply of loanable funds decreases.
54) A rise in the real interest rate
A) decreases the demand for loanable funds.
B) increases the demand for loanable funds.
C) decreases the quantity of loanable funds demanded.
D) increases the quantity of loanable funds demanded.
55) A decrease in the real interest rate leads to a ________ the demand for loanable funds curve,
and a decrease in the expected profit leads to a ________ the demand for loanable funds curve.
A) rightward shift in; leftward shift in
B) movement down along; movement up along
C) rightward shift in; movement up along
D) movement down along; leftward shift in
56) A decrease in the demand for loanable funds and a leftward shift of the demand for loanable
funds curve results from
A) an increase in the real interest rate.
B) technological improvements.
C) tax cuts.
D) decreases in the expected profit.
23
57) Greater optimism about the expected profits from investment projects
A) shifts the demand for loanable funds curve rightward.
B) shifts the demand for loanable funds curve leftward.
C) causes a movement upward along the demand for loanable funds curve.
D) causes a movement downward along the demand for loanable funds curve.
58) Due to the recession in 2008, firms decreased their profit expectations. As a result, there was
a ________ shift in the ________ loanable funds curve.
A) rightward; supply of
B) leftward; demand for
C) rightward; demand for
D) rightward, supply of
59) Which of the following shifts the demand for loanable funds curve leftward?
A) a fall in the real interest rate
B) a rise in the real interest rate
C) a decrease in the taxes paid by the business
D) a decrease in the expected profit
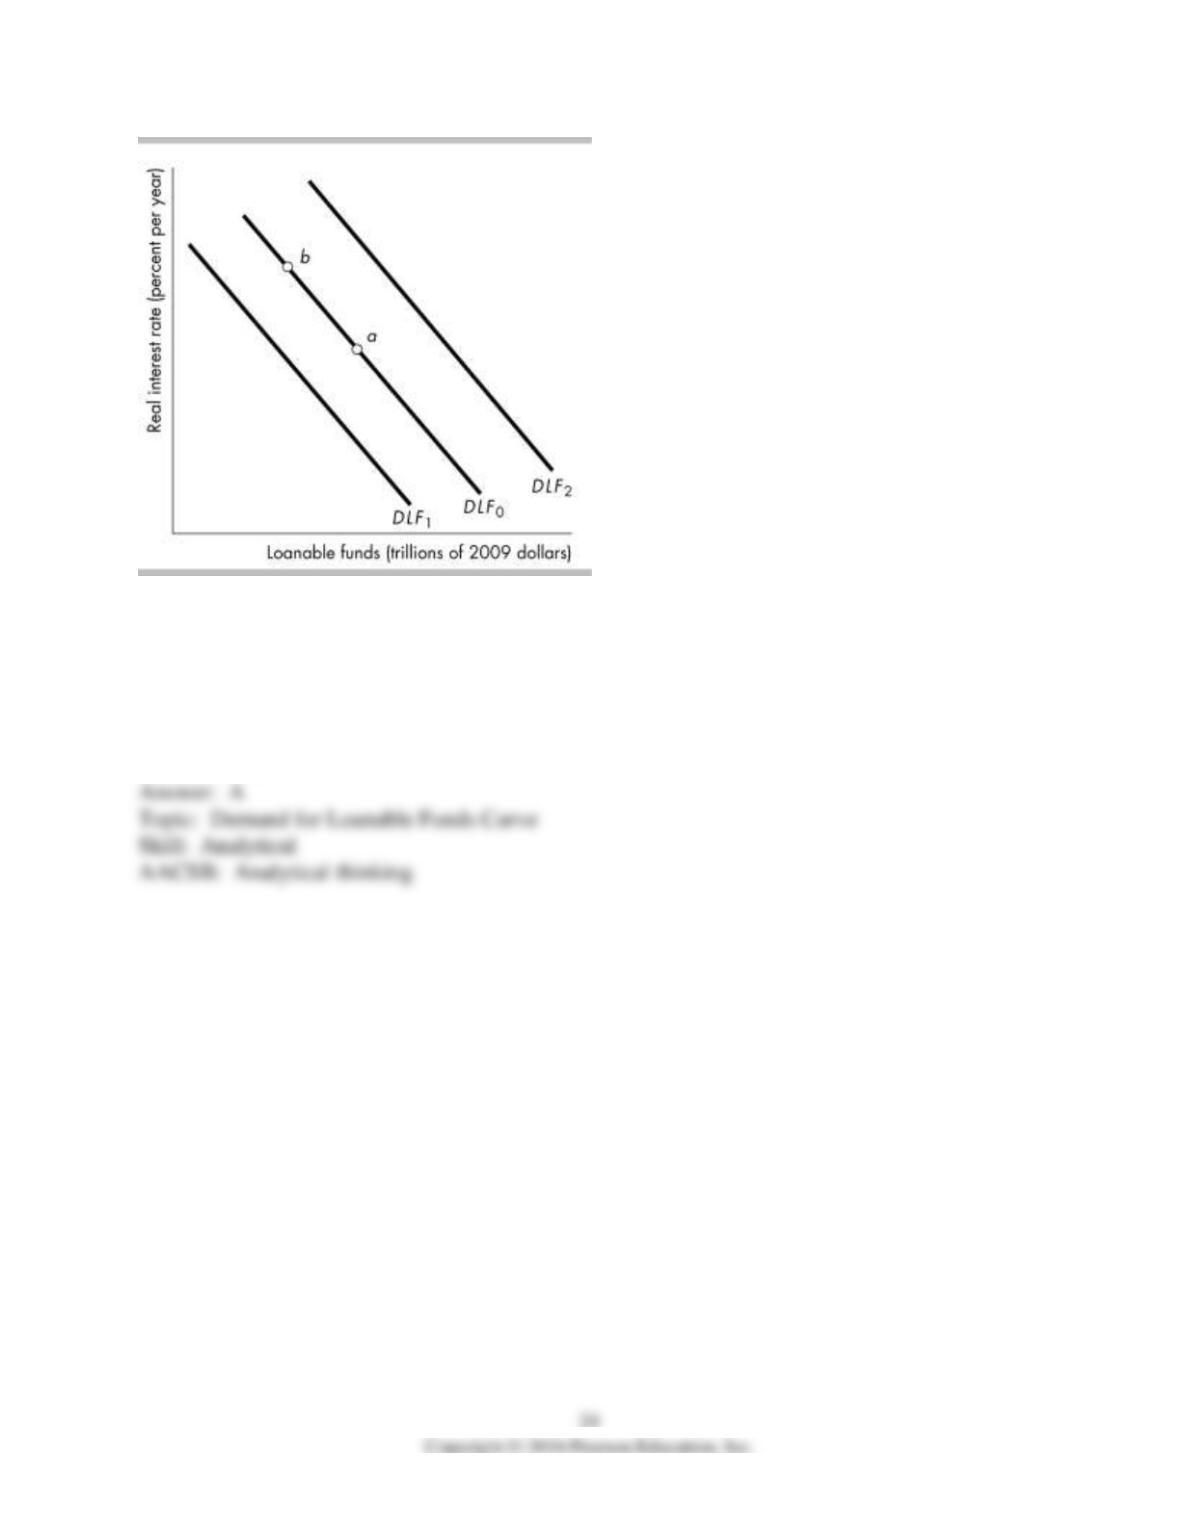
60) In the above figure, the economy is at point a on the initial demand for loanable funds curve
DLF0. What happens if the real interest rate rises?
A) There is a movement to a point such as b on the demand for loanable funds curve DLF0.
B) The demand for loanable funds curve shifts rightward to a curve such as DLF2.
C) The demand for loanable funds curve shifts leftward to a curve such as DLF1.
D) none of the above
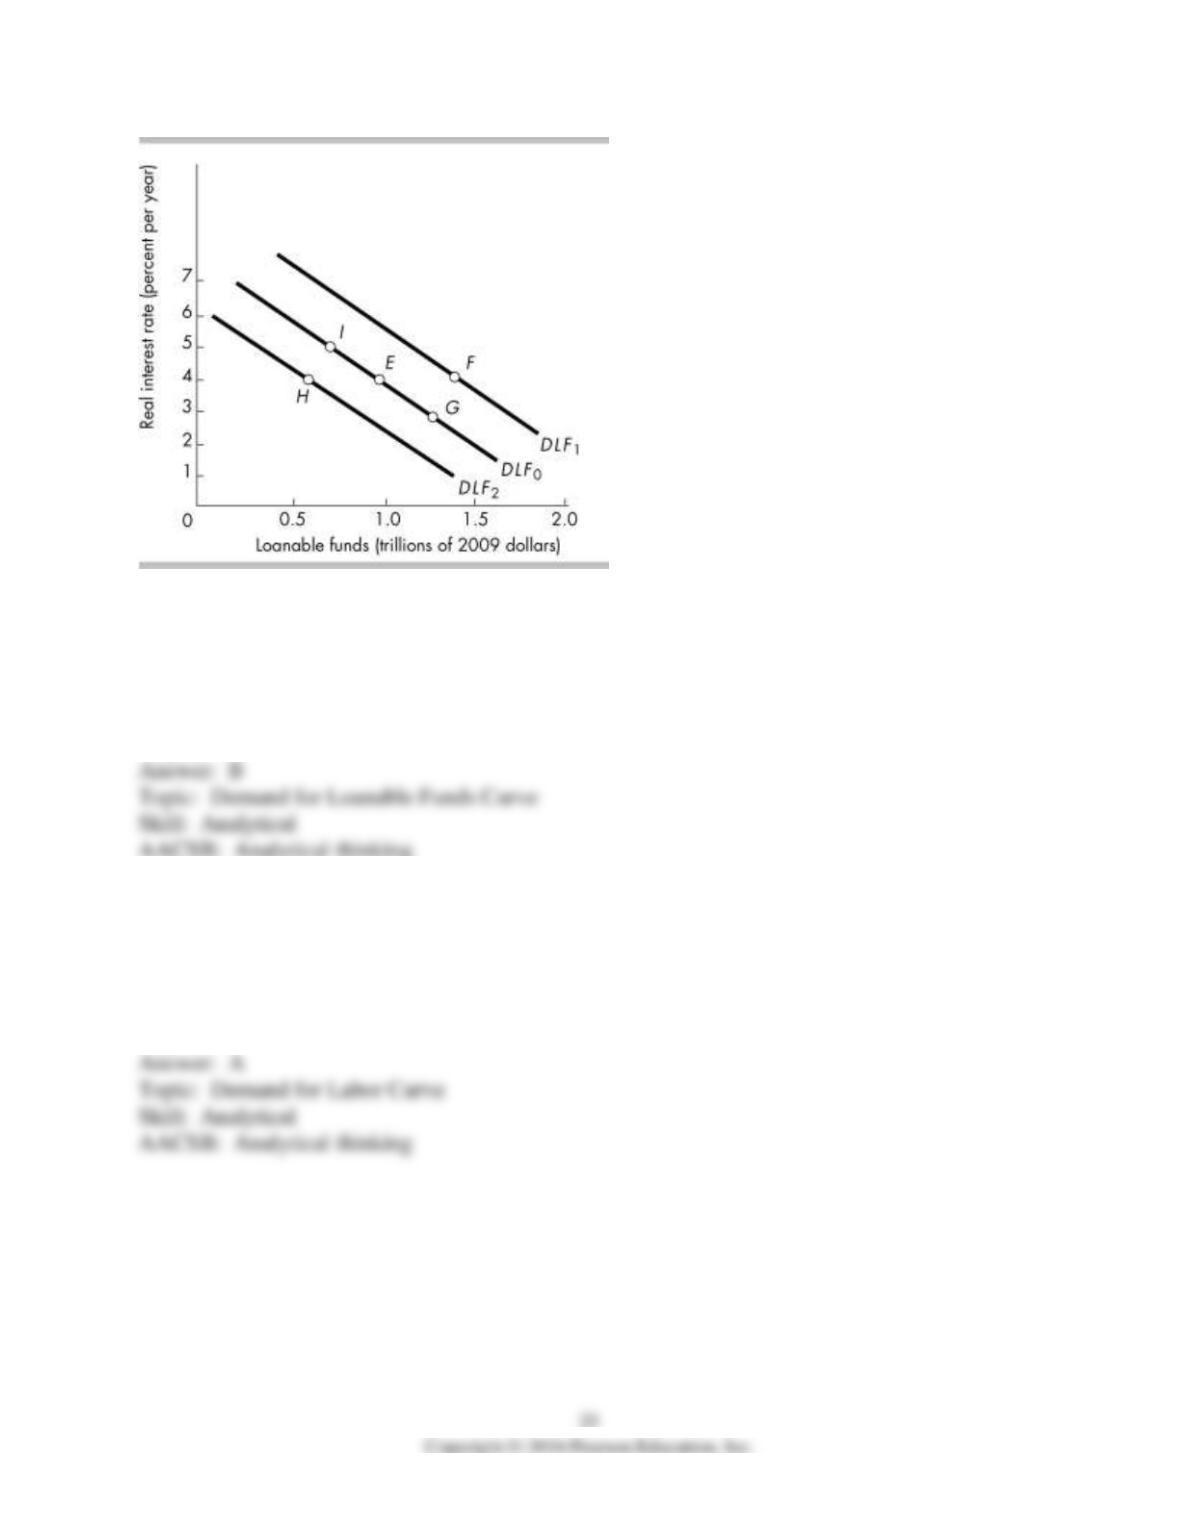
61) In the above figure, a decrease in the real interest rate will result in a movement from point E
to
A) point F.
B) point G.
C) point H.
D) point I.
62) In the above figure, an increase in the expected profit will result in a movement from point E
to
A) point F.
B) point G.
C) point H.
D) point I.
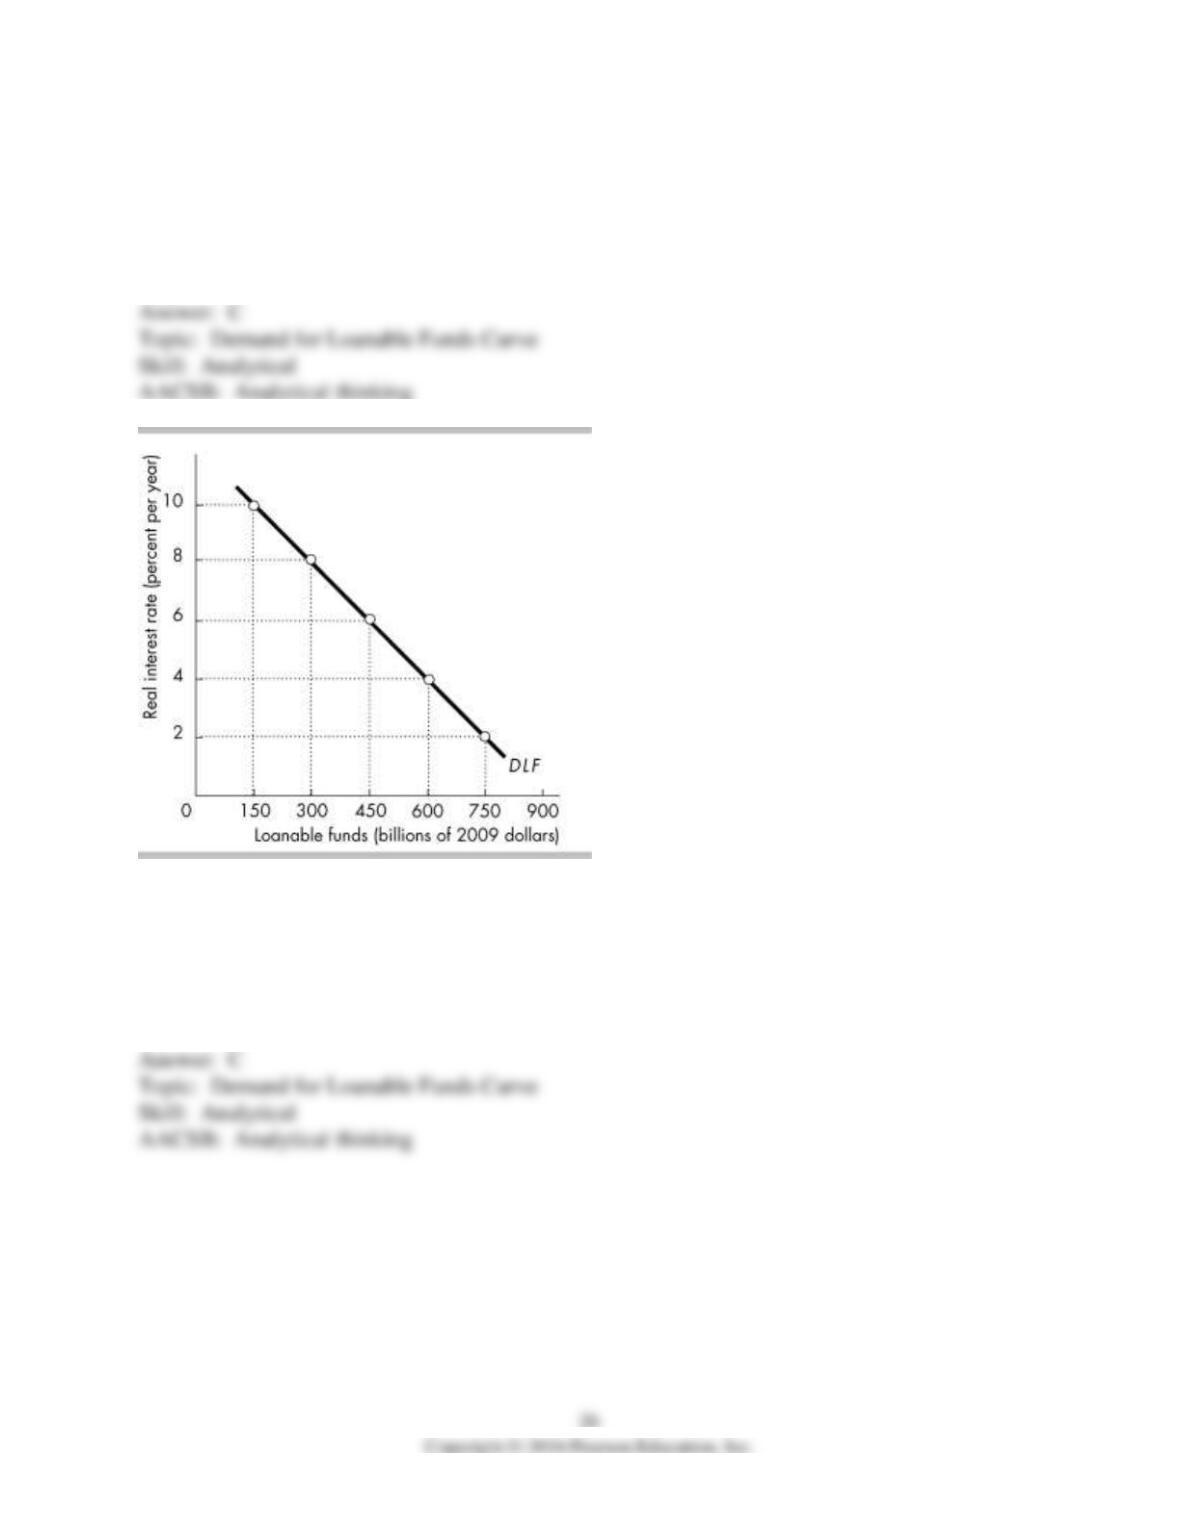
63) In the above figure, a decrease in the expected profit will result in a movement from point E
to
A) point F.
B) point G.
C) point H.
D) point I.
64) In the above figure, if the real interest rate is 6 percent, the quantity of loanable funds
demanded is
A) $150 billion.
B) $300 billion.
C) $450 billion.
D) $600 billion.
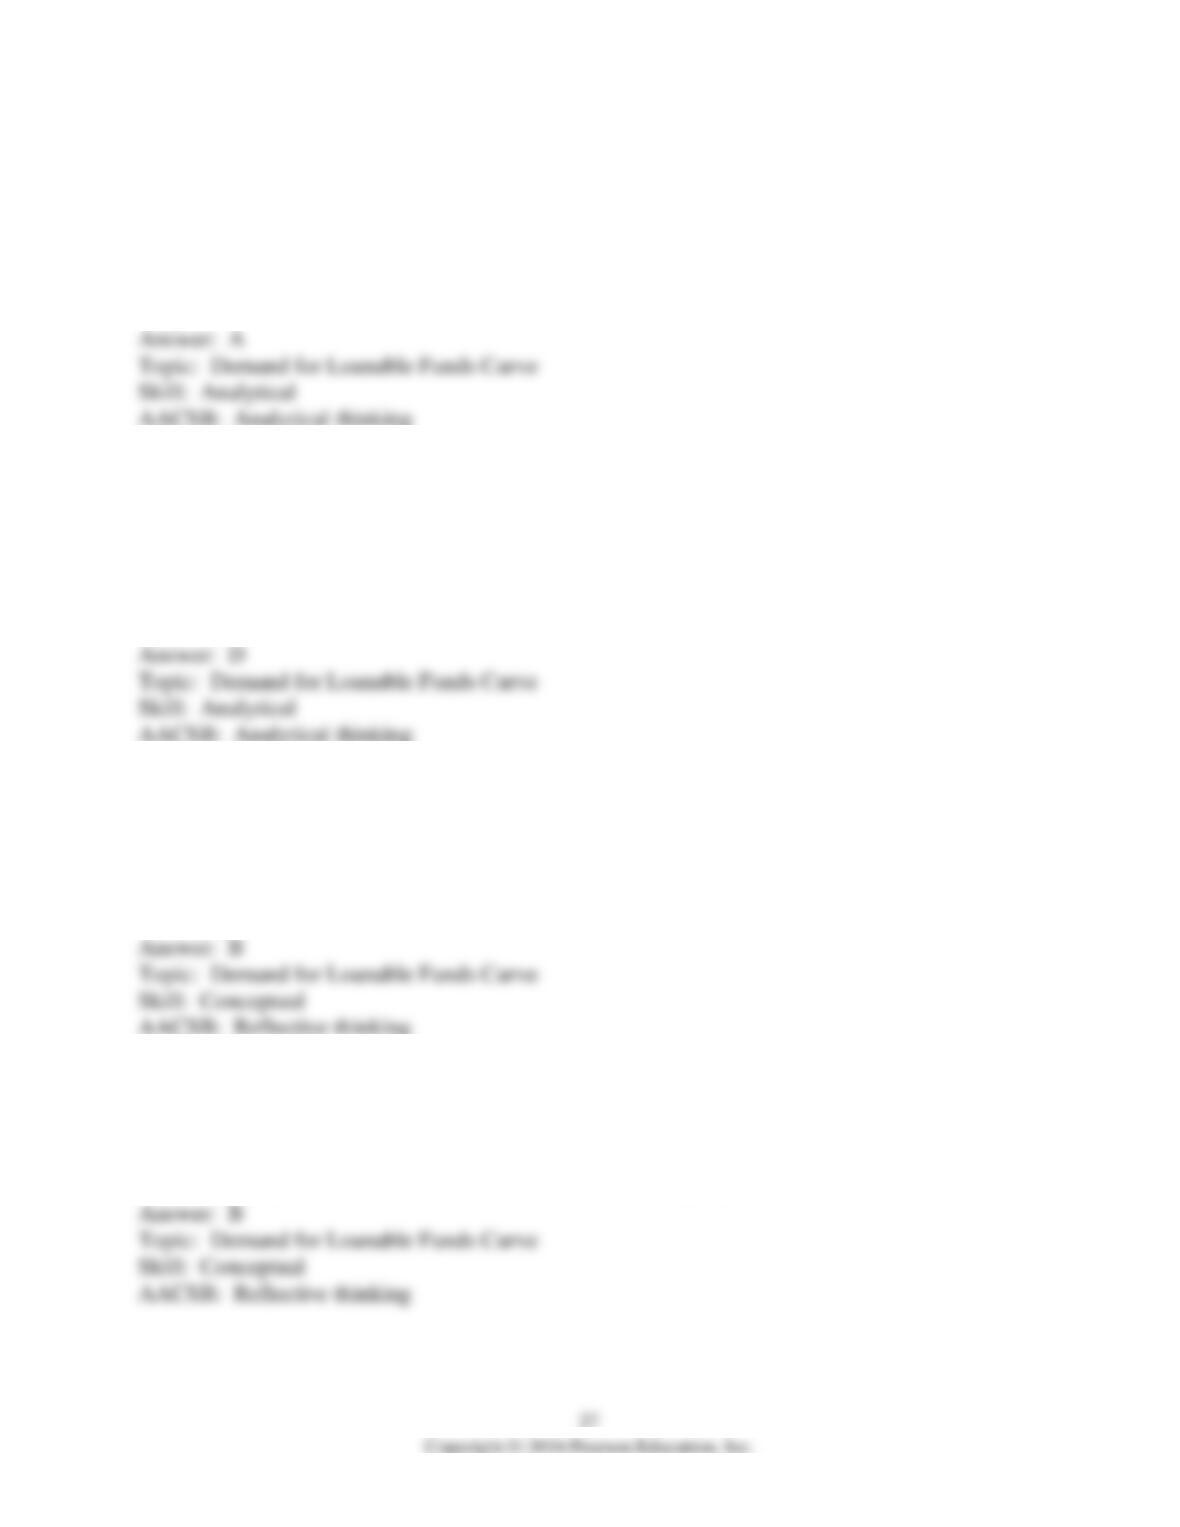
65) In the above figure, the demand for loanable funds curve is drawn for the average expected
profit. If the real interest rate is constant at 6 percent and the expected profit falls, the amount of
loanable funds demanded will be
A) less than $450 billion.
B) $450 billion.
C) between $450 billion and $600 billion.
D) greater than $600 billion.
66) In the above figure, the demand for loanable funds curve is drawn for the average expected
profit. If the real interest rate is constant at 6 percent and the expected profit rises, the amount of
loanable funds demanded will be
A) less than $450 billion.
B) $450 billion.
C) between $300 billion and $450 billion.
D) greater than $450 billion.
67) In the above figure, new expectations of booming business conditions and a higher expected
profit will
A) shift the demand for loanable funds curve leftward.
B) shift the demand for loanable funds curve rightward.
C) have no effect on the demand for loanable funds curve.
D) make the demand for loanable funds curve become horizontal.
68) In the above figure, technological progress that increases the expected profit will
A) shift the demand for loanable funds curve leftward.
B) shift the demand for loanable funds curve rightward.
C) have no effect on the demand for loanable funds curve.
D) make the demand for loanable funds curve become horizontal.
69) All of the following are sources of loanable funds EXCEPT
A) business investment.
B) private saving.
C) government budget surplus.
D) international borrowing.
70) Which of the following are included in the supply of loanable funds?
I. private saving
II. government budget surplus
III. international borrowing
A) I, II and III
B) I and III
C) II and III
D) I and II
71) In the loanable funds market, the supply comes from
A) saving, the government budget surplus and international borrowing.
B) only saving and the government budget surplus.
C) only saving.
D) only the government budget surplus and international borrowing.
72) Which of the following influences household saving?
I. The real interest rate
II. Disposable income
III. Expected future income
A) I only
B) I and II
C) I and III
D) I, II, and III
73) Which of the following is NOT a determinant of household saving?
A) the nominal interest rate
B) disposable income
C) the household’s wealth
D) expected future income
74) Saving by households
A) decreases when the real interest rate rises.
B) increases when the real interest rate rises.
C) increases when the real interest rate falls.
D) is unaffected by the real interest rate.
75) The quantity of ________ by households will be less ________.
A) saving; the higher is disposable income
B) saving; the lower is the real interest rate
C) consumption; the lower is the inflation rate
D) consumption; the higher is disposable income
76) If the real interest rate rises, people
A) save more.
B) save less.
C) earn a higher real wage rate.
D) decrease their expected future income.
77) If households’ disposable income decreases, then
A) households’ saving will decrease.
B) households’ saving will increase.
C) investment will increase.
D) Both B and C are correct.
78) Households will choose to save more if
A) income is expected to decrease in the future.
B) current disposable income increases.
C) Both answers A and B are correct.
D) Neither answer A nor B is correct.
79) Which of the following have a positive relationship with household saving?
I. the real interest rate
II. disposable income
III. expected future income
A) I and II
B) II only
C) II and III
D) I, II and III
80) Which of the following is CORRECT?
A) As disposable income increases, the real interest rate increases.
B) As disposable income decreases, saving decreases.
C) As saving decreases, disposable income increases.
D) As saving increases, investment by households decreases.
81) ________ increases households’ saving.
A) A decrease in the real interest rate
B) A tax cut that increases disposable income
C) Higher expected future income
D) A stock market boom that increases the purchasing power of households’ wealth
82) The greater a household’s ________ the less is its saving.
A) return from saving
B) wealth
C) disposable income
D) expected future profits
83) Suppose Molly has an income of $35,000 annually and has inherited a savings account of
$20,000. Wyatt has a job that pays $35,000 annually, but has debts totaling $6,000. Which of the
following is TRUE?
A) We can expect Wyatt and Molly to save the same proportion of their incomes this year.
B) We can expect Molly to save more than Wyatt this year.
C) We can expect Wyatt to save more than Molly this year.
D) We can expect Wyatt and Molly to have equal amounts of consumption this year.
84) If households expect an increase in their future incomes, they will save
A) less and consume more today.
B) more and consume less today.
C) and consume more today.
D) and consume less today.
85) Which of the following is TRUE regarding the effect expected future income has on saving?
I. As expected future income increases, saving increases.
II. Young people typically save very little.
III. Middle aged people, earning higher incomes, are not very big savers.
A) I and III
B) II only
C) III only
D) II and III
86) Sarah and Diane are both billing clerks for the local trucking company earning $17,000 per
year. Sarah is attending college, plans to graduate in one year and earn $55,000 as an economist.
Diane is not in college or undergoing any specialized training and will have the same job next
year. According to economic theory, which of the two individuals would tend to have a higher
current savings rate?
A) Diane
B) Sarah
C) Both will have the same saving rate.
D) Economic theory sheds no light on this question.
87) If two households have the same disposable income in the current year, the household with
the
A) higher expected future income will consume a larger portion of its current income today.
B) lower expected future income will consume more today while it has the money.
C) lower expected future income will spend a larger portion of its current income on
consumption today because it will increase its saving in the future.
D) none of the above
88) The supply of loanable funds is the relationship between loanable funds and ________ other
things remaining the same.
A) real GDP
B) the price level
C) the real interest rate
D) the inflation rate
89) Changes in all of the following shift the supply curve of loanable funds EXCEPT
A) the real interest rate.
B) wealth.
C) disposable income.
D) expected future income.
90) Which of the following will shift the supply of loanable funds curve leftward?
A) a decrease in the real interest rate
B) a decrease in real wealth
C) a decrease in disposable income
D) a decrease in expected future income
91) An increase in ________ will shift the supply of loanable funds curve ________.
A) expected future income; rightward
B) wealth; leftward
C) disposable income; leftward
D) default risk; rightward
92) As a result of the recession in 2008, the default risk increased. How did this change affect the
loanable funds market?
A) There was a movement up along the supply of loanable funds curve.
B) There was a leftward shift in the supply of loanable funds curve.
C) There was a movement down along the demand for loanable funds curve.
D) There was a rightward shift in the supply of loanable funds curve.
93) When the real interest rate increases
A) the supply of loanable funds curve shifts rightward.
B) the supply of loanable funds curve shifts leftward.
C) there is a movement upward along the supply of loanable funds curve.
D) there is a movement downward along the supply of loanable funds curve.
94) An increase in the real interest rate results in a
A) rightward shift in the supply of loanable funds curve.
B) leftward shift in the supply of loanable funds curve.
C) movement along the supply of loanable funds curve.
D) none of the above.
95) Which of the following is TRUE?
I. As the real interest rate increases, people increase the quantity they save.
II. The supply of loanable funds curve is downward sloping.
III. As disposable income increases, the supply of loanable funds curve becomes steeper.
A) I and III
B) II and III
C) I only
D) III only
96) In the loanable funds market, an increase in wealth shifts the ________ loanable funds curve
________.
A) supply of; rightward
B) supply of; leftward
C) demand for; rightward
D) demand for; leftward
97) An increase in disposable income ________.
A) has no effect on the supply of loanable funds curve
B) shifts the supply of loanable funds curve rightward
C) shifts the supply of loanable funds curve leftward
D) results in movement up the supply of loanable funds curve
98) If households believe their incomes will fall in the future, the result is a
A) rightward shift in the supply of loanable funds curve.
B) leftward shift in the supply of loanable funds curve.
C) movement along the supply of loanable funds curve.
D) movement along the demand for loanable funds curve.
99) In the above figure, the economy is at point a on the initial supply of loanable funds curve
SLF0. What happens if disposable income decreases?
A) Nothing; the economy would remain at point a.
B) There would be a movement to a point such as b on supply of loanable funds curve SLF0.
C) The supply of loanable funds curve would shift rightward to a curve such as SLF2.
D) The supply of loanable funds curve would shift leftward to a curve such as SLF1.
100) In the above figure, the economy is at point a on the initial supply of loanable funds curve
SLF0. What happens if the real interest rate rises?
A) Nothing; the economy would remain at point a.
B) There would be a movement to a point such as b on supply of loanable funds curve SLF0.
C) The supply of loanable funds curve would shift rightward to a curve such as SLF2.
D) The supply of loanable funds curve would shift leftward to a curve such as SLF1.
101) In the above figure, the economy is at point a on the initial supply of loanable funds curve
SLF0. What happens if the interest rate rises?
A) There is a movement to a point such as b on supply of loanable funds curve SLF0.
B) The supply of loanable funds curve shifts rightward to a curve such as SLF2.
C) The supply of loanable funds curve shifts leftward to a curve such as SLF1.
D) none of the above
102) In the above figure, the economy is at point a on the initial supply of loanable funds curve
SLF0. What happens if real wealth decreases?
A) Nothing; the economy would remain at point a.
B) There would be a movement to a point such as b on supply of loanable funds curve SLF0.
C) The supply of loanable funds curve would shift rightward to a curve such as SLF2.
D) The supply of loanable funds curve would shift leftward to a curve such as SLF1.
103) In the loanable funds market, as the interest rate rises the ________ and the ________.
A) quantity of loanable funds supplied increases; quantity of loanable funds demanded decreases
B) quantity of loanable funds supplied decreases; quantity of loanable funds demanded increases
C) supply of loanable funds increases; demand for loanable funds decreases
D) supply of loanable funds decreases; demand for loanable funds increases
104) Suppose the current real interest rate is 4 percent and the equilibrium real interest rate is 3
percent. Then
A) prices rise and inflation occurs.
B) there is a surplus of loanable funds.
C) there is a shortage of loanable funds.
D) there is neither a shortage nor surplus of loanable funds.
105) An increase in the real interest rate ________ the quantity of loanable funds supplied and
________ the quantity of loanable funds demanded.
A) increases; increases
B) increases; decreases
C) decreases; increases
D) decreases; decreases
106) When the actual real interest rate is less than the equilibrium real interest rate
A) the equilibrium real interest rate will rise.
B) borrowers find it difficult to borrow.
C) there is a shortage of loanable funds.
D) Both answers B and C are correct.
107) If the quantity of loanable funds supplied exceeds the quantity of loanable funds demanded,
then ________.
A) the real interest rate will rise
B) firms will decrease their investment demand
C) people will save more
D) the real interest rate will fall
108) If the real interest rate is above the equilibrium real interest rate
A) lenders will be unable to find borrowers willing to borrow all of the available funds and the
real interest rate will fall.
B) borrowers will be unable to borrow all of the funds they want to borrow and the real interest
rate will rise.
C) lenders will be unable to find borrowers willing to borrow all of the available funds and the
real interest rate will rise.
D) borrowers will be unable to borrow all of the funds they want to borrow and the real interest
rate will fall.
109) If the real interest rate is below the equilibrium real interest rate
A) lenders will be unable to find borrowers willing to borrow all of the available funds and the
real interest rate will fall.
B) borrowers will be unable to borrow all of the funds they want to borrow and the real interest
rate will rise.
C) lenders will be unable to find borrowers willing to borrow all of the available funds and the
real interest rate will rise.
D) borrowers will be unable to borrow all of the funds they want to borrow and the real interest
rate will fall.
110) If the real interest rate is below the equilibrium real interest rate
A) lenders will be unable to find borrowers willing to borrow all of the available funds and the
supply of loanable funds curve will shift leftward.
B) borrowers will be unable to borrow all of the funds they want to borrow and the demand for
loanable funds curve will shift rightward.
C) a shortage of loanable funds will cause the real interest rate to rise.
D) borrowers will be unable to borrow all of the funds they want to borrow and the demand for
loanable funds curve will shift leftward.
111) In the loanable funds market, if the interest rate is above the equilibrium level
A) there is a shortage of loanable funds.
B) there is a surplus of loanable funds.
C) expected profit falls.
D) government expenditure decreases.
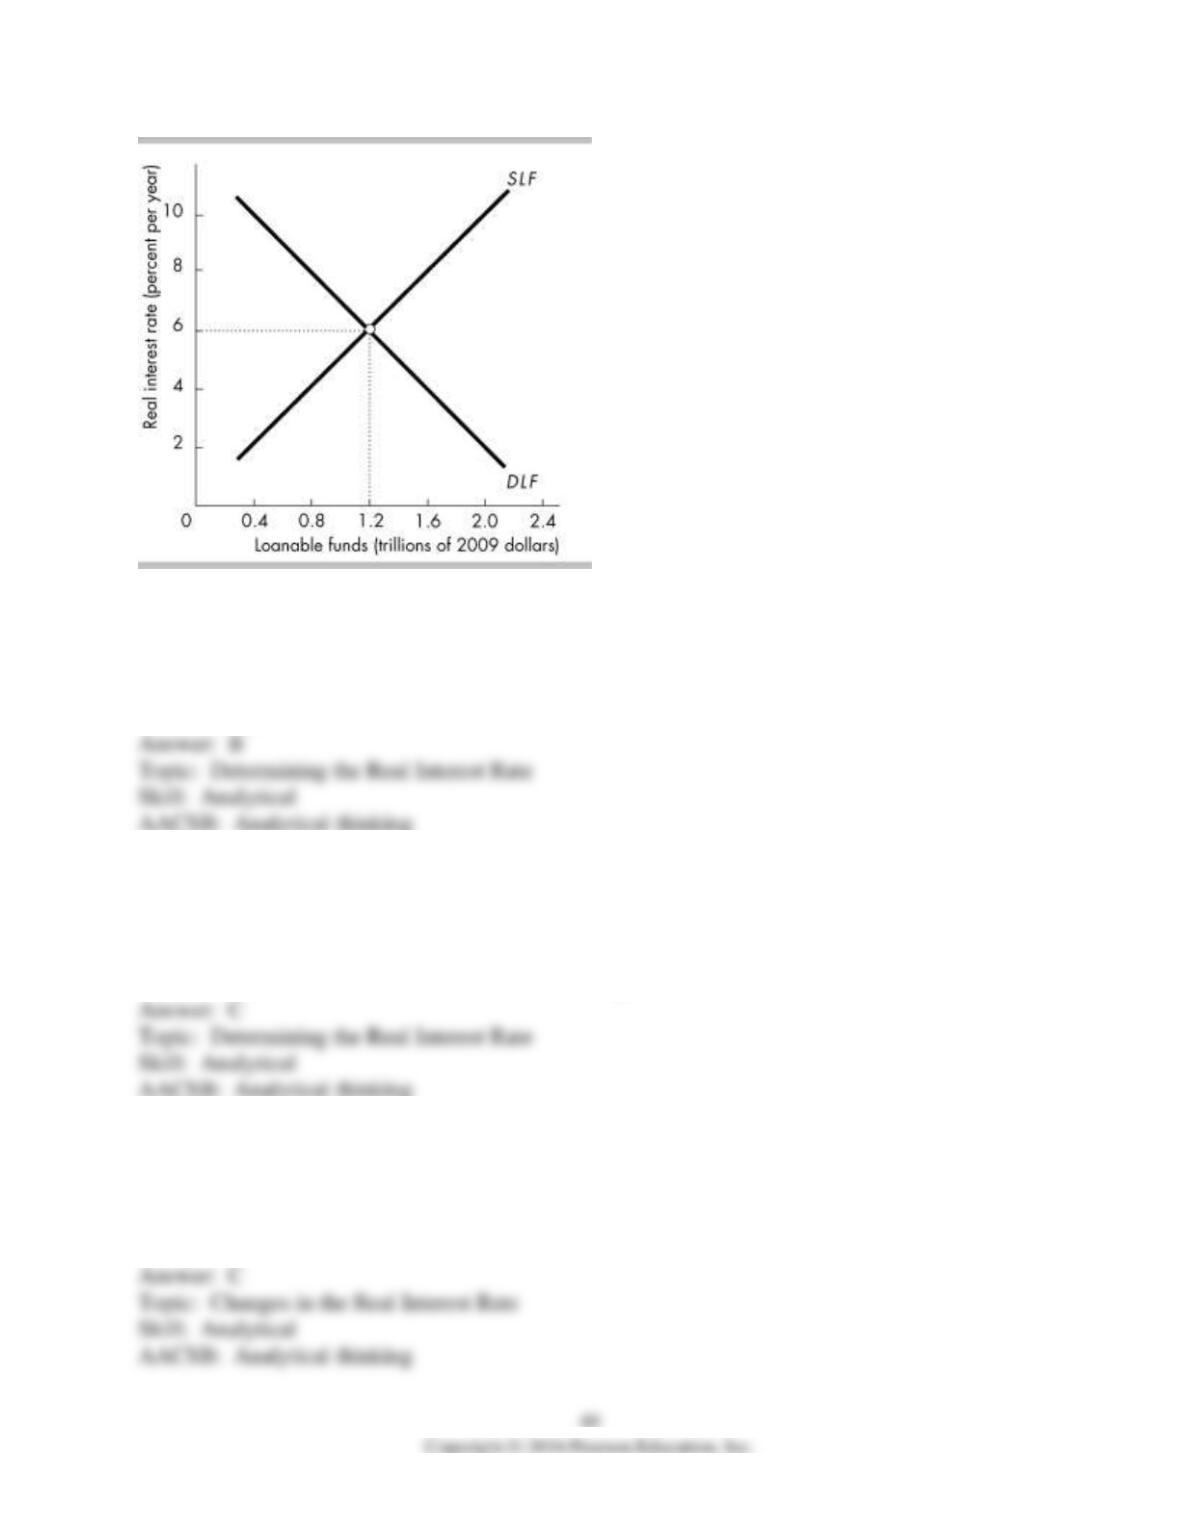
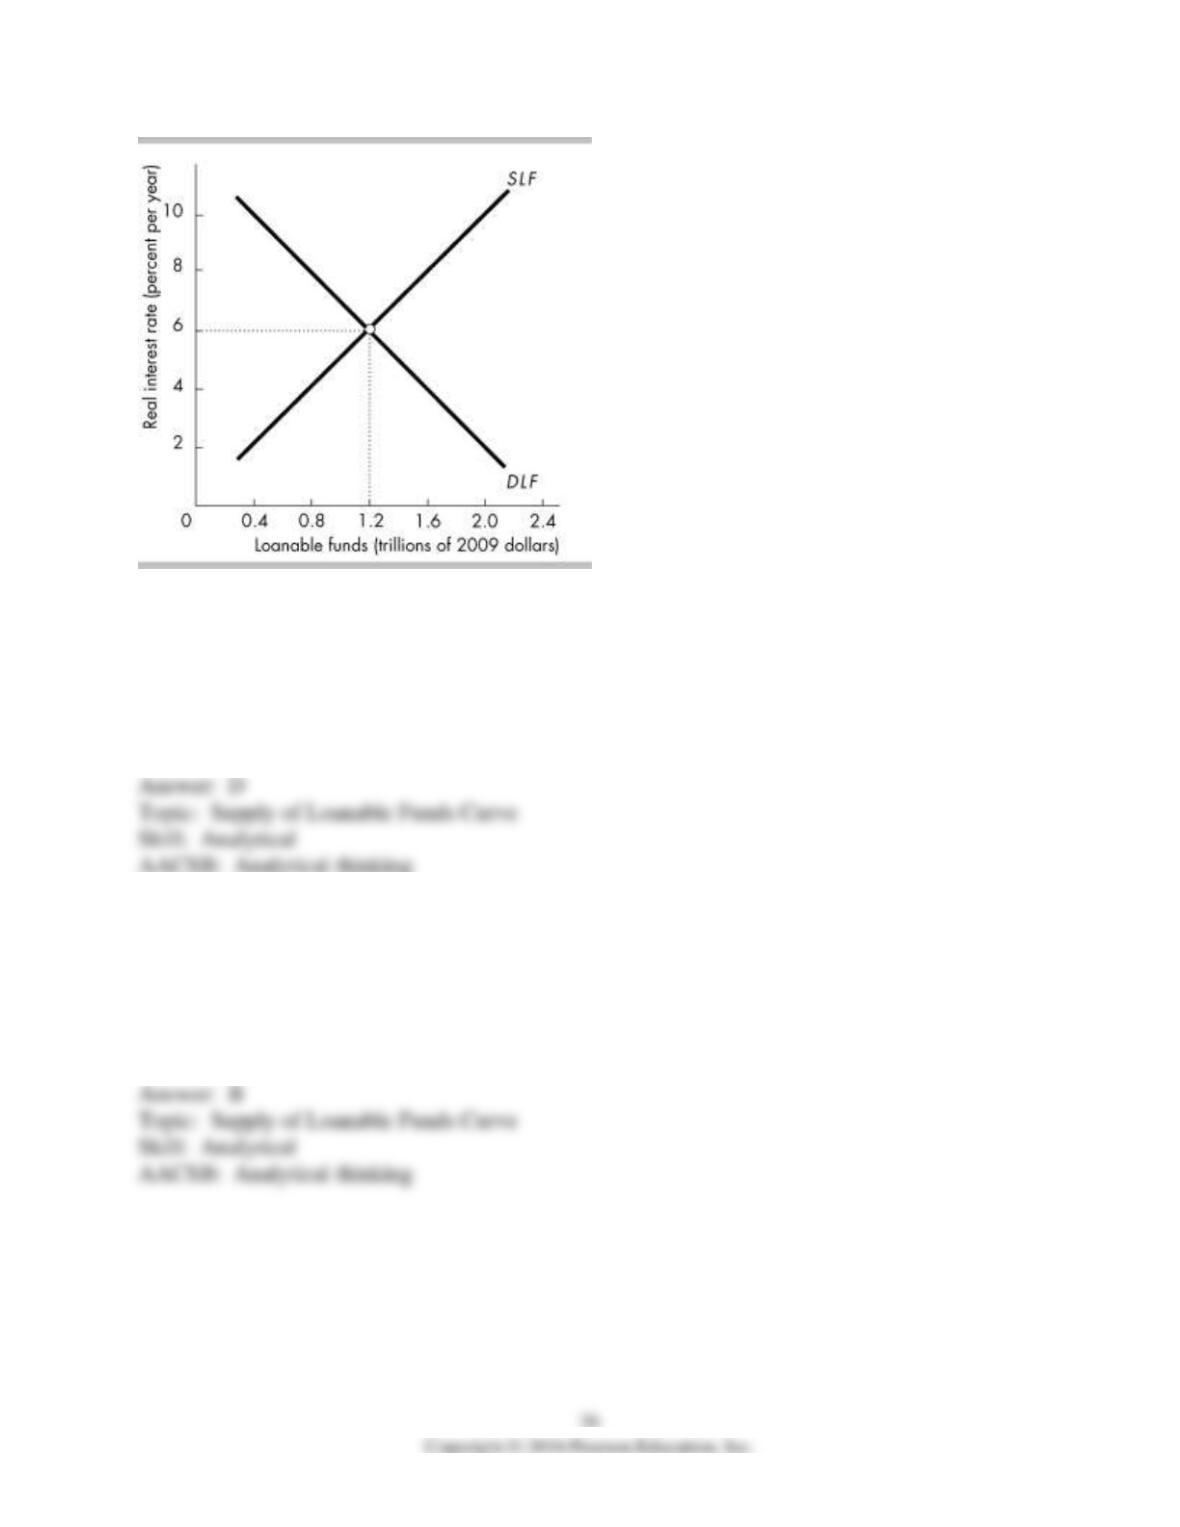
112) In the above figure, if the real interest rate is 8, there is
A) underproduction in this economy.
B) a surplus of loanable funds.
C) a shortage of loanable funds.
D) a shortage in available funds for investment.
113) In the above figure, if the real interest rate is 4 percent, then there
A) there is a surplus of loanable funds.
B) is equilibrium in the loanable funds market.
C) the real interest rate will rise.
D) the demand curve for loanable funds will shift rightward.
114) An increase in disposable income shifts the supply of loanable funds curve
A) leftward and decreases the real interest rate.
B) leftward and increases the real interest rate.
C) rightward and decreases the real interest rate.
D) rightward and increases the real interest rate.