Unlock document.
This document is partially blurred.
Unlock all pages and 1 million more documents.
Get Access
65
CHAPTER 7: KEYNESIAN SYSTEM (III): POLICY EFFECTS IN
THE IS-LM MODEL
Additional Questions
Essay Questions and/or Problems:
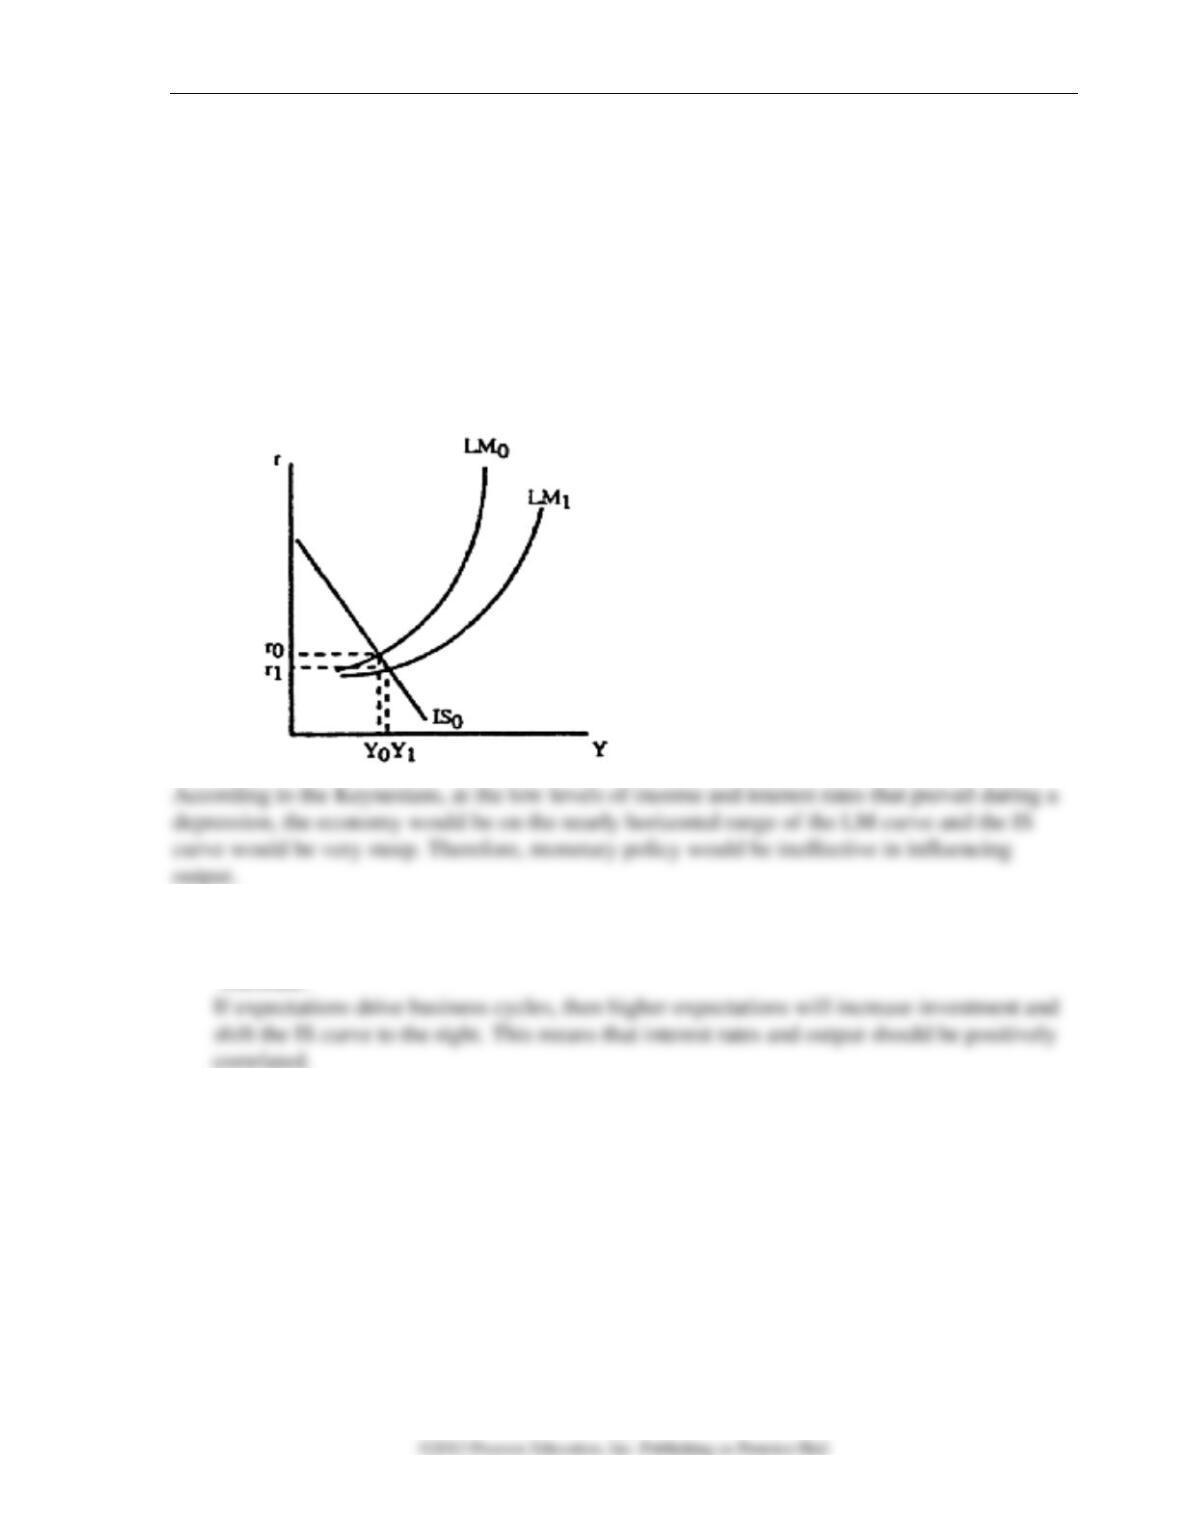
1. Graphically show and discuss monetary policy ineffectiveness with respect to a depression.
Figure 7-5
2. If changes in expectations drive business cycles, what relationship would we expect to see
between interest rates and output in an economy? Explain using an IS-LM graph to
illustrate.
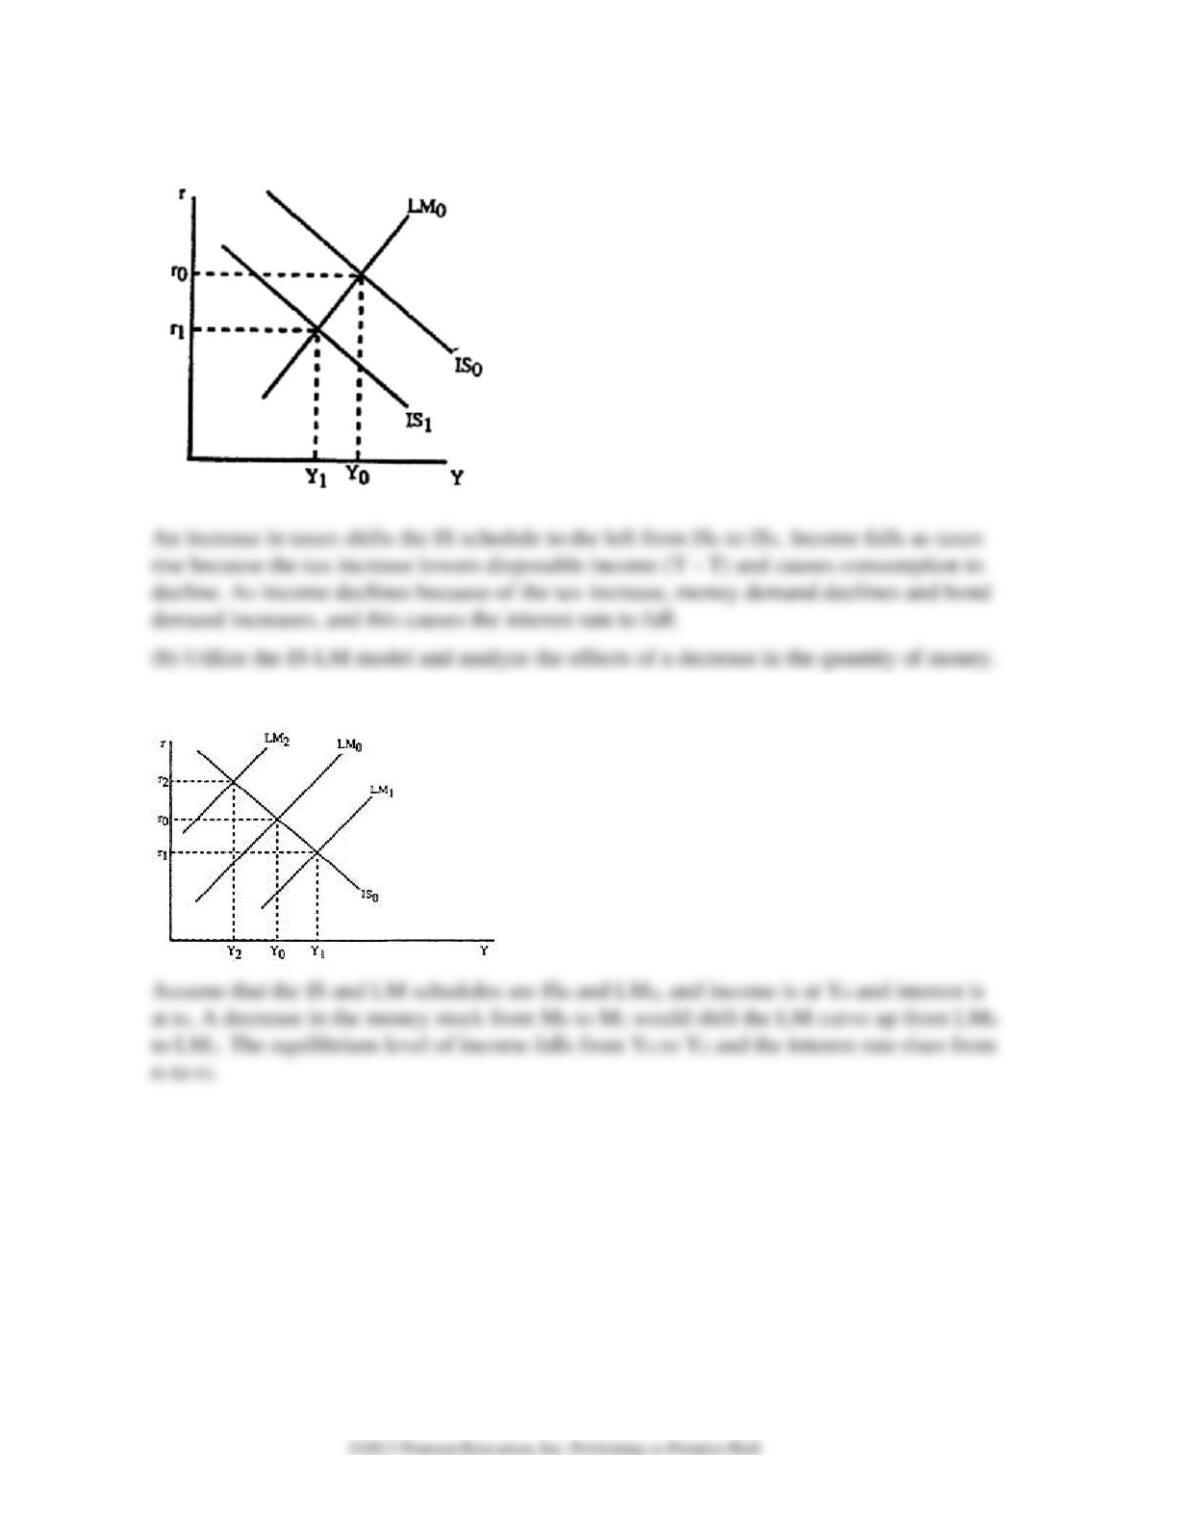
3. (a) Graphically show and analyze the effects of an increase in taxes in the IS-LM model.
66 CHAPTER 7
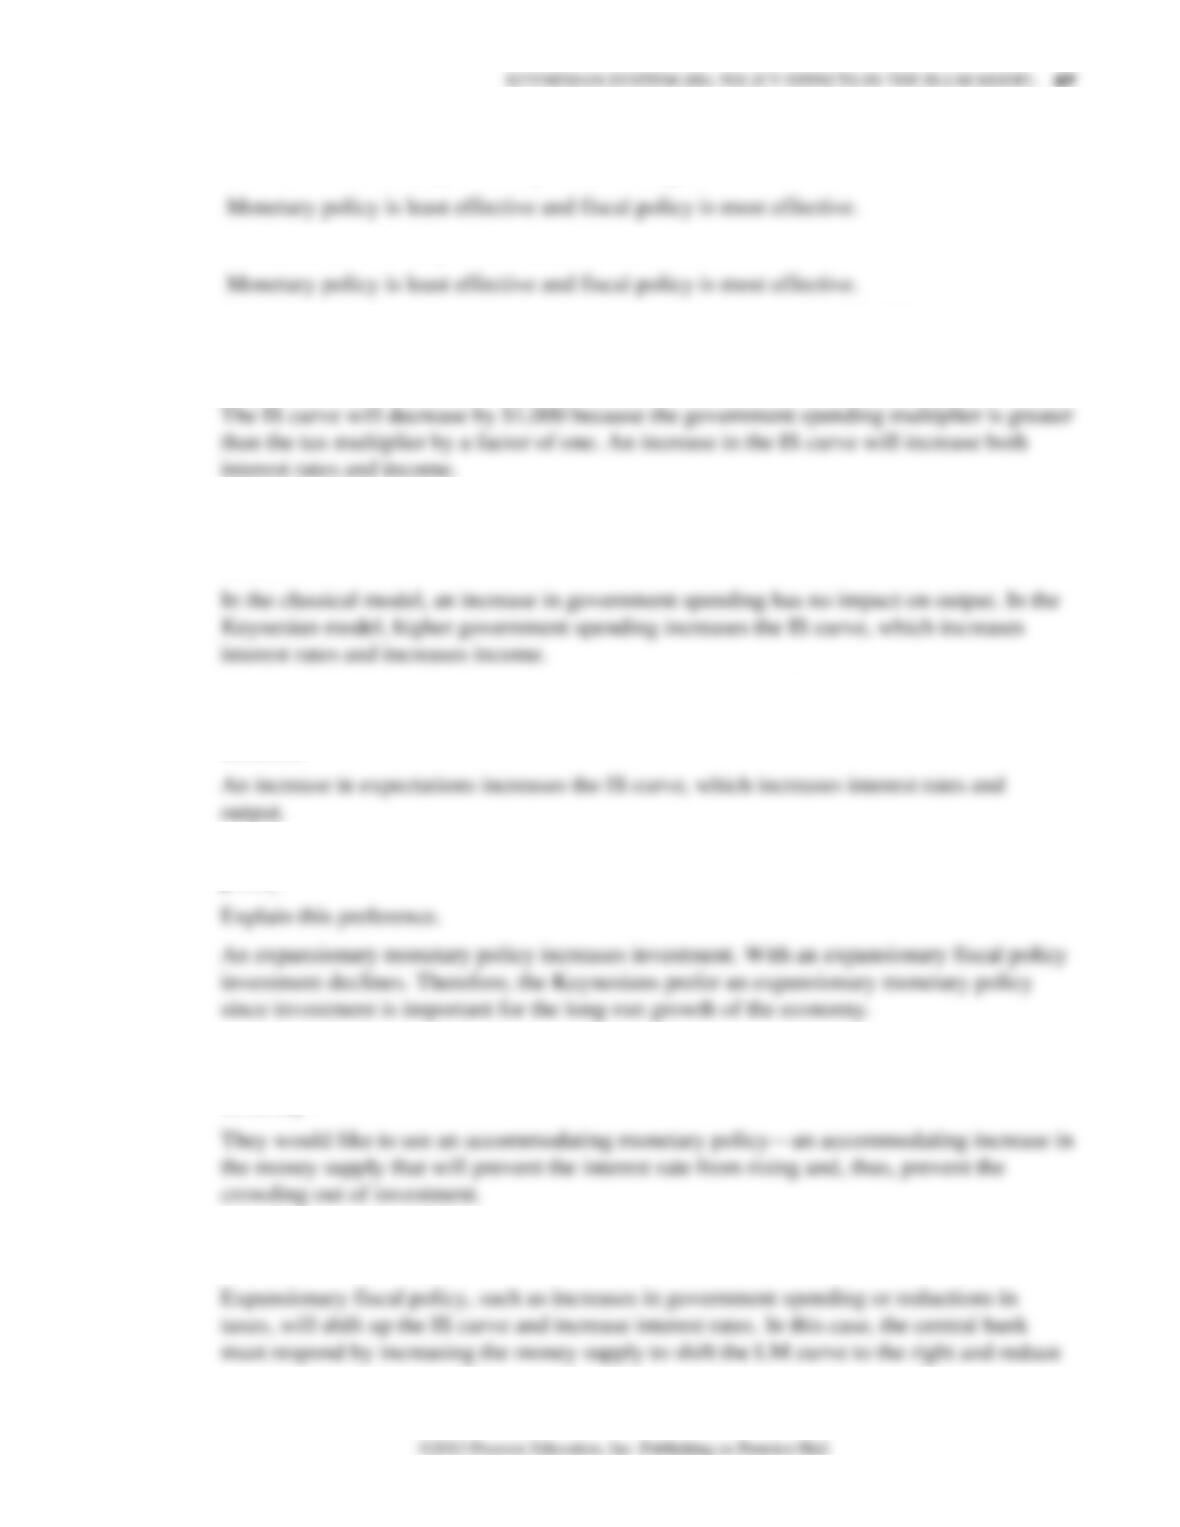
Figure 7-6
Figure 7-7
4. Explain the effectiveness of monetary and fiscal policy when
a. the interest elasticity of money demand is high.
b. the interest elasticity of investment is low.
5. Suppose that both government spending and taxes decrease by $1,000. What happens to
aggregate income and interest rates? By how much will they change? Explain using an IS-
LM graph to illustrate.
6. Compare the effects of an autonomous increase in government spending in the IS-LM
curve version of the Keynesian model with the effect of the same shift within the classical
model.
7. Analyze the effects of an increase in expected future profitability in the Keynesian model,
making sure to discuss what happens to interest rates and output. Provide graphs to
illustrate.
8. (a) Why do the Keynesians prefer a policy mix of "tight" fiscal policy and "easy" monetary
policy?
(b) Since the Keynesians prefer a policy mix of relatively "tight" fiscal policy and "easy"
monetary policy, how would they respond to an income tax cut in order to expand the
economy?
9. Using an IS-LM graph, illustrate how the central bank could target interest rates in response
to expansionary fiscal policy.
10. Between March and November of 2001, the U.S. economy experienced a recession at the
same time that nominal interest rates fell significantly. Using the Keynesian model as the
base of your analysis, what does this indicate to you about the cause of the cause of the
2001 recession? Be as specific responsible, using graphs to support your answer.
Additional Essay Questions and/or Problems:
11. Using the IS-LM curve framework, analyze the effects of each of the following shifts on
the level of income and the interest rate.
a. A fall in the autonomous component of investment
b. A rise in a, the intercept of the consumption function, C = a + bYD
c. An increase in the level of government spending
d. An open market purchase of securities by the Federal Reserve System
12. You are given the following two situations
a. Investment is very interest elastic (interest sensitive) while the demand for money is
very interest inelastic
b. Investment is very interest inelastic while the demand is very interest inelastic
In which situation would monetary policy be most effective in changing the level of
income? In which situation would fiscal policy be most effective? Explain completely.
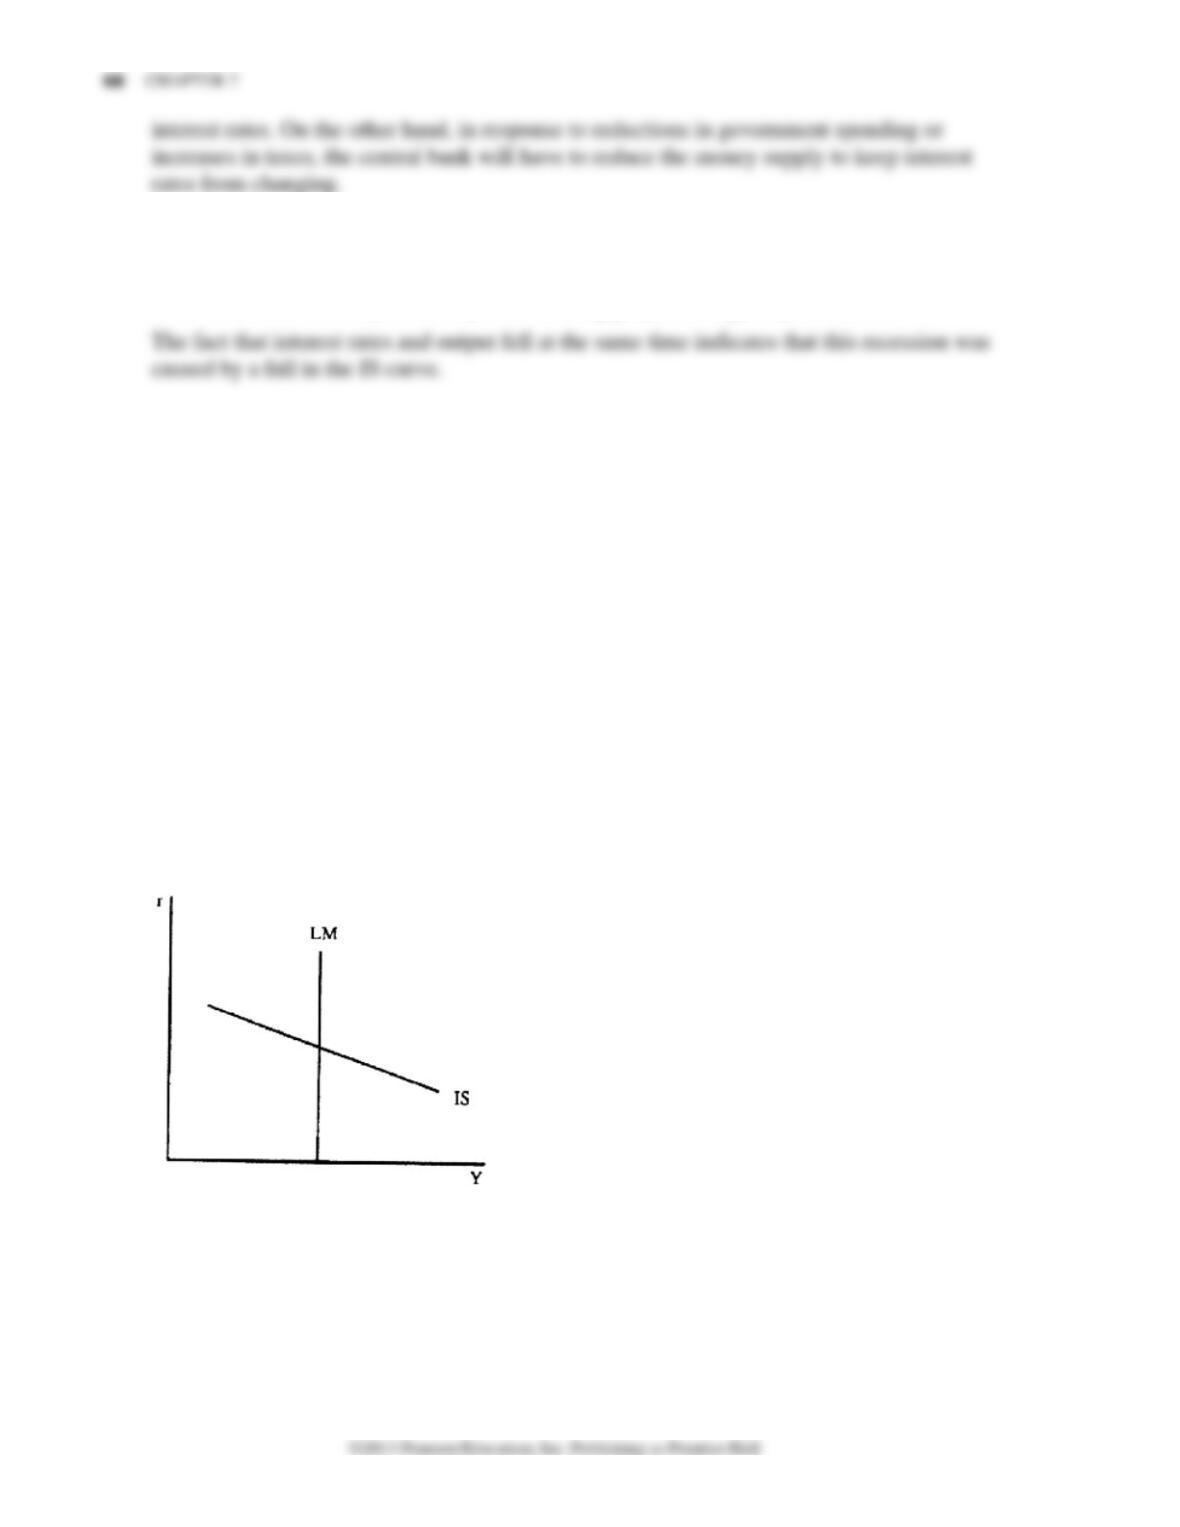
13. Consider the following IS-LM diagram.
Figure 7-8
a. From the graph, what are you able to infer about the interest elasticities of money
demand and of investment demand?
b. What implications do the slopes of the IS and LM schedules in the diagram have
concerning the effectiveness of monetary and fiscal policies? Explain.
c. Would it be sensible to call the configuration of the IS and LM schedules in the graph a
"classical case?" Why or why not?

14. Explain why a decrease in taxes cause the interest rate to rise. What factors determine the
magnitude of the increase in the interest rate for a given decrease in taxes?
15. Use the IS/LM model to analyze the impact of the 2007-08 financial crisis in the US,
making sure to include (i) the impact of the loss of wealth from declining home and stock
prices, (ii) the loss of confidence associated with the failure of financial institutions, (iii) the
impact of changes in monetary and fiscal policy. Prove graphs to illustrate.
Additional Problem from the Appendix
1. Start with the solution for the equilibrium values of Y and r from question 1 in the
Appendix to Chapter 5. Show how these values would change if the money supply rose
from 100 to a new level of 130.
2. Consider the following economy:
C = .6(Y-T)
I = 1,000-20r
G = 180
T = 180
MS = 1,500
Md = Y – 50r
(a) Calculate the IS and LM curves. Use these curves to determine equilibrium interest rates
and output.
(b) Explain in detail the intuition behind why the IS and LM curves are sloped as they are.
Provide graphs to aid your explanation.
(c) Suppose that both G and T rise by 40 to G = T = 220. Calculate what will happen to Y*
and i*? Can you explain the intuition behind what is going on here? Provide a graph to
support your explanation.
3. C = 400 + .75(Y-T)
I = 400 - 20r
G = 200
T = 200
Ms = 250
Md = .25Y - 10r
70 CHAPTER 7
a. Calculate the IS and LM curves. Give a brief explanation as to why they are positively
or negatively sloped.
b. Calculate equilibrium output and interest rates.
c. According to an agreement between the central bank and the fiscal authorities, the
government agrees to cut taxes and government spending by $40 in return for an
increase in the money supply by as much as is needed to keep output unchanged (i.e. for
Y* to remain at what you calculated in (a)). Calculate the change in the money supply
needed to accomplish this goal. Provide a graph to illustrate what is going on.
Multiple-Choice Questions:
1. In the Keynesian view,
2. In the IS-LM model, if interest rates rise while output falls the
3. In the liquidity trap case where the LM schedule is nearly horizontal,
4. The higher the interest sensitivity of investment, the
5. If interest rates and output rises, then
6. Assume the marginal propensity to consume is .8. To offset a fall in income of 1,000, the
government should
7. A simultaneous reduction in both taxes and the money stock will always
8. In the case where money demand is completely interest insensitive (interest elasticity
equals zero), an increase in the quantity of money will
9. The IS curve shifts when all of the following variables change except
10. Within the IS-LM curve model, an increase in government spending financed by printing
money will always
11. Within the IS-LM curve model, a decline in expectations would
12. Within the IS-LM curve model, if the government cut taxes at the same time that there was
an autonomous increase in investment demand, then
13. An increase in the money stock has no effect on equilibrium income whenever the
14. In the closed economy IS-LM model, an increase in government spending crowds-out
15. An decrease in the velocity of money will shift the
16. Assume that there is an increase in perceived bankruptcy risk. As a result of this we would
expect to see
Figure 7-1
17. By referring to Figure 7-1, an increase in the money stock
18. According to Figure 7-1, a decrease in the money stock
19. Changes in all of the following shift the LM curve except
20. Comparing the simple Keynesian model with the IS-LM model, in the IS-LM model
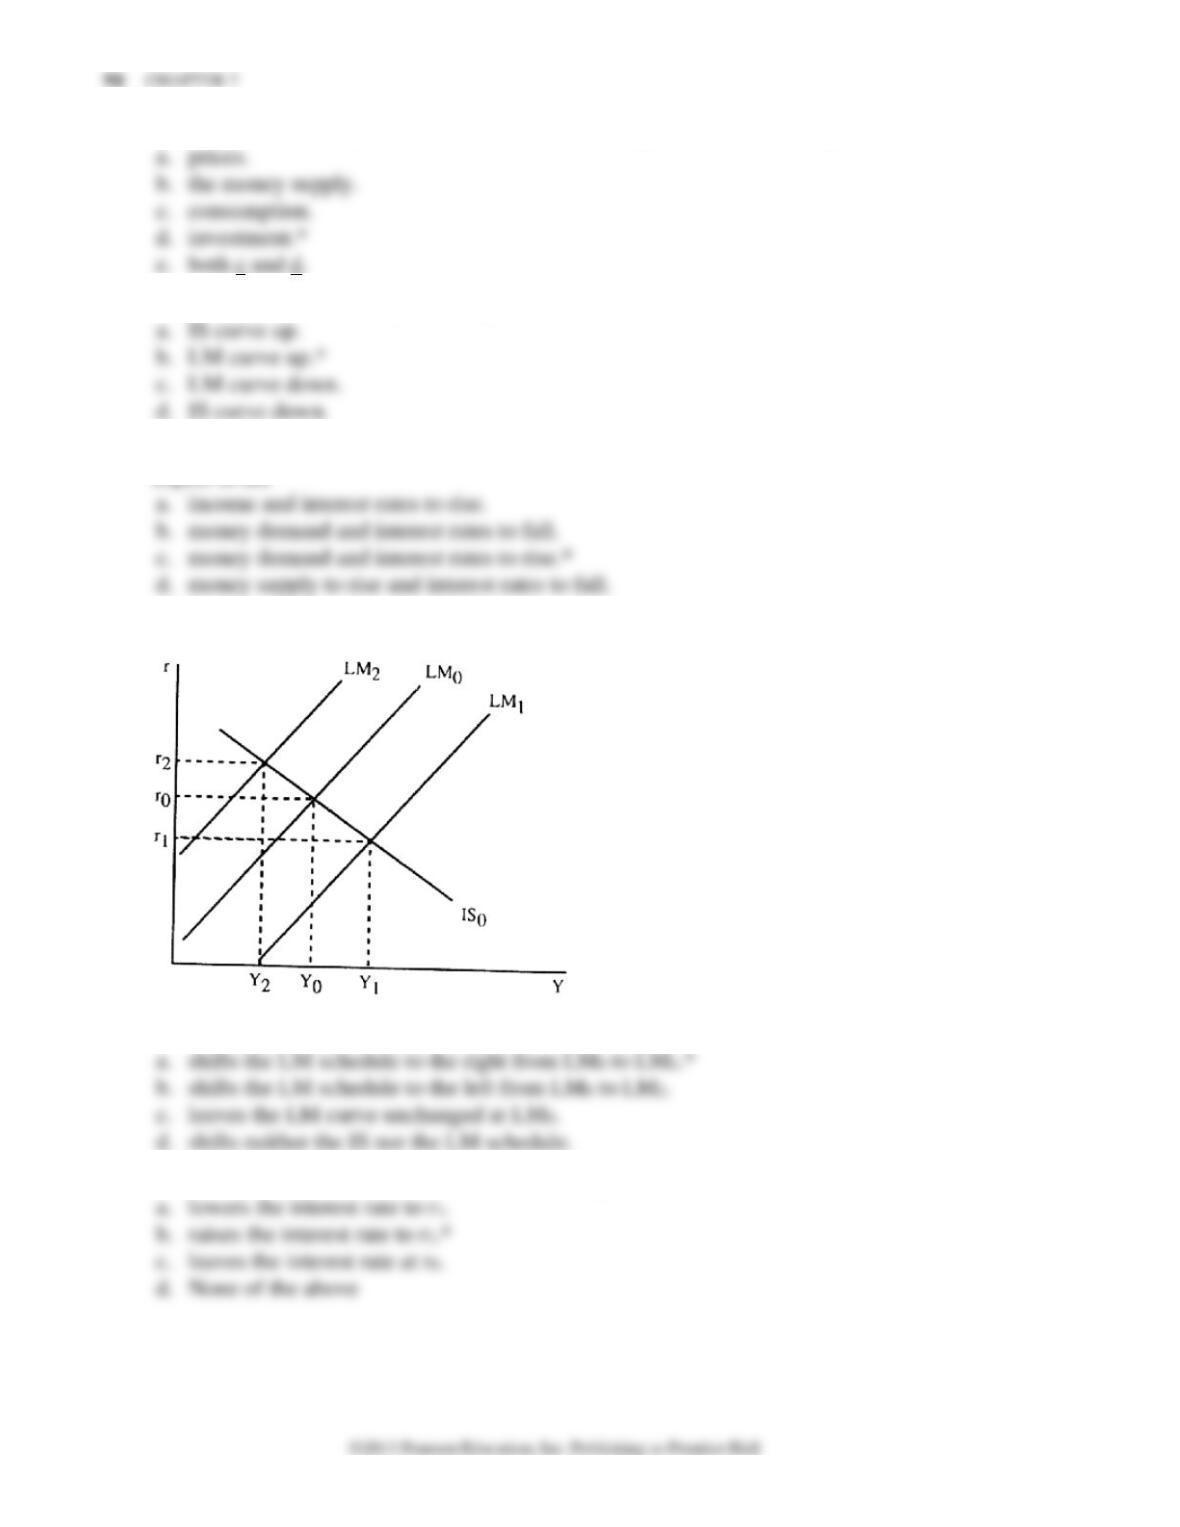
Figure 7-2
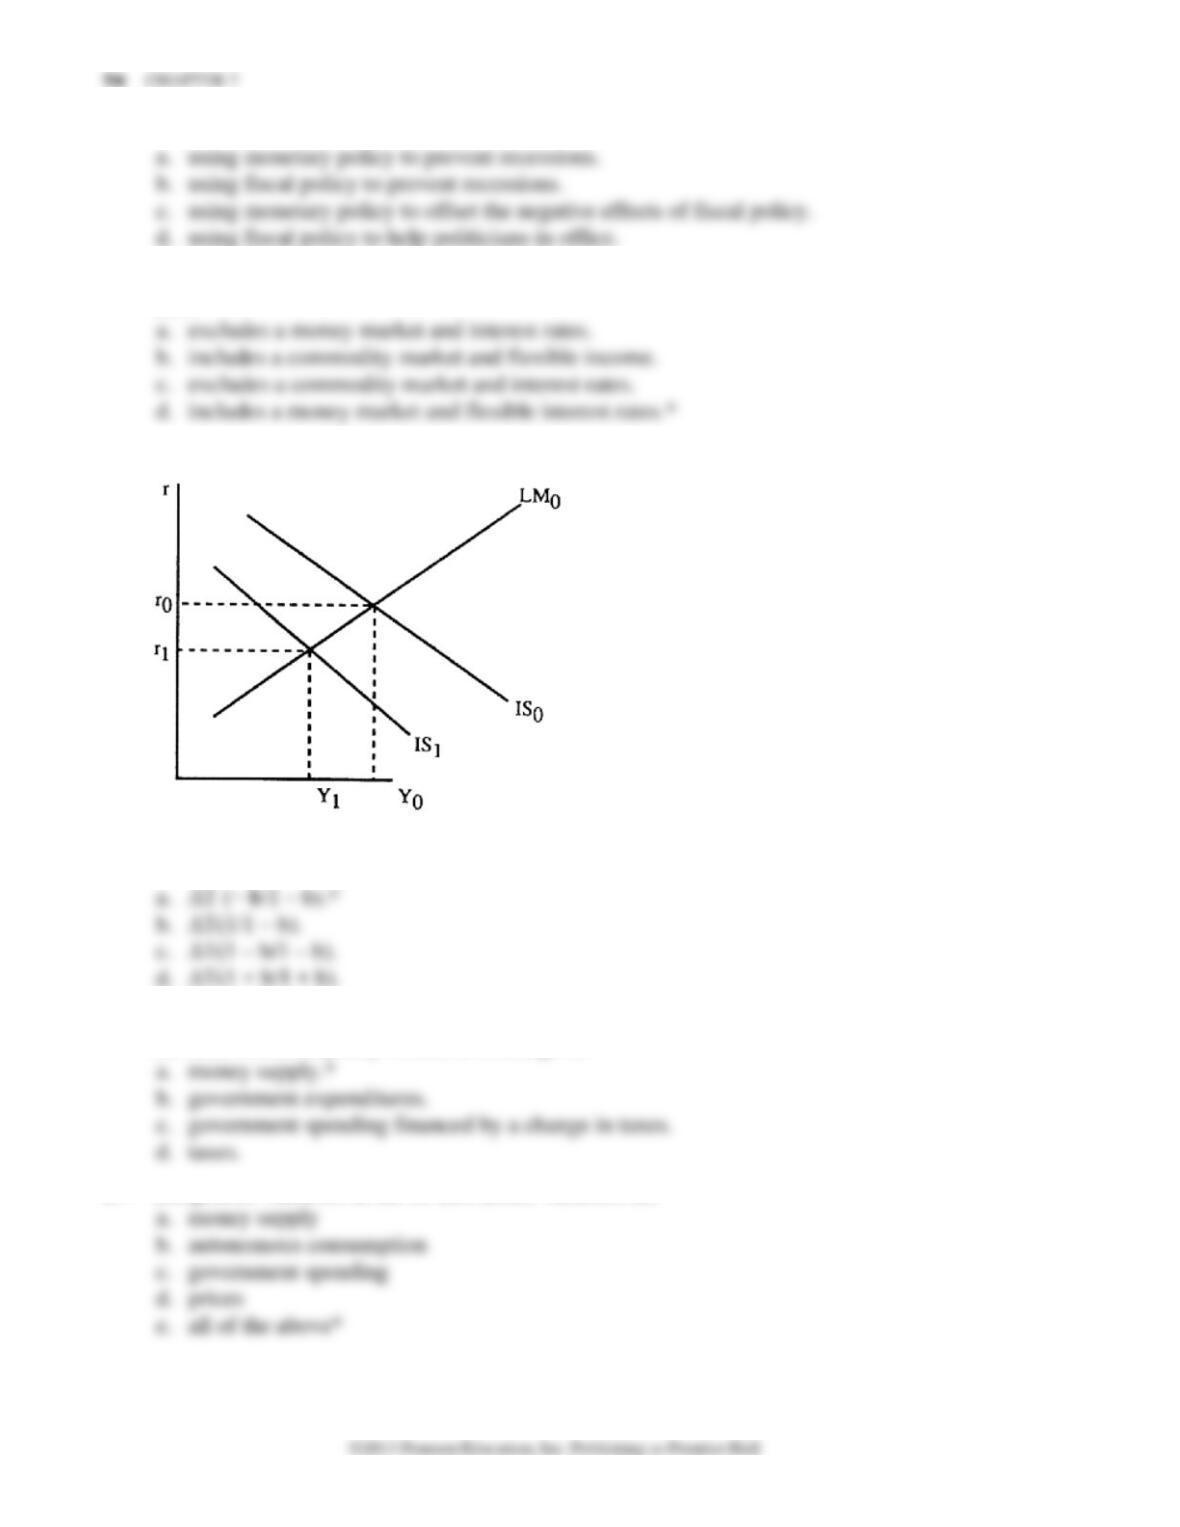
21. With respect to Figure 7-2, an increase in government spending
22. Monetary policy will be
23. Accommodating fiscal policy refers to
24. The difference between the simple Keynesian model and the IS-LM curve model is that the
latter
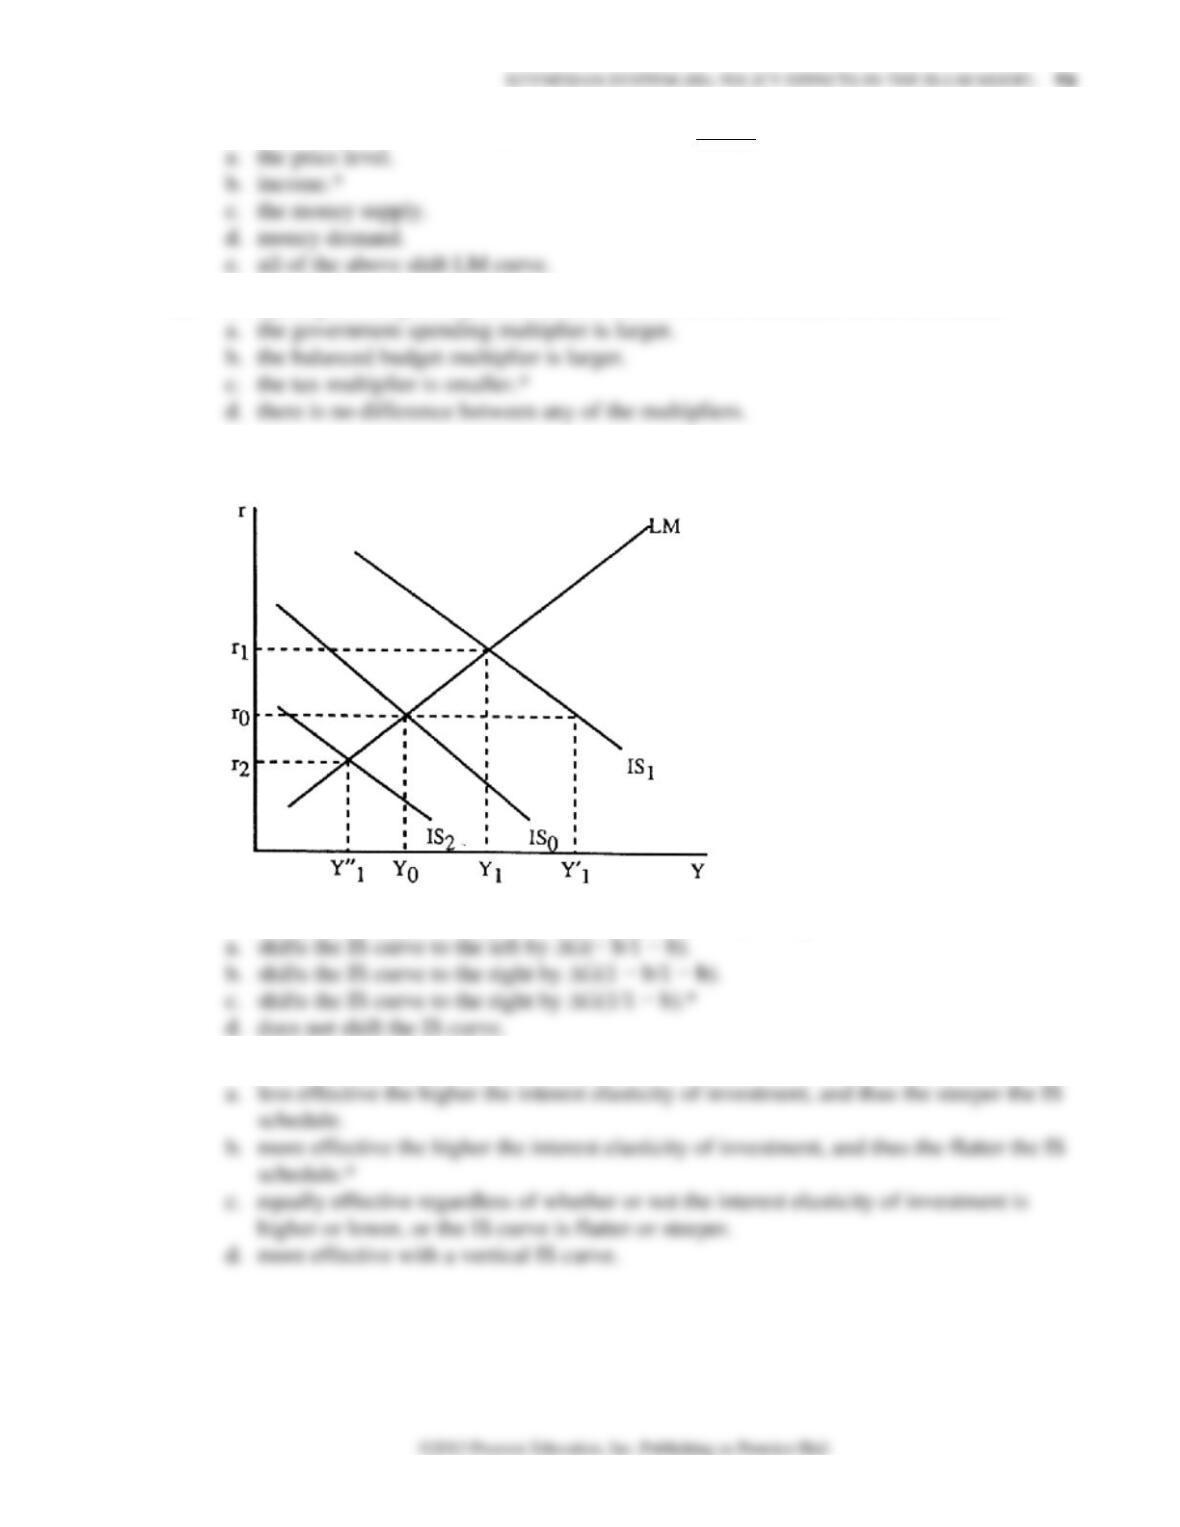
Figure 7-3
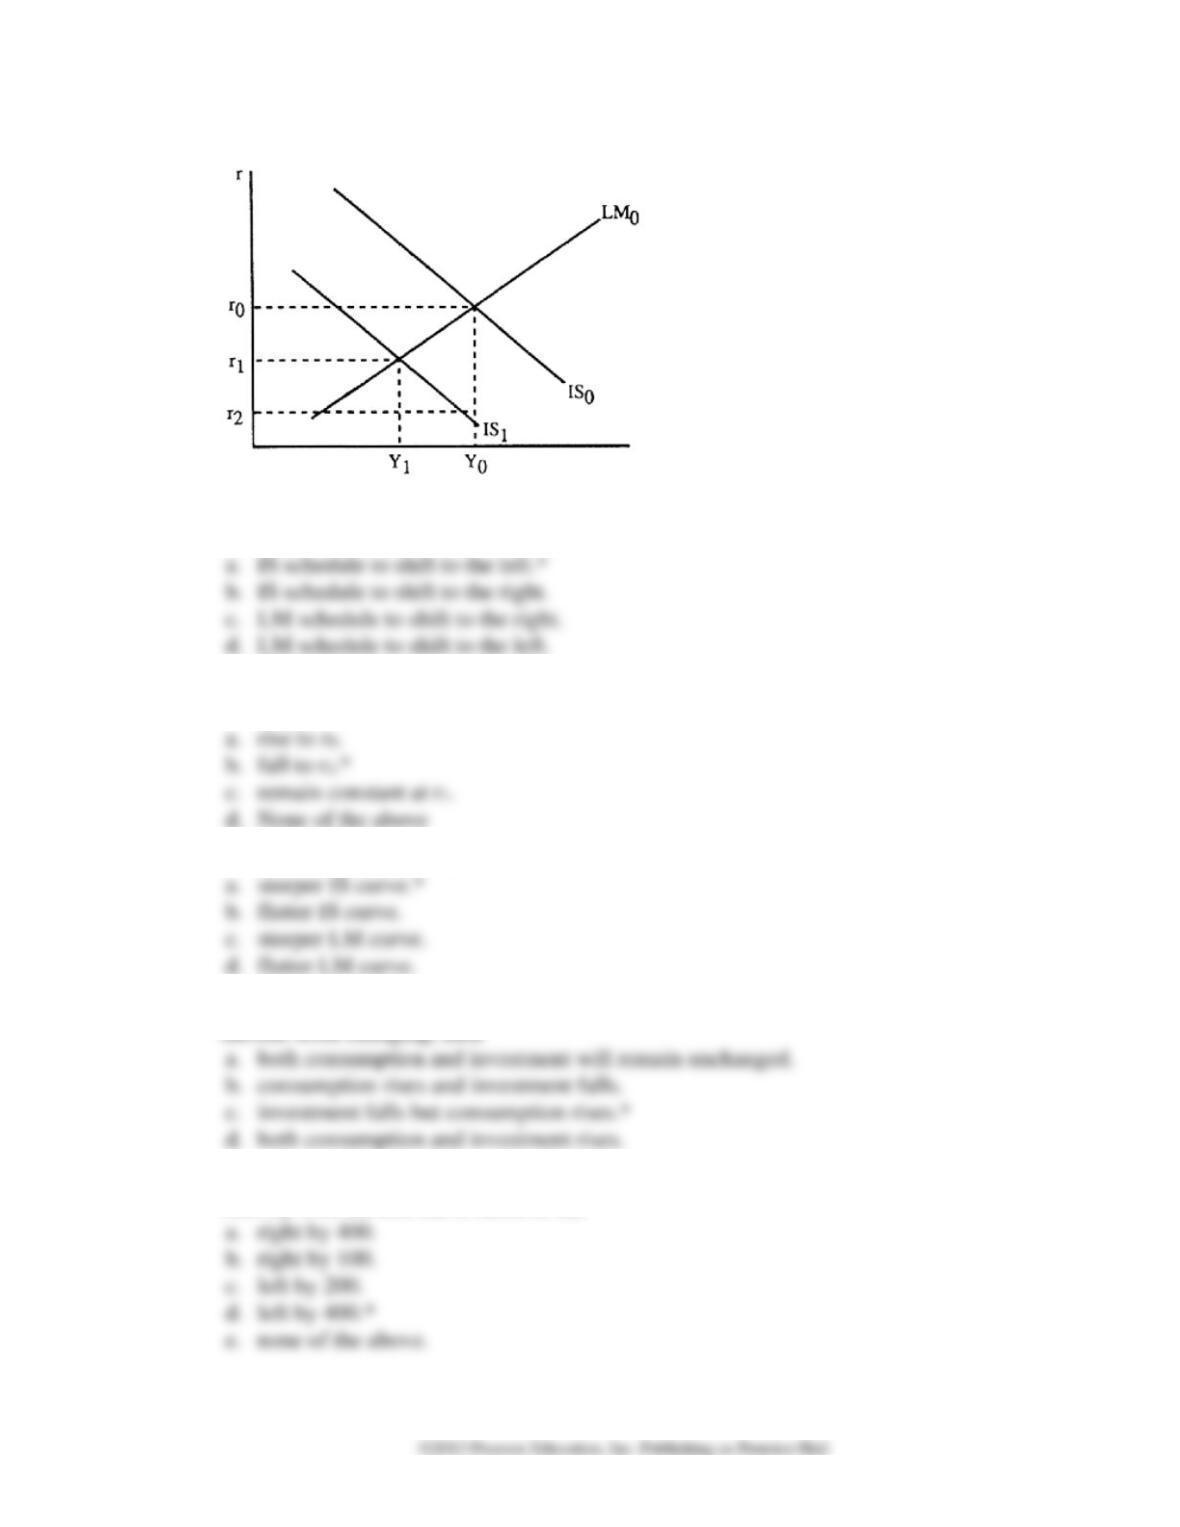
25. With respect to Figure 7-3, the horizontal distance by which the IS curve will shift with a
change in taxes is equal to
26. In the case where the LM schedule is relatively steep and the IS schedule is relatively flat,
the most effective policy would be a change in
27. Exogenous variables in the IS-LM model variables are
KEYNESIAN SYSTEM (III): POLICY EFFECTS IN THE IS-LM MODEL 75
Figure 7-4
28. As shown in Figure 7-4, an autonomous decline in expectations of future profitability
causes the
29. As shown in Figure 7-4, for income to be unchanged when there is an autonomous decline
in investment, the interest rate would have to
30. A lower interest elasticity of investment demand leads to a
31. If government spending rises but the central bank changes the money supply to prevent
income from changing, then
32. If the demand for money is Md = 100 +.25Y – 100r and then the increase in money demand
rises by 100, the LM curve shifts to the
33. Those economists who believe that monetary policy is more powerful than fiscal policy
argue that the
34. If the government raised taxes and reduced government spending in order to reduce the
budget deficit, monetary policy could accommodate this policy by
35. The slope of the LM curve has been shown to depend most crucially on the interest
elasticity of
36. If consumption is given by C = 300 + .6 (Y-T) and I = 300 – 40r, the IS curve is
37. An increase in the marginal propensity to hold money
38. Suppose that the government wants to increase income without changing the interest rate.
How can they accomplish this?
39. In the IS-LM model, an increase in government spending in the goods market has an impact
on the money market because
40. If the government wanted to reduce interest rates without changing output, it should
41. According to the modern Keynesian view,
42. If the level of government spending rises and simultaneously there is a fall in the money
stock, we definitely know that
43. A liquidity trap occurs when the
44. Traditional Keynesians tend to favor
45. Whenever fiscal policy actions, such as income tax cuts, are utilized to expand the
economy, the Keynesians prefer
46. In Japan, interest rates are close to zero. As a result, Keynesians would argue that money
demand
47. The effect on the level of income of a given increase in the money stock is
48. In the simple Keynesian model, government spending
49. If interest rates fall without any corresponding change in income, then it is possible
according to the IS-LM model that
50. The simple Keynesian model
51. If the central bank increases the money supply at the same time as government spending
increases, then:
52. During Japan’s economic slump in the early 1990s, monetary policy:
53. In the IS-LM model, if interest rates fall while output falls the
54. Changes in all of the following shift the IS curve except
55. If income falls without any change in interest rates, then according to the IS-LM model it


