CHAPTER 7—PRODUCTION ANALYSIS AND
COMPENSATION POLICY Key
1. The production function Q = 0.25X0.5Y exhibits:
2. The law of diminishing returns:
3. A new production function results following:
4. The relation between output and the variation in all inputs taken together is the:
5. When PX = $60, MPX = 5 and MPY = 2, relative employment levels are optimal provided:
6. When PX = $100, MPX = 10 and MRQ = $5, the marginal revenue product of X equals:
7. The returns to scale characteristic of a production system:
8. Returns to a factor denotes the relation between the quantity of an individual input employed and the:
9. The marginal product concept is:
10. A production function describes the relation between output and:
11. Total product divided by the number of units of variable input employed equals:
12. Marginal product is the change in output associated with a unit change in:
13. When the slope of the average product curve equals zero:
14. Total output is maximized when:
15. An isoquant represents:
16. Right-angle shaped isoquants reflect inputs that are:
17. The marginal rate of technical substitution is:

18. Marginal revenue product equals:
19. A firm will maximize profits by employing the quantity of each input where the marginal:
20. If tripling the quantities of all inputs employed doubles the quantity of output produced, the output
elasticity:
21. The maximum output that can be produced for a given amount of input is called a:
22. The output effect of a proportional increase in all inputs is called:
23. As the quantity of a variable input increases, the resulting rate of output increase eventually:

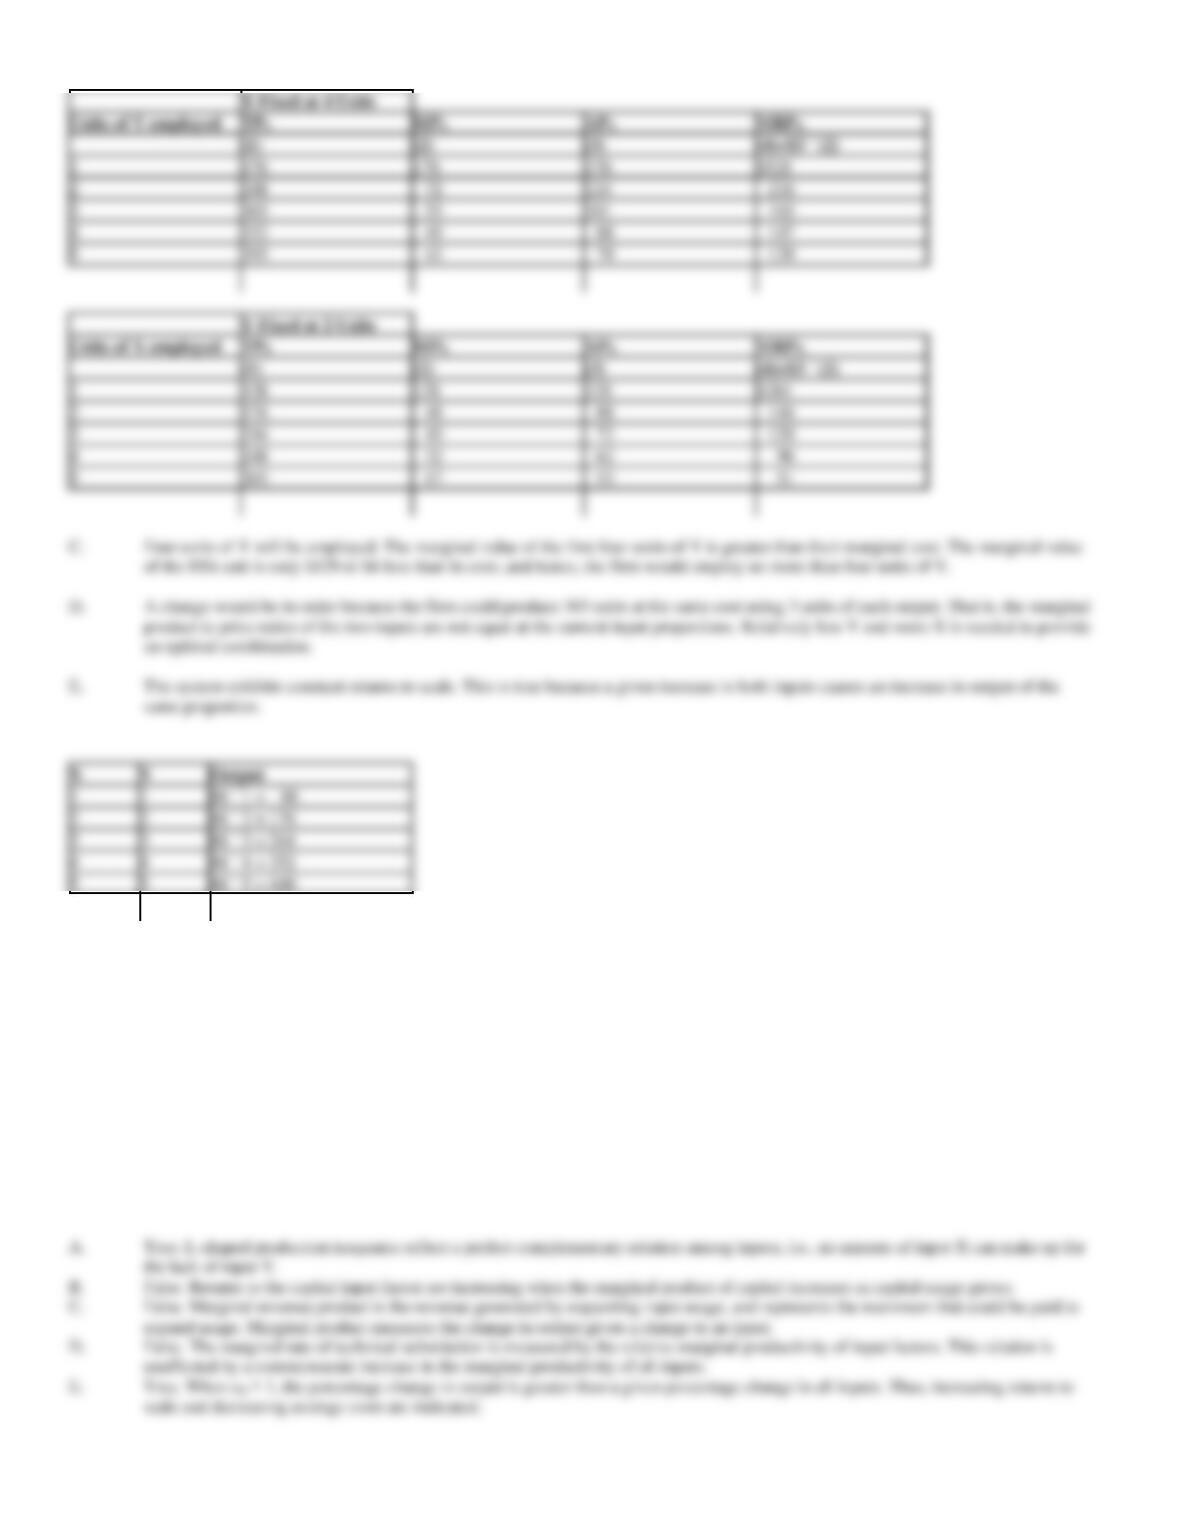
24. Economic efficiency is achieved when all firms equate the marginal:
25. When MRQ = $25, PX = $200, and MPX = 8, employment of X:
26. Input Combination. The following production table provides estimates of the maximum amounts of output
possible with different combinations of two input factors, X and Y. (Assume that these are just illustrative
points on a spectrum of continuous input combinations.)
Units of Y Used
Estimated Output per
Day
5
258
360
455
542
620
4
234
332
416
496
542
3
206
294
372
416
455
2
168
248
294
332
360
1
124
168
206
234
258
1
2
3
4
5
Units of X Used
A.
Do the two inputs exhibit the characteristics of constant, increasing, or decreasing marginal rates of technical substitution? How do you
know?
B.
Assuming output sells for $4 per unit, complete the following tables:
X Fixed at 2 Units
Units of Y Used
Total Product of Y
Marginal Product of Y
Average Product of Y
Marginal Revenue
Product of Y
1
2
3
4
5
Fixed at 3 units
Units of X Used
Total Product of X
Marginal Product of X
Average Product of X
Marginal Revenue
Product of X
1
2
3
4
5
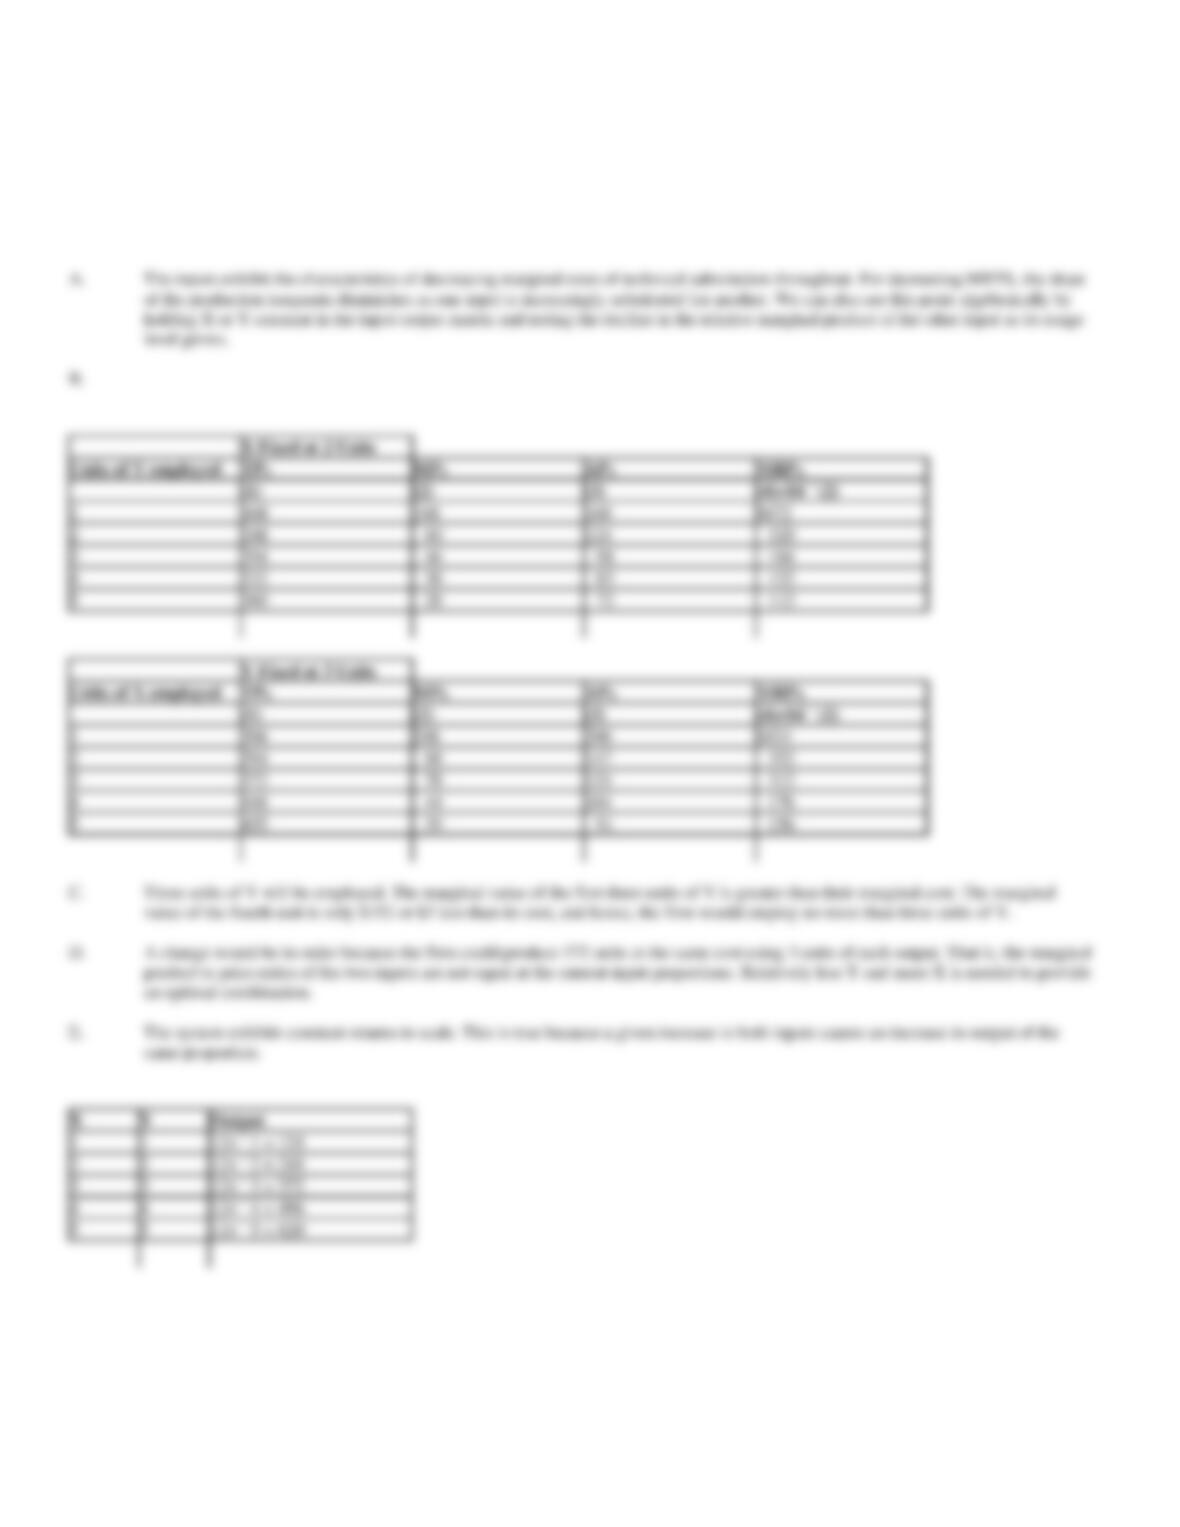
C.
Assume the quantity of X is fixed at 2 units. If the output of the production system sells for $4 and the cost of Y is $155 per day, how
many units of Y will be employed?
D.
Assume that the company is currently producing 258 units of output per day using 1 unit of X and 5 units of Y. The daily cost per unit
of X is $155 and that of Y is also $155. Would you recommend a change in the present input combination? Why or why not?
E.
What is the nature of the returns to scale for this production system if the optimal input combination requires that X = Y?
level grows.
1
$672
2
80
320
4
38
83
152
2
88
352
3
78
312
4
44
176
5
39
91
156
C.
Three units of Y will be employed. The marginal value of the first three units of Y is greater than their marginal cost. The marginal
value of the fourth unit is only $152 or $3 less than its cost, and hence, the firm would employ no more than three units of Y.
The system exhibits constant returns to scale. This is true because a given increase in both inputs causes an increase in output of the
same proportion.
1
1
124 ´ 1 = 124
3
3
124 ´ 3 = 372
4
4
124 ´ 4 = 496
5
5
124 ´ 5 = 620

27. Input Combination. The following production table provides estimates of the maximum amounts of output
possible with different combinations of two input factors, X and Y. (Assume that these are just illustrative
points on a spectrum of continuous input combinations.)
Units of Y Used
Estimated Output per
Day
5
184
265
334
395
440
4
176
248
303
352
395
3
164
216
264
303
334
2
128
176
216
248
265
1
88
128
164
176
184
1
2
3
4
5
Units of X Used
Assuming output sells for $3 per unit, complete the following tables:
Units of Y Used
Total Product of Y
Marginal Product of Y
Average Product of Y
Marginal Revenue
Product of Y
1
2
3
4
5
Fixed at 2 units
1
2
3
4
5
What is the nature of the returns to scale for this production system if the optimal input combination requires that X = Y?
level grows.
28. Production Relations. Indicate whether each of the following statements is true or false.
A.
L-shaped isoquants describe production systems where inputs are perfect complements.
B.
If the marginal product of capital increases as capital usage grows, the returns to capital are decreasing.
C.
Marginal revenue product measures the output gained through expanding input usage.
D.
The marginal rate of technical substitution will be affected by a given percentage increase in the marginal productivity of all inputs.
E.
Increasing returns to scale and declining average costs are indicated when eQ > 1.
B.
False. Returns to the capital input factor are increasing when the marginal product of capital increases as capital usage grows.
1
$528
2
72
216
3
55
165
4
49
88
147
5
43
79
129
1
$384
2
48
88
144
3
40
72
120
4
32
62
96
5
17
53
51
1
1
2
2
3
3
4
4
5
5

29. Production Relations. Indicate whether each of the following statements is true or false.
A.
If the marginal product of capital decreases as capital usage grows, the returns to capital are decreasing.
B.
The marginal rate of technical substitution will be affected by a given percentage increase in the marginal productivity of an input.
C.
Marginal revenue product represents the minimum revenue amount required to expand usage.
D.
Linear isoquants describe production systems where inputs are perfect complements.
E.
Decreasing returns to scale and declining average costs are indicated when eQ < 1.
30. Returns to Scale. Determine whether the following production functions exhibit constant, increasing, or
decreasing returns to scale.
A.
Q = 0.25X + 5Y + 30Z
B.
Q = 4L + 15K + 600
C.
Q = 9A + 3B + 12AB
D.
Q = 4L2 + 6LK + 3K2
E.
Q = 2L0.2K0.6
A.
Initially, let X = Y = Z = 100, so output is:
Increasing all inputs by 4% leads to:
B.
Initially, let L = K = 100, so output is:
Increasing both inputs by 5% leads to
A.
True. Returns to the capital input factor are decreasing when the marginal product of capital decreases as capital usage grows.
31. Returns to Scale. Determine whether the following production functions exhibit constant, increasing, or
decreasing returns to scale.
A.
Q = 25X + 0.5Y + 8Z
B.
Q = 9L + 5K – 400
C.
Q = 10A + 7B + 4AB
D.
Q = 6L2 + 3LK + 2K2
E.
Q = 2L0.4K0.6
A.
Initially, let X = Y = Z = 100, so output is:
Increasing all inputs by 4% leads to:
C.
Initially, let A = B = 100, so output is:
Increasing both inputs by 1% leads to:
D.
Initially, let L = K = 100, so output is:
Increasing both inputs by 2% leads to:
E.
Initially, let L = K = 100, so output is:
Increasing both inputs by 4% leads to:
32. Returns to Scale. Determine whether the following production functions exhibit constant, increasing, or
decreasing returns to scale.
A.
Q = 2X + 25Y + 5Z
B.
Q = 3A + 5B – 200
C.
Q = 5A + 6B + 3AB
D.
Q = 4L2 – 3LK + 2K2
E.
Q = 4L0.4K0.8
B.
Initially, let L = K = 100, so output is:
Increasing both inputs by 5% leads to
C.
Initially, let A = B = 100, so output is:
Increasing both inputs by 1% leads to:
D.
Initially, let L = K = 100, so output is:
Increasing both inputs by 2% leads to:
E.
Initially, let L = K = 100, so output is:
Increasing both inputs by 4% leads to:
33. Returns to Scale. Determine whether the following production functions exhibit constant, increasing, or
decreasing returns to scale.
A.
Q = 10X + 4Y + 0.25Z
B.
Q = 12L + 5K + 500
C.
Q = 4A + 14B + 3AB
D.
Q = 5L2 + 5LK + 5K2
E.
Q = 3L0.3K0.4
A.
Initially, let X = Y = Z = 100, so output is:
Increasing all inputs by 4% leads to:
B.
Initially, let L = K = 100, so output is:
Increasing both inputs by 5% leads to
C.
Initially, let A = B = 100, so output is:
Increasing both inputs by 1% leads to:
D.
Initially, let L = K = 100, so output is:
Increasing both inputs by 2% leads to:

34. Optimal Input Mix. Rachel Green, owner-manager of the Manhattan-based Central Perk Coffee Shop, is
reviewing the company’s compensation plan. Currently, the company pays its three experienced management
staff members salaries based on the number of years of service. Chandler Bing, a new management trainee, is
paid a more modest salary. Monthly sales and salary data for each employee are as follows:
Sales Staff
Average Monthly
Sales
Monthly Salary
Monica Geller
$200,000
$12,000
Phoebe Buffay
150,000
9,750
Joey Tribbian
120,000
6,750
Chandler Bing
90,000
4,500
Bing in particular has shown great promise during the past year, and Green believes a substantial raise is clearly justified. At the same time, some
adjustment to the compensation paid other sales personnel would also seem appropriate. Green is considering changing from the current
compensation plan to one based on a 9% commission. Green sees such a plan as fairer to the parties involved and believes it would also provide
strong incentives for needed market expansion.
A.
Calculate Central Perk’s salary expense for each employee expressed as a percentage of sales generated by that individual.
B.
Calculate monthly income for each employee under a 9% commission-based system.
C.
Will a commission-based plan result in efficient relative salaries, efficient salary levels, or both?
Monica Geller
$200,000
$12,000
6.00%
Phoebe Buffay
150,000
9,750
6.50%
Joey Tribbian
120,000
6,750
5.63%
Chandler Bing
90,000
4,500
5.00%
Monica Geller
$200,000
$18,000
Initially, let L = K = 100, so output is:
Increasing both inputs by 4% leads to:

35. Optimal Input Mix. Puerto Rico-based Chocolate Products, Inc., manufactures and distributes a distinctive
line of hand-packed candies. Lucy Ricardo president of Chocolate is reviewing the company’s sales-force
compensation plan. Currently, the company pays its three experienced sales staff members salaries based on the
number of years of service. Matty Trumbull, a new sales trainee, is paid a more modest salary. Monthly sales
and salary data for each employee are as follows:
Sales Staff
Average Monthly
Sales
Monthly Salary
Ethel Mertz
$300,000
$9,000
Caroline Appleby
450,000
14,000
Ralph Ramsey
520,000
15,000
Matty Trumbull
390,000
8,000
Trumbull in particular has shown great promise during the past year, and Ricardo believes a substantial raise is clearly justified. At the same time,
some adjustment to the compensation paid other sales personnel would also seem appropriate. Ricardo is considering changing from the current
compensation plan to one based on a 3.5% commission. Ricardo sees such a plan as fairer to the parties involved and believes it would also provide
strong incentives for needed market expansion.
A.
Calculate Chocolate’s salary expense for each employee expressed as a percentage of the sales generated by that individual.
B.
Calculate monthly income for each employee under a 3.5% commission-based system.
C.
Will a commission-based plan result in efficient relative salaries, efficient salary levels, or both?
Ethel Mertz
$300,000
$9,000
3.0%
Caroline Appleby
450,000
14,000
3.1%
Matty Trumbull
390,000
8,000
2.1%
B.
Sales Staff
Average Monthly Sales
3.5%
Commission

36. Optimal Input Mix. Salem-based Horton & Brady, Inc., is a small firm offering a wide variety of stock
brokerage and financial services to high net worth individuals. Mickey Horton, president of Horton & Brady is
reviewing the company’s compensation plan. Currently, the company pays its three experienced financial
advisors a salary based on the number of years of service. Nicole Walker, a new sales trainee, is paid a more
modest salary. Sales and salary data for each employee are as follows:
Financial Advisors
Commissions and Fees Generated
Salary
Hope Williams-Brady
$3.2 million
$185,000
Austin Reed
2.8 million
112,000
Sami Brady
1.6 million
56,000
Nicole Walker
1.2 million
48,000
Walker in particular has shown great promise during the past year, and Horton believes a substantial raise is clearly justified. At the same time, some
adjustment to the compensation paid other sales personnel would also seem appropriate. Horton is considering changing from the current
compensation plan to one based on a 5% commission. Horton sees such a plan as fairer to the parties involved and believes it would also provide
strong incentives for needed market expansion.
A.
Calculate Horton & Brady’s salary expense for each employee expressed as a percentage of the commissions and fees generated by that
individual.
B.
Calculate income for each employee under a 5% commission-based system.
C.
Will a commission-based plan result in efficient relative salaries, efficient salary levels, or both?
Sales Staff
Annual Sales
Salary
Salary Percentage of Sales
(4) = (3) (2)
Hope Williams-Brady
$3,200,000
$185,000
5.78%
Austin Reed
2,800,000
112,000
4.00%
Nicole Walker
1,200,000
48,000
3.33%
B.
Sales Staff
Annual Sales
5% Commission
(1)
(2)
(3) = (2) ´ 0.05
Hope Williams-Brady
$3,200,000
$160,000
Nicole Walker
1,200,000
60,000

37. Optimal Input Mix. Brisco, Van Buren & Associates is a New York City based law firm. Anita van Buren,
managing partner of Brisco, Van Buren is reviewing the firm’s compensation plan. Currently, the firm pays its
staff attorneys salaries based upon the number of years of service. The value of billable hours generated by each
staff attorney during the past year are as follows:
Staff
Billings
Salary
Ed Green
$5 million
$250,000
Serena Southerlyn
3.5 million
157,500
Jack McCoy
2 million
80,000
Nora Lewin
1.6 million
72,000
Van Buren believes some adjustment to the compensation paid all staff members would be appropriate. Van Buren is considering changing from the
current compensation plan to one whereby each staff member would be paid a salary equal to 10% of client billings (gross revenue generated). Van
Buren sees such a plan as fairer to the parties involved and believes it would also provide strong incentives for needed client development.
A.
Calculate Brisco, Van Buren’s salary expense for each employee expressed as a percentage of the client billings generated by that
individual.
B.
Calculate income for each employee under a 10% commission-based system.
C.
Will a commission-based plan result in efficient relative salaries, efficient salary levels, or both?
Staff
Billings
Salary
Salary Percentage of Sales
(4) = (3) (2)
Ed Green
$5,000,000
$250,000
5.0%
Serena Southerlyn
3,500,000
157,500
4.5%
Jack McCoy
2,000,000
80,000
4.0%
Nora Lewin
1,600,000
72,000
4.5%
B.
Staff
Billings
10% Commission
Ed Green
$5,000,000
$500,000
Serena Southerlyn
3,500,000
350,000
Jack McCoy
2,000,000
200,000
commission-based plan. However, if net marginal revenues are different than this rate, some adjustment in the commission rate would