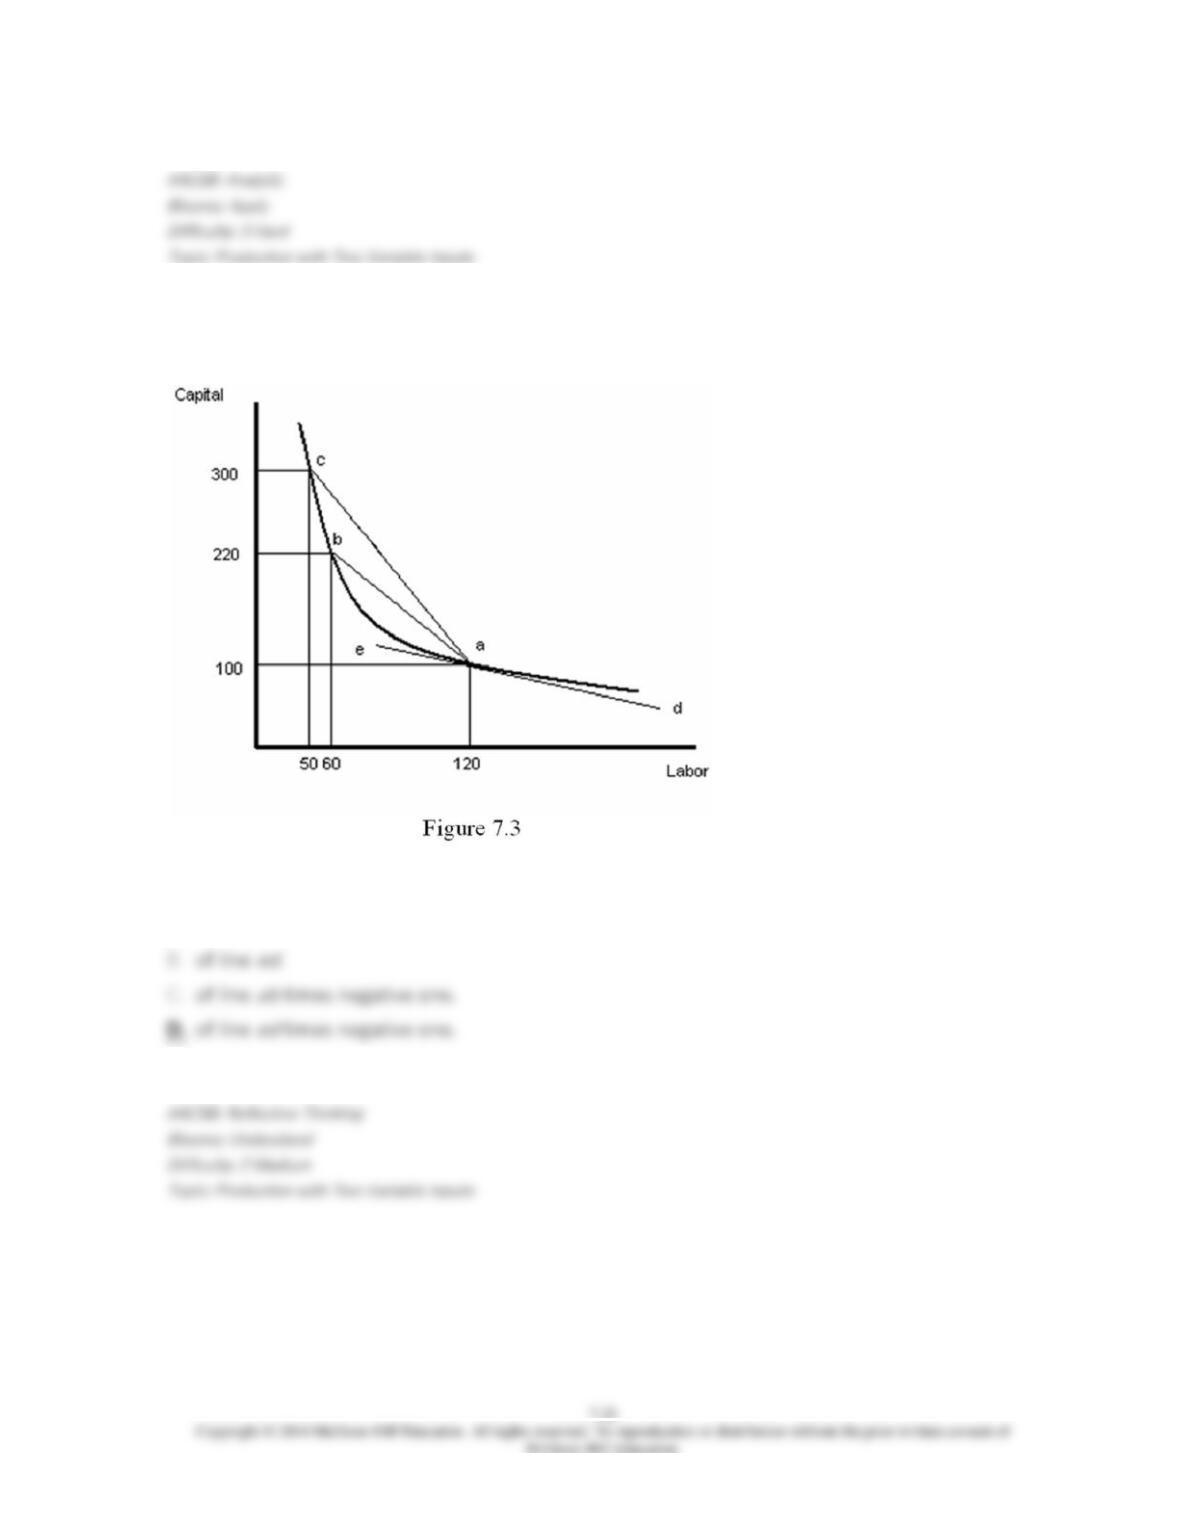
40. Refer to Figure 7.3. The marginal rate of technical substitution for labor with capital at 120
workers is represented by the slope:
A. of line
ac
.
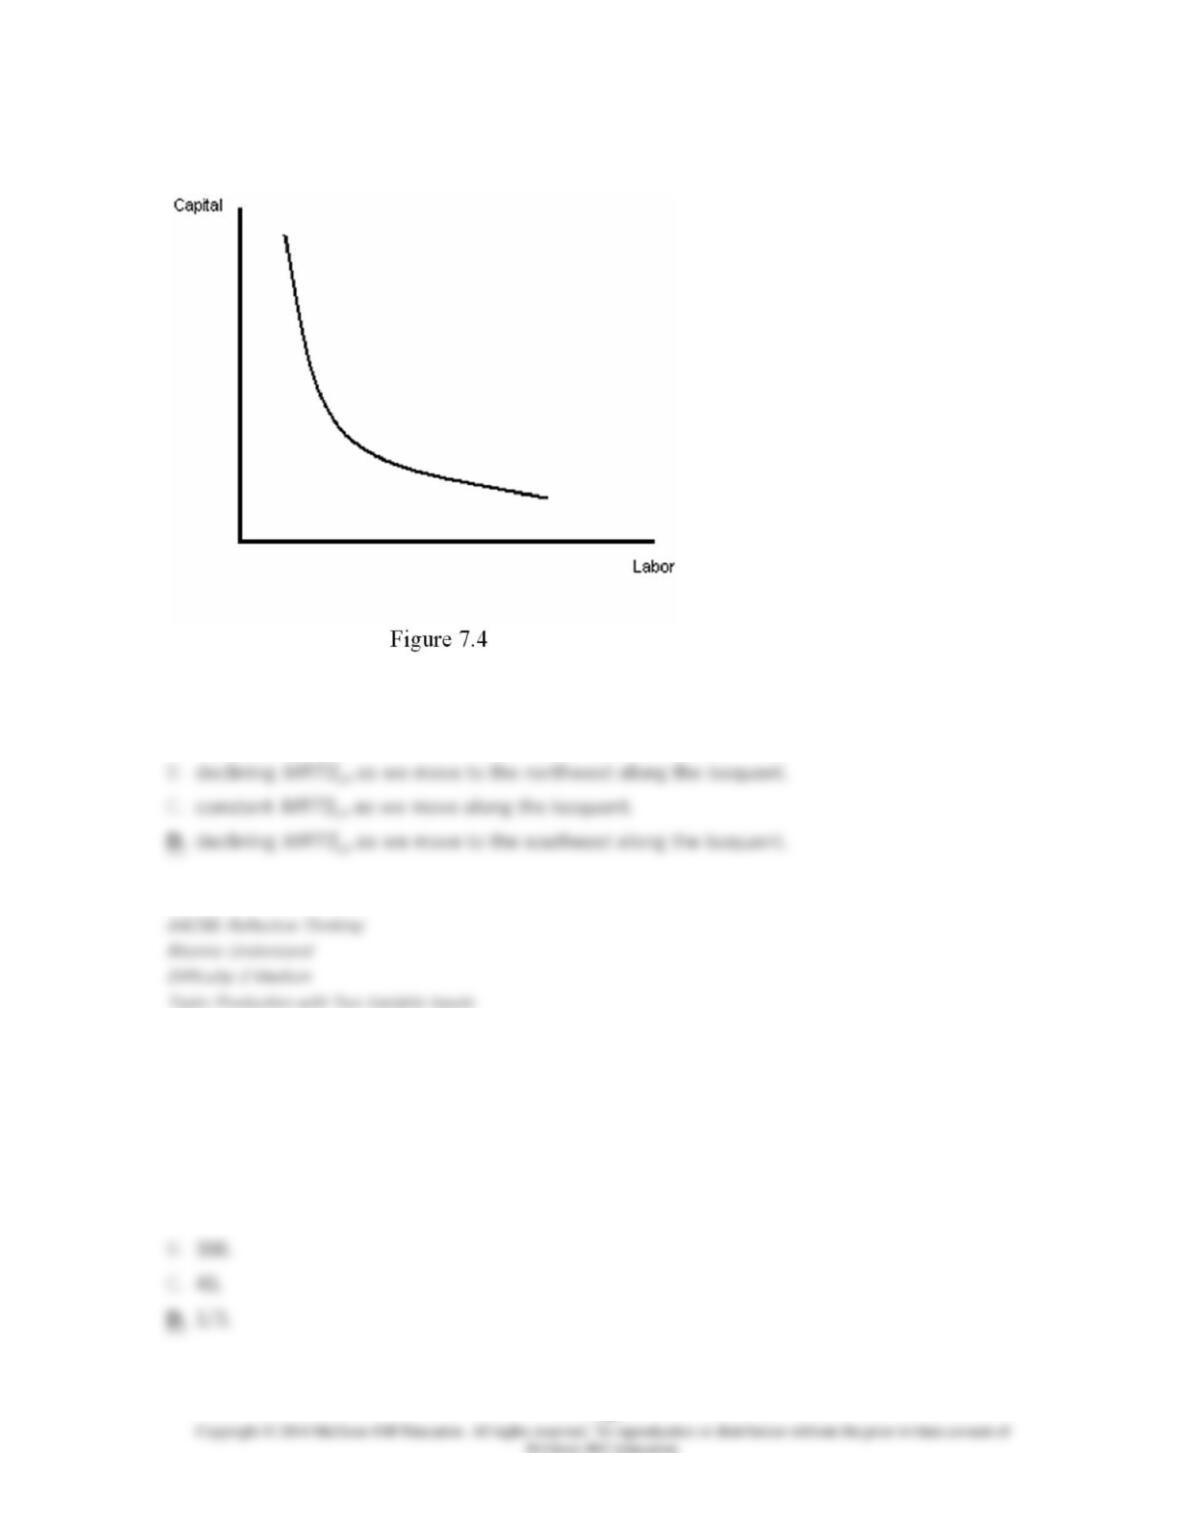
41. Refer to Figure 7.4. This isoquant exhibits:
A. increasing
MRTSLK
as we move to the southeast along the isoquant.
42. Suppose that the marginal product of a firm’s labor is 10 units of output per hour. Also
assume that the marginal product of the firm’s capital is 30 units of output per hour. In this case,
the marginal rate of technical substitution for labor with capital is:
A. 3.
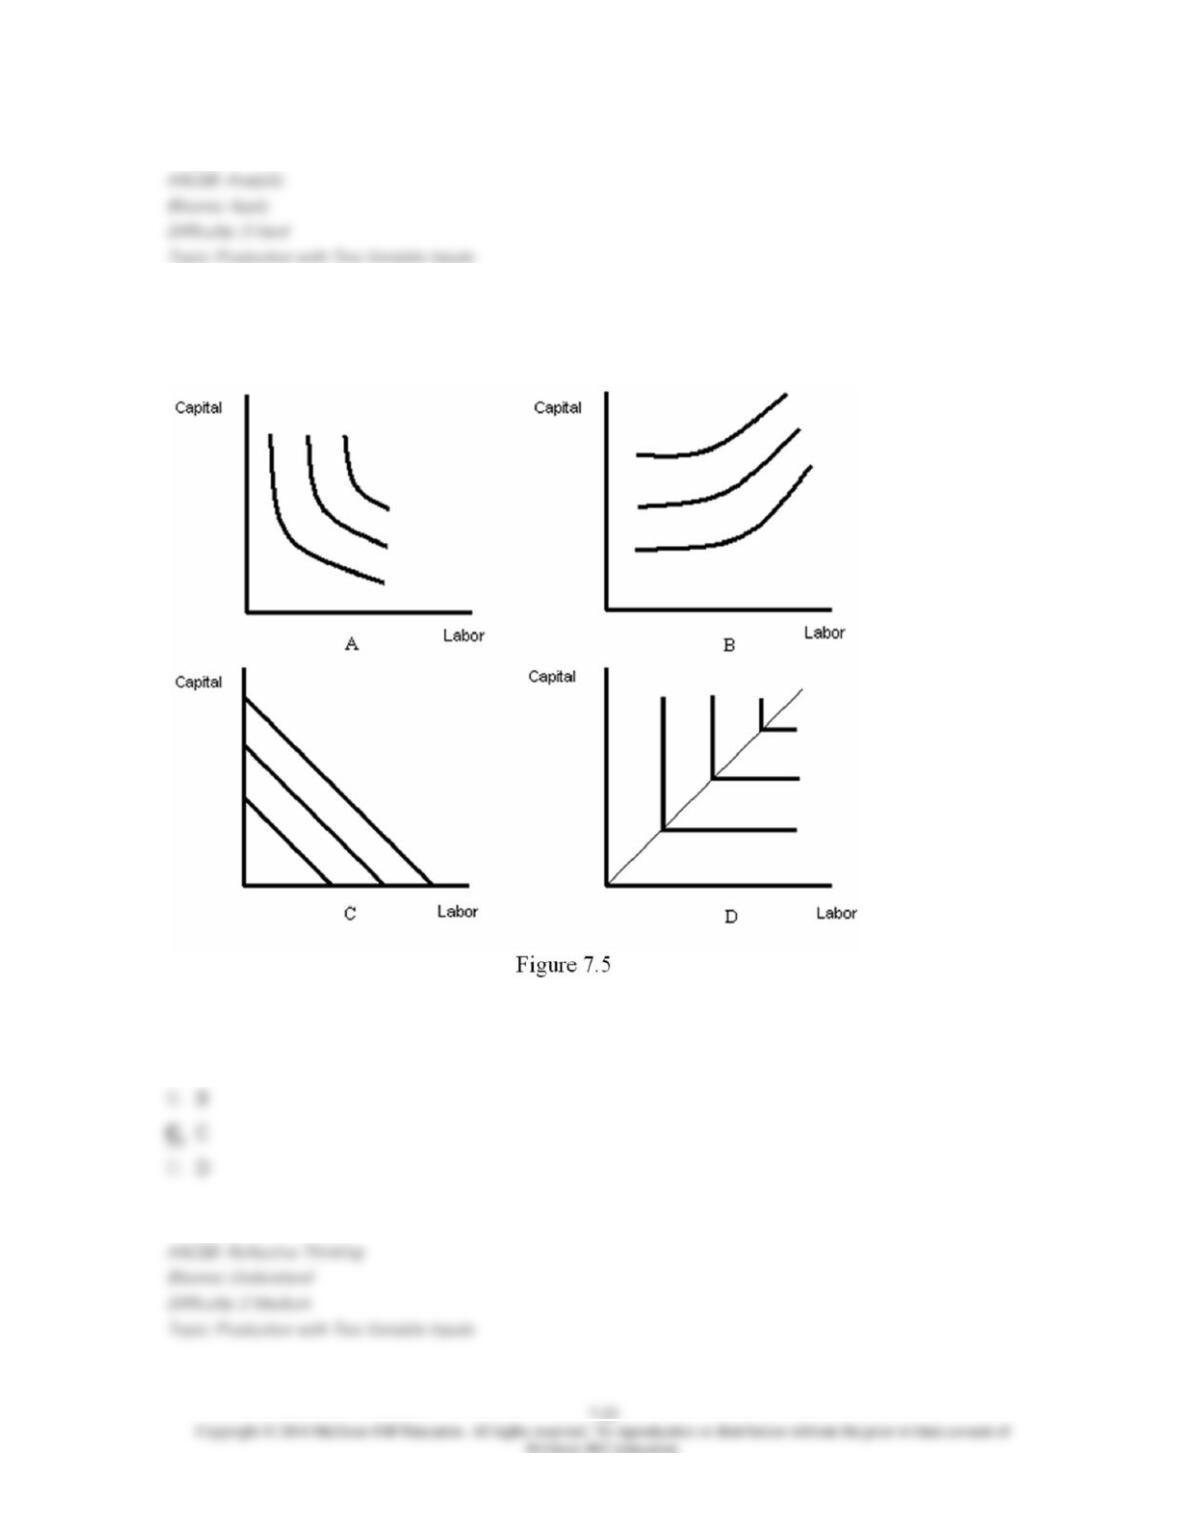
43. Refer to Figure 7.5. Which diagram represents isoquants for inputs that are perfect
substitutes?
A. A
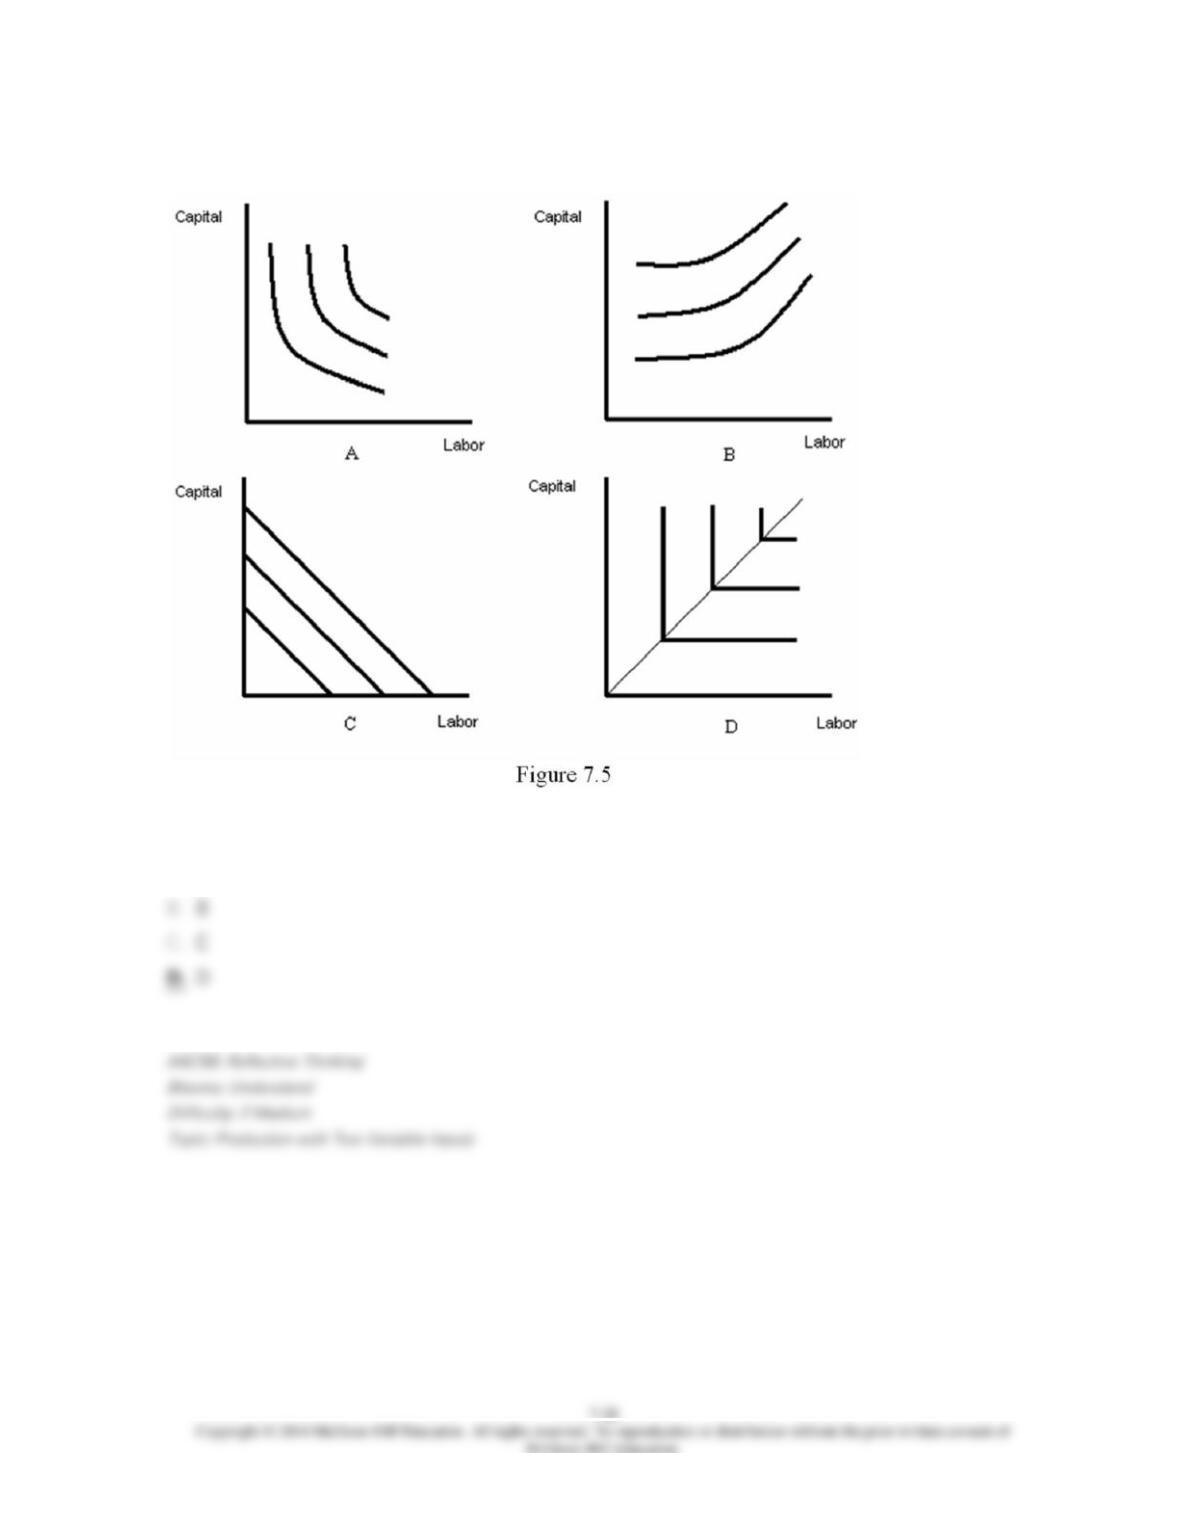
44. Refer to Figure 7.5. Which diagram represents isoquants for fixed-proportions technology?
A. A
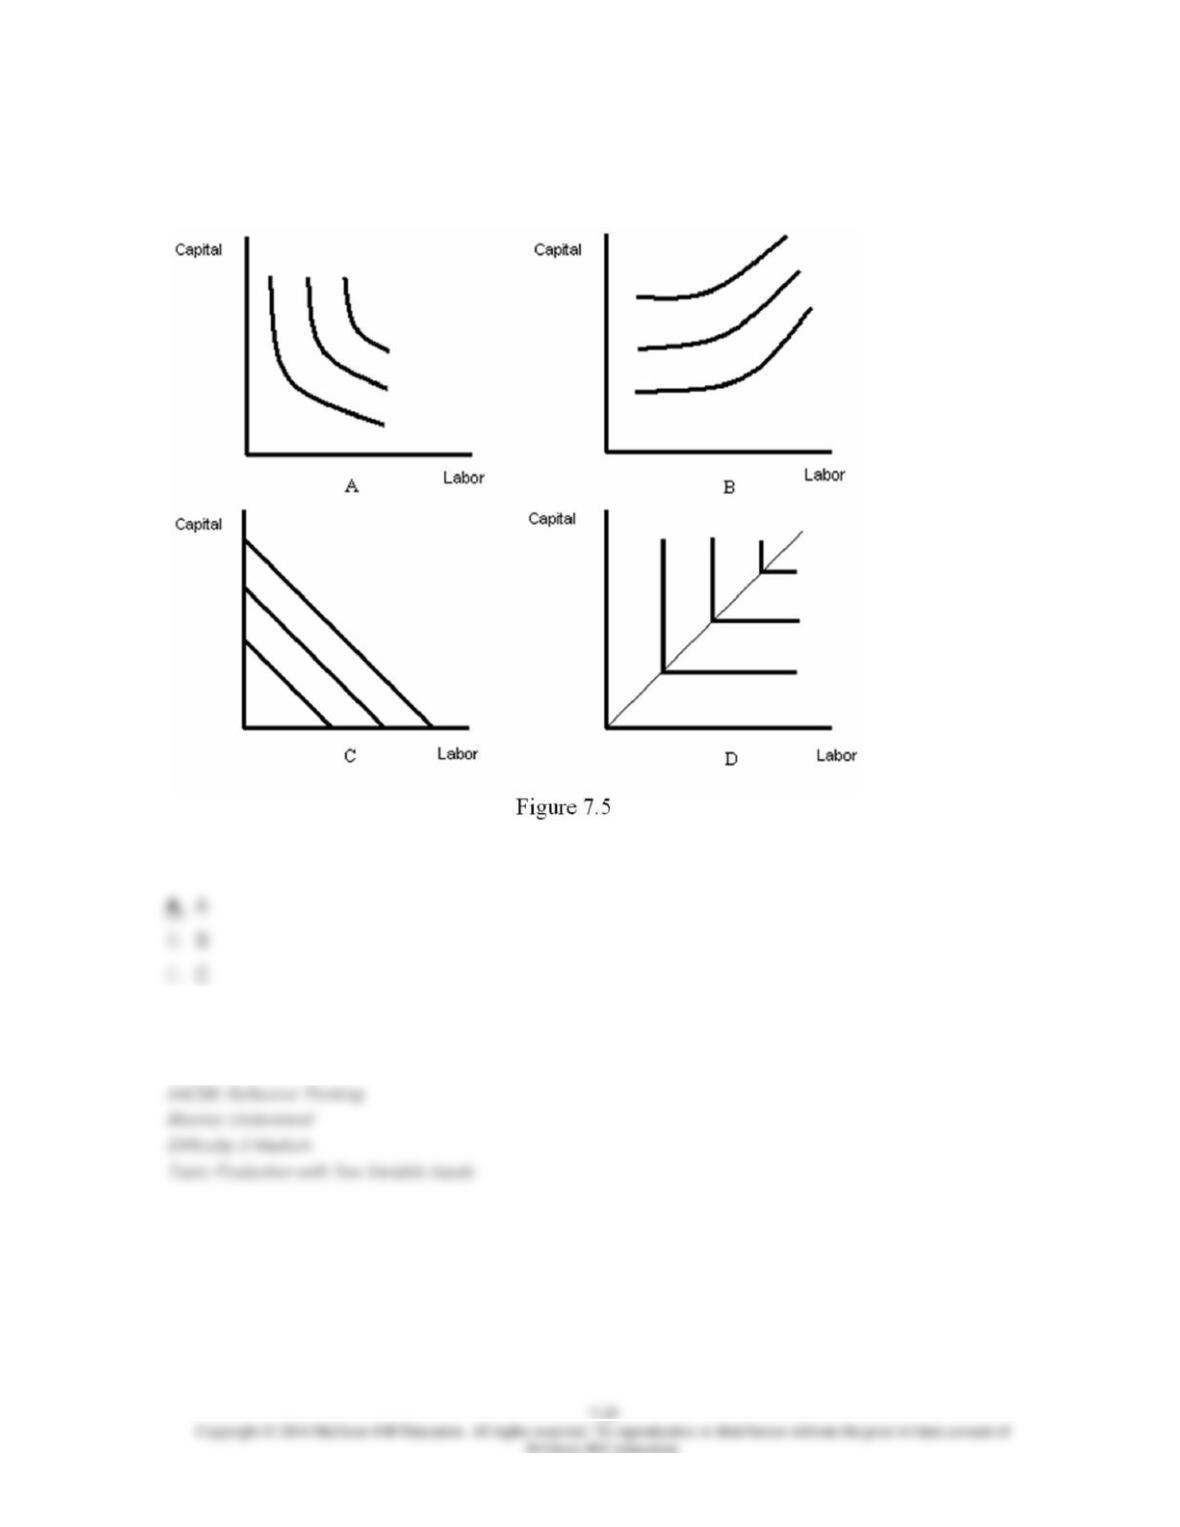
45. Refer to Figure 7.5. Which diagram represents isoquants for a Cobb-Douglas production
function?
D. D
46. Two inputs ______ when they must be combined in a fixed ratio.
D. are fixed inputs
47. Consider the Cobb-Douglas production function
F
(
L,K
) =
AL
α
K
β. Which of the following
statements is true?
D. Changes in α will not affect
MRTSLK
.
48. Returns to scale is a ______ concept because ______.
A. short-run; it’s related to the law of diminishing marginal returns
49. A firm has increasing returns to scale if:
D. an increase in capital leads to an increase in output.
50. Suppose a firm uses only capital and labor to produce output. When the firm doubles the
amount of both inputs, output increases by less than double. This firm exhibits:
D. diminishing marginal returns.
51. Suppose a firm uses 200 units of capital and 1,000 workers to produce 10,000 units of
output. When the firm employs 3,000 workers and uses 600 units of capital, output increases to
45,000 units. This firm exhibits:
D. diminishing marginal returns.
52. The Cobb-Douglas production function
F
(
L,K
) =
AL
α
K
β will exhibit decreasing returns to
scale when:
D. α + β = 0.
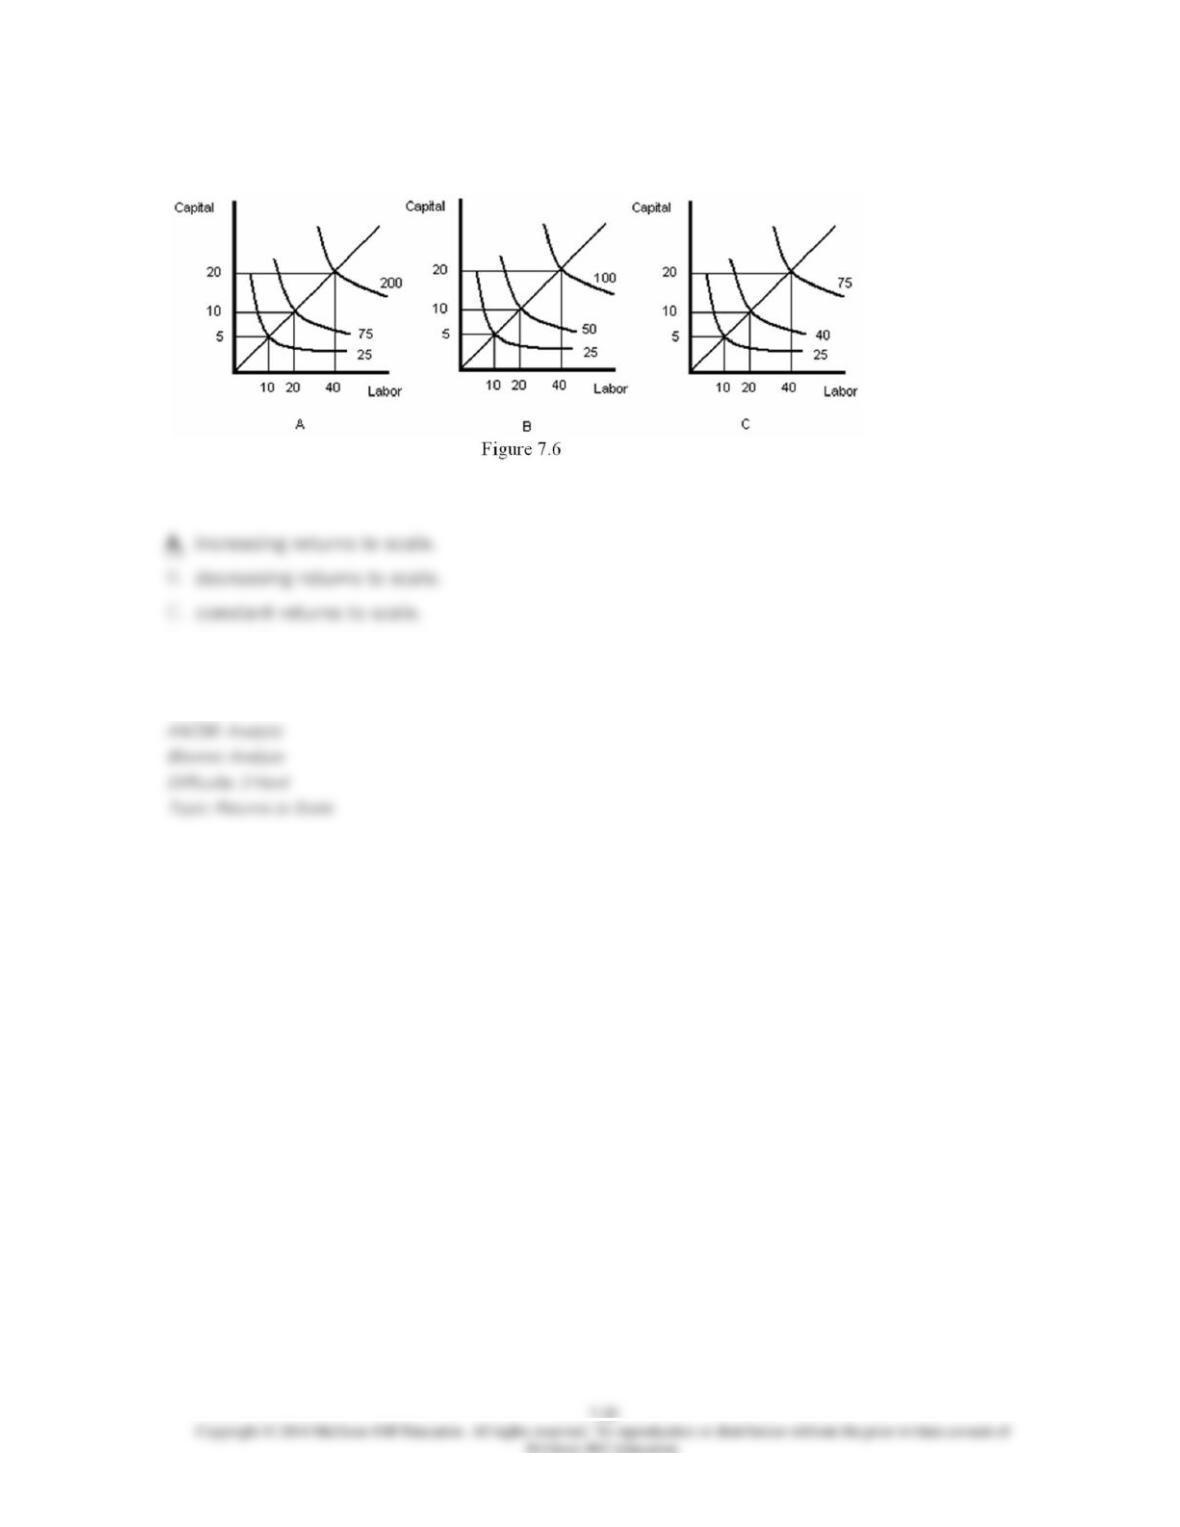
53. Refer to Figure 7.6. Graph A represents:
D. diminishing marginal returns.
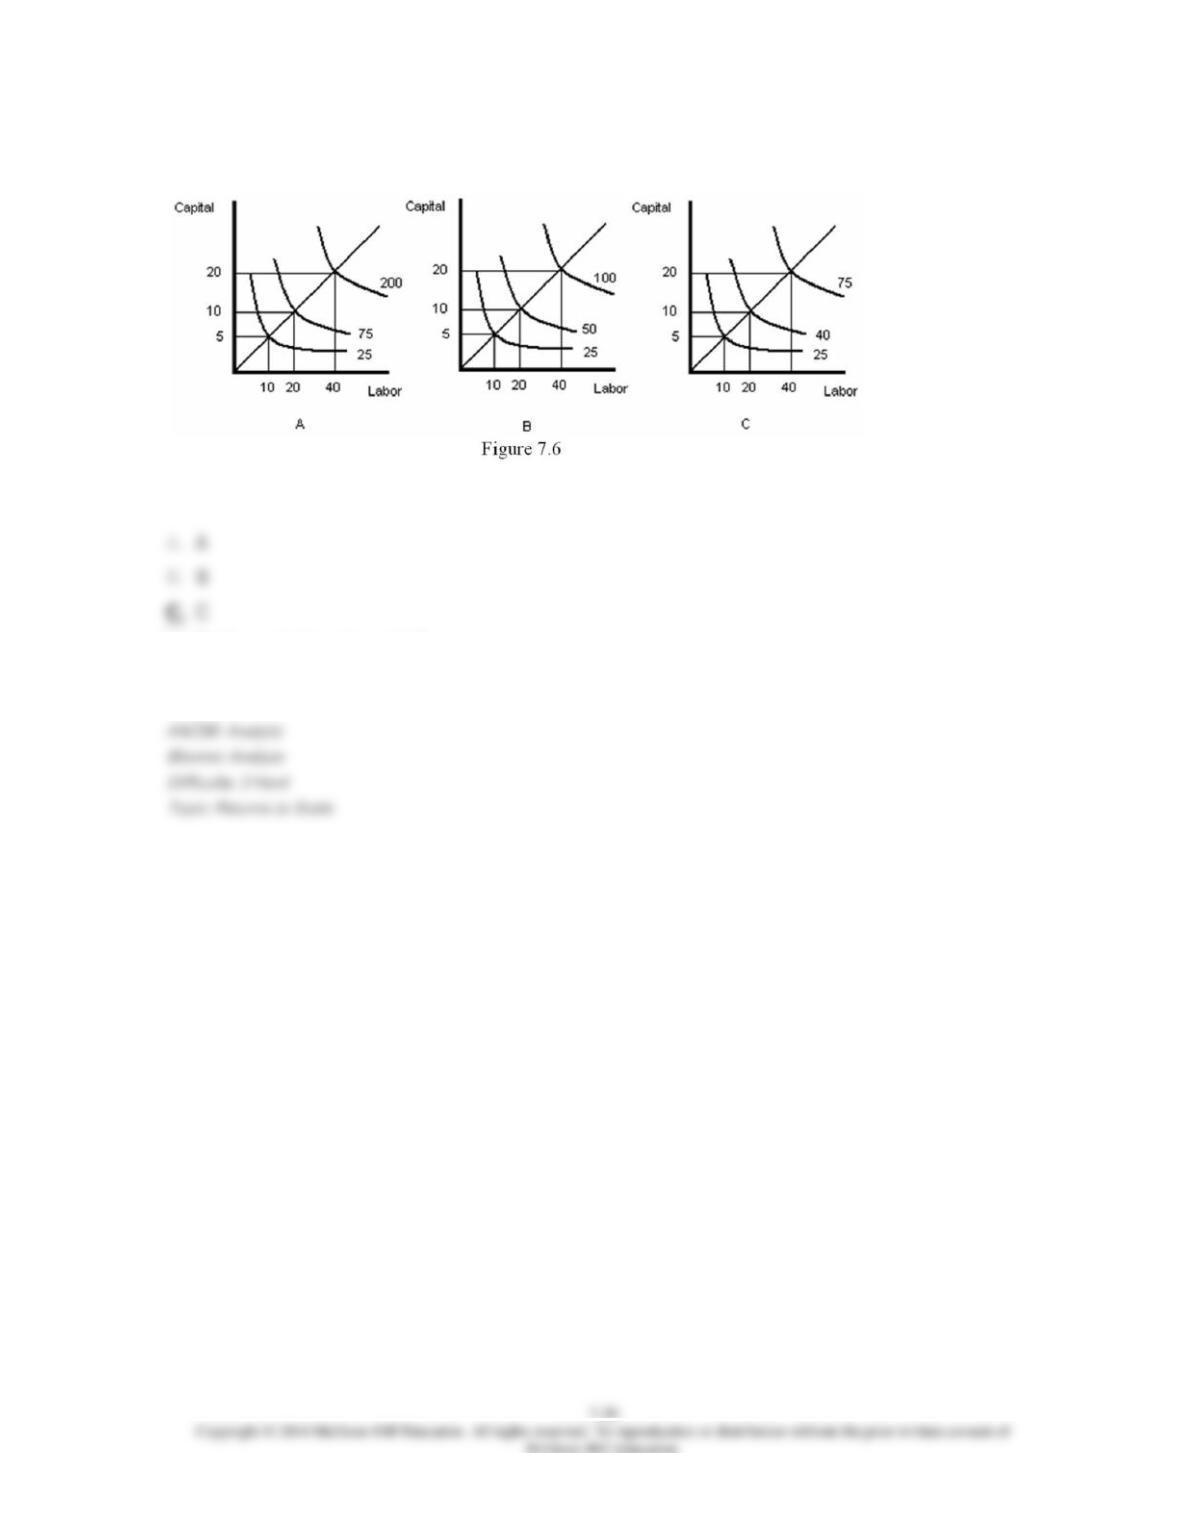
54. Refer to Figure 7.6. Which graph represents decreasing returns to scale?
D. Both graph A and graph C
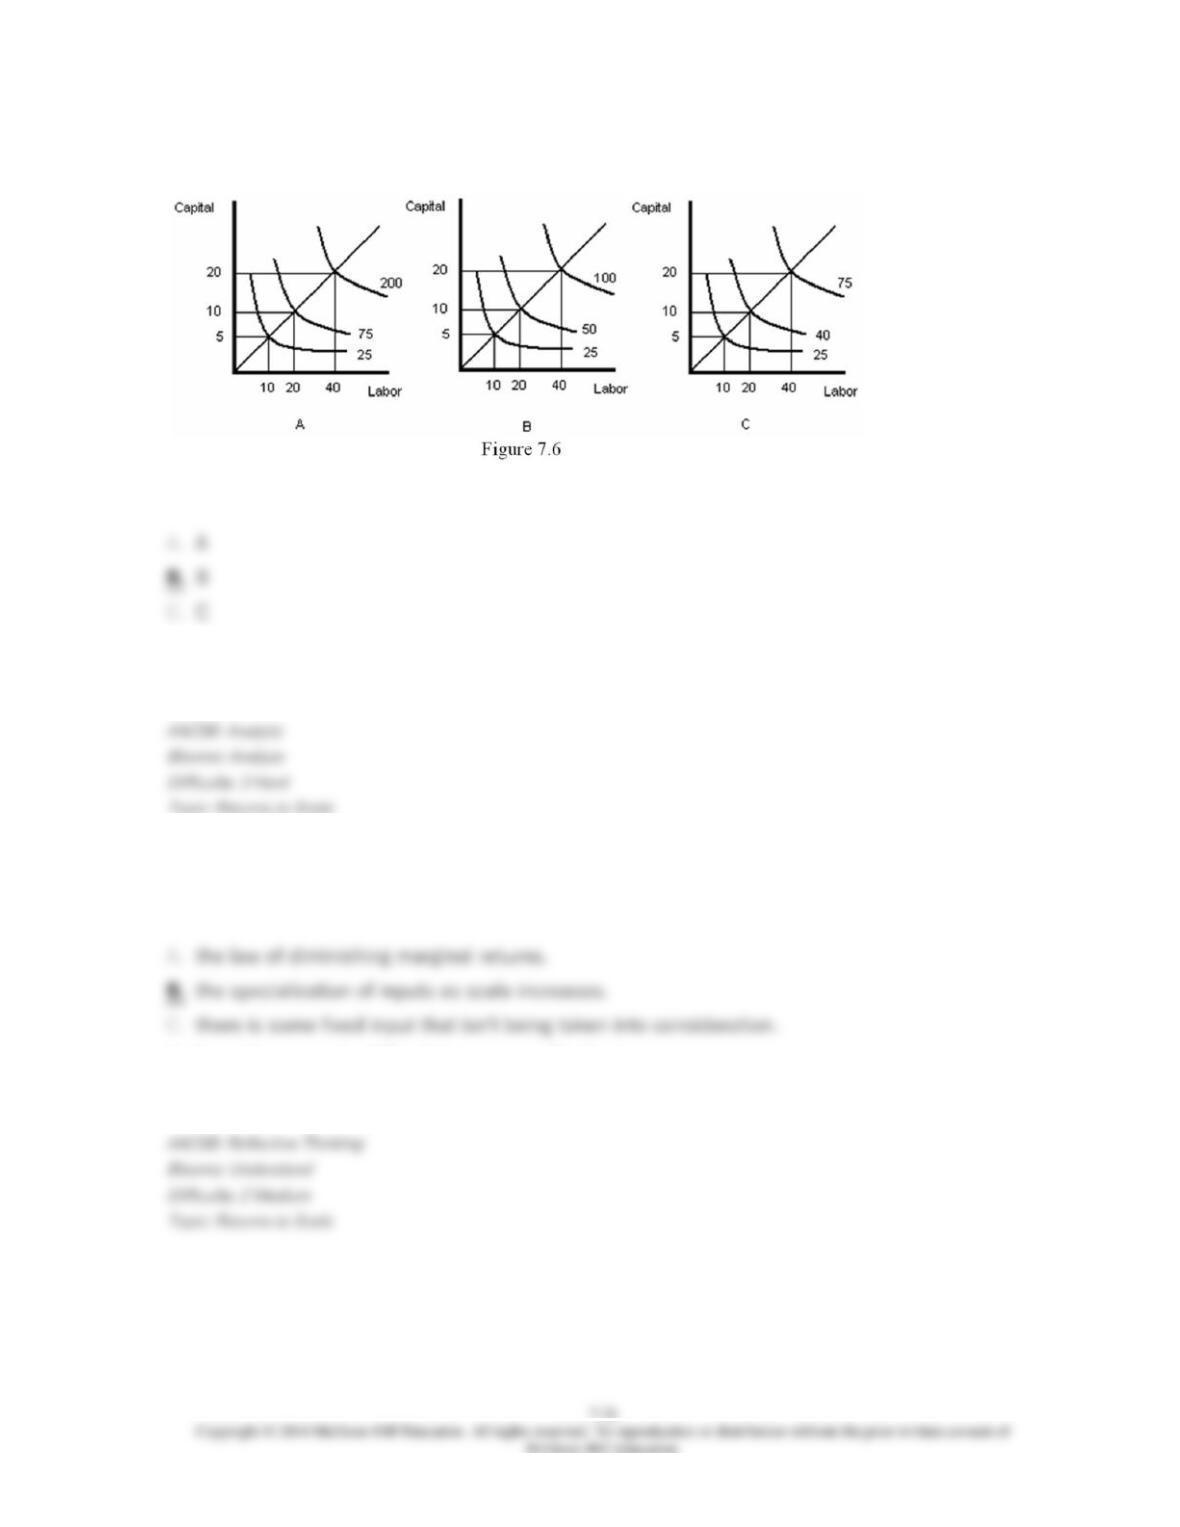
55. Refer to Figure 7.6. Which graph represents constant returns to scale?
D. Both graph A and graph C
56. One reason that firms will experience increasing returns to scale is:
D. large firms may be difficult to manage effectively.
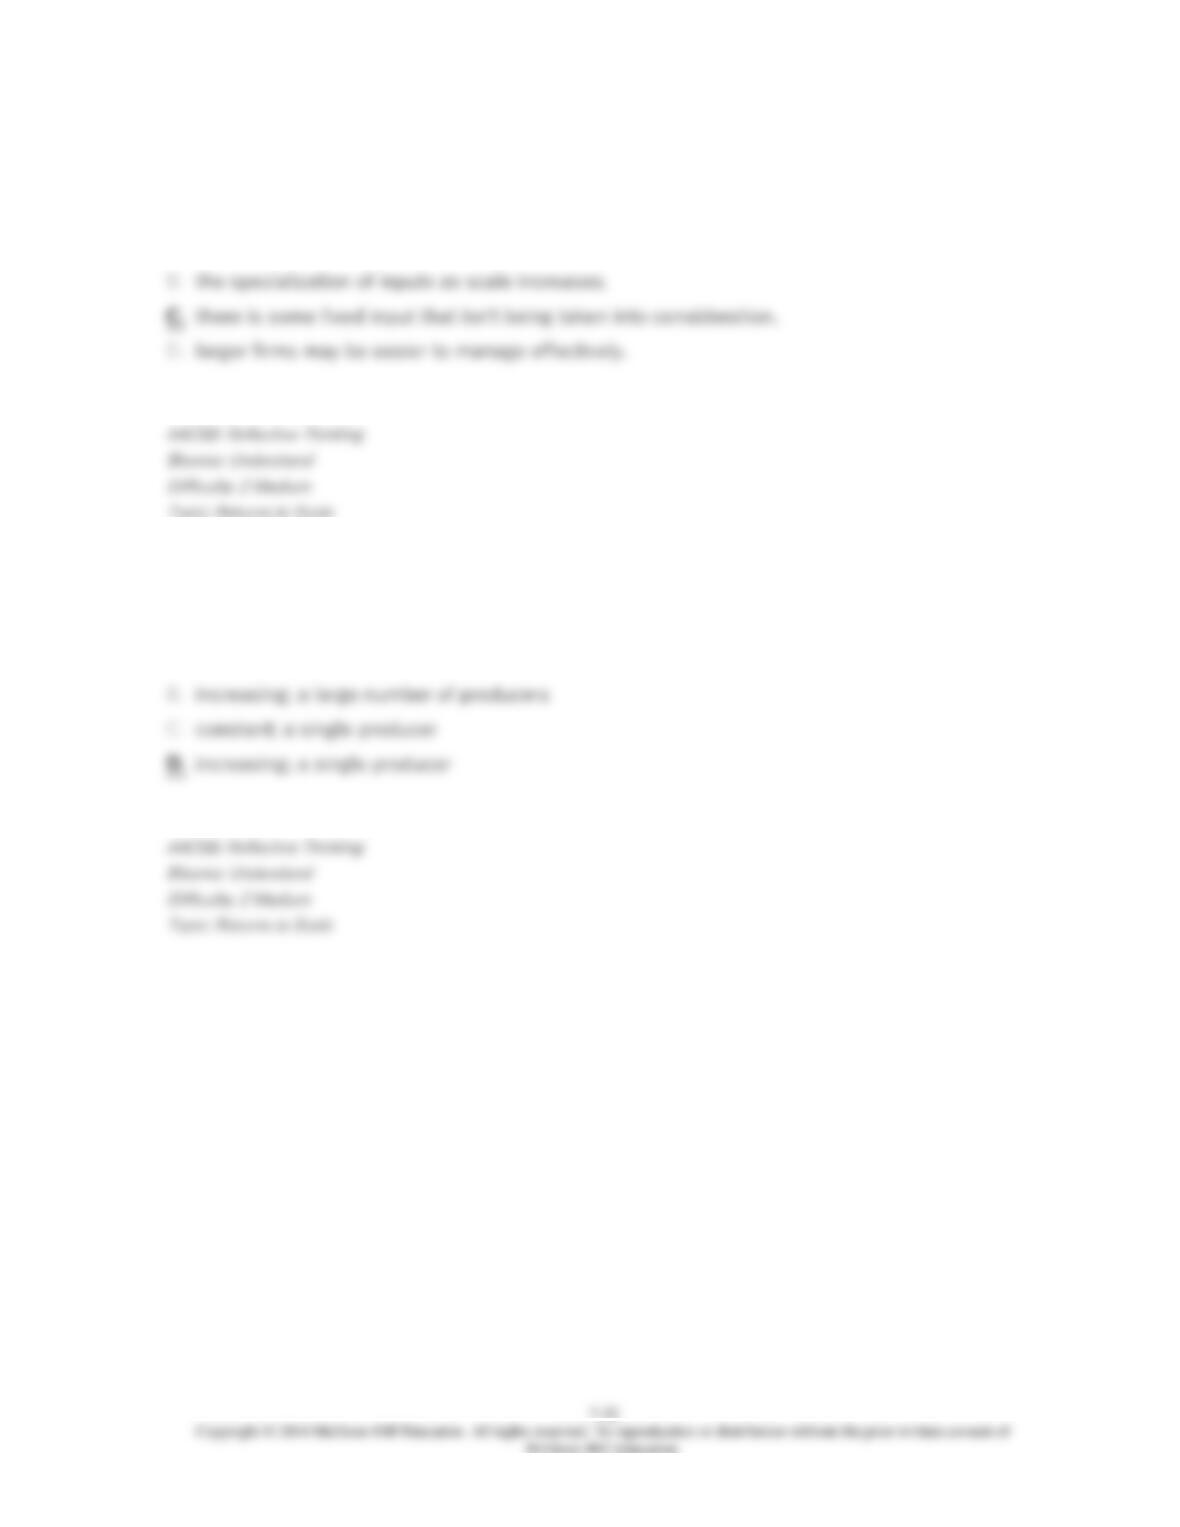
57. One reason that firms will experience decreasing returns to scale is:
A. the law of diminishing marginal returns.
58. With ______ returns to scale, production is most efficient if there is ______.
A. decreasing; a single producer