Chapter 07 – Businesses and the Costs of Production
7-1
CHAPTER 7
Businesses and the Costs of Production
A. Short-Answer, Essays, and Problems
1. Why are costs important in economics?
2. Why don’t economists use the same cost data as accountants use?
3. What is the real cost of putting an unemployed laborer to work raking leaves or digging holes and refilling
them during a severe recession? Explain.
4. How do firms incorporate opportunity costs to calculate economic costs? Discuss and give example using
an explicit economic cost and an implicit economic cost.
5. Why is it important to distinguish between explicit and implicit costs?
6. Your firm has total sales revenue of $1,000,000 and total explicit costs of $600,000 and total implicit cost
of $300,000. What will be the accounting profit for the firm? What will be the economic profit for the
firm? Explain the difference using the data.
7. Why must normal profits be counted as a cost, according to economists?
8. Evaluate this statement: “If the economic profit is zero, a business will shut down.”
9. Jane quit her job at IBM where she earned $50,000 a year. She cashed in $50,000 in corporate bonds that
earned 10% interest annually to buy a mini-bus. Jane has decided to buy the mini-bus and set up a
commuter service between Lincoln and Omaha. There are 1000 people who will pay $400 a year each for
the commuter service; $280 from each person goes for gas, maintenance, insurance, and depreciation. She
estimates that her entrepreneurial skills would have typically yielded a normal profit of $5,000 in another
business.
(a) Complete the following questions: (1) What are Jane’s total revenues? (2) What are Jane’s explicit
costs? (3) What is her accounting profit?
(b) List the important implicit costs that Jane has not included.
(c) What is Jane’s pure economic profit (loss)?
10. Debbie was earning $100,000 a year working as a scientist for a drug company. She decided to start her
own business that conducted drug trials. She estimates this entrepreneurial talent or forgone
entrepreneurial income to be $10,000 a year. She used $500,000 in savings that earned 5 percent interest
annually to finance the new business. In the first year, the firm earned revenue of $1,500,000. The costs
for rent, supplies, and employees’ salaries were $1,100,000. What was the accounting profit for the new
business? What was the economic profit (or loss)? Explain your calculations for both questions.
11. Tomas quit his job at the Tri-City bank where he earned $50,000 a year to start his own businesses, a bank
marketing company. He estimates his entrepreneurial talent or forgone entrepreneurial income to be
$5,000 a year. He used $100,000 in savings that earned 5 percent interest annually to finance the new
business. In the first year, the firm earned revenue of $250,000. The costs for rent, supplies, and an
employee’s salary were $200,000. What was the accounting profit for the new business? What was the
economic profit (or loss)? Explain your calculations for both questions.
12. Why is the distinction between fixed and variable cost important?
Chapter 07 – Businesses and the Costs of Production
7-2
13. Indicate whether the inputs below are variable (V) or fixed (F) in the short run.
Input Output
_____ Meat in hamburgers.
_____ Fire insurance in dry cleaning.
_____ Tires in automobiles.
_____ Property tax in textile production.
_____ Gasoline in trucking services.
_____ Depreciation in aircraft production.
14. What is the difference between the short run and the long run?
15. Explain the difference between total product, marginal product and average product.
16. What is the relationship between total product, marginal product, and average product shown by the law of
diminishing returns?
17. Interpret this statement: “If diminishing returns did not occur, the world could be fed out of a flower pot.”
18. Comment on the problem with this statement: “Of course, there are diminishing marginal returns from
adding more workers to a fixed quantity of plant and equipment because additional workers are not as good
as initial workers.”
19. What is the law of diminishing returns? Give a descriptive example.
20. (Consider This) How can total course learning and studying be related to the law of diminishing returns?
21. The table below shows the total production of a firm as the quantity of labor employed increases. The
quantities of all other resources employed are constant. Compute the marginal and average products and
enter them in the table.
Inputs of labor Total product Marginal product of labor Average product of labor
0 0 — —
1 40 _____ _____
2 100 _____ _____
3 165 _____ _____
4 200 _____ _____
5 225 _____ _____
6 240 _____ _____
7 245 _____ _____
8 240 _____ _____
(a) At what levels are there increasing returns to labor and at what levels are there decreasing returns to
labor?
(b) Describe the relationship between the total product and marginal product.
(c) Describe the relationship between marginal and average product.
22. Explain: “Whenever a number which is less than the previous average of a total is added to that total, the
average will necessarily fall. Conversely, whenever a number which is greater than the previous average of
a total is added to that total, the average will necessarily rise.” How does this help explain the relationship
between the various short-run cost curves? Between the various productivity curves?
23. Complete the following table by finding the average and marginal product. At what input-output level will
average variable cost begin to rise? Explain.
Inputs of labor Total product Average product Marginal product
0 0 _____
1 8 _____ _____
2 18 _____ _____
3 25 _____ _____
4 30 _____ _____
5 33 _____ _____
Chapter 07 – Businesses and the Costs of Production
7-3
6 34 _____ _____
24. You are given the following short-run information for an individual firm. Labor (L) is the only variable
input. The price of labor is $200 /week. Fixed costs are $100 / week. Complete the rest of the table.
Describe the relationship between the MP and MC. At which output level does the law of diminishing
returns set in?
Labor
L Total product
Q
MP
TVC
TFC
TC
MC
0 0 _____ $_____ $_____ $_____
1 20 _____ _____ _____ _____ $_____
2 55 _____ _____ _____ _____ _____
3 100 _____ _____ _____ _____ _____
4 150 _____ _____ _____ _____ _____
5 200 _____ _____ _____ _____ _____
6 230 _____ _____ _____ _____ _____
7 250 _____ _____ _____ _____ _____
8 263 _____ _____ _____ _____ _____
9 270 _____ _____ _____ _____ _____
10 275 _____ _____ _____ _____ _____
11 278 _____ _____ _____ _____ _____
12 280 _____ _____ _____ _____ _____
25. What is the relationship between marginal cost and marginal product?
26. Why does the short-run marginal-cost curve eventually increase for the typical firm?
27. Assume that a firm has a plant of fixed size and that it can vary its output only by varying the amount of
labor it employs. The table below shows the relationships among the amount of labor employed, the output
of the firm, the marginal product of labor, and the average product of labor.
(a) Assume each unit of labor costs the firm $20. Compute the total cost of labor for each quantity of
labor the firm might employ, and enter these figures in the table.
(b) Now determine the marginal cost of the firm’s product as the firm increases its output. Enter these
figures in the table.
(c) If labor is the only variable input, the total labor cost and total variable cost are equal. Find the
average variable cost of the firm’s product. Enter these figures in the table.
(d) Describe the relationship between the marginal product of labor and the marginal cost of the firm’s
product.
Chapter 07 – Businesses and the Costs of Production
7-4
(e) Describe the relationship between the average product of labor and the average variable cost.
Quantity of labor employed
Total output Marginal product of labor Average product of labor Total variable cost
Marginal cost Average variable cost
0 0 — — — —
1 10 10 10.00 $_____ $_____ $_____
2 22 12 11.00 _____ _____ _____
3 36 14 12.00 _____ _____ _____
4 48 12 12.00 _____ _____ _____
5 58 10 11.60 _____ _____ _____
6 66 8 11.00 _____ _____ _____
7 72 6 10.28 _____ _____ _____
8 76 4 9.50 _____ _____ _____
9 78 2 8.66 _____ _____ _____
10 78 0 7.80 _____ _____ _____
28. Assume a firm has fixed costs of $80 and variable costs as indicated in the table below. Complete the cost
table.
Total product Total variable cost
Total
cost
AFC
AVC
ATC
MC
0 $ 0 $ 80 — — — —
1 110 190 $_____ $_____ $_____ $_____
2 150 230 _____ _____ _____ _____
3 180 260 _____ _____ _____ _____
4 220 300 _____ _____ _____ _____
5 270 350 _____ _____ _____ _____
6 340 420 _____ _____ _____ _____
7 440 520 _____ _____ _____ _____
8 580 660 _____ _____ _____ _____
29. Complete the following short-run cost table using the information provided.
Total product
TFC
AFC
TVC
AVC
TC
MC
0 $_____ — $_____ — $_____ $_____
1 _____ $_____ _____ $12 _____ _____
2 _____ 12 _____ 10 _____ _____
3 _____ _____ _____ 12 _____ _____
4 _____ _____ _____ 14 _____ _____
Chapter 07 – Businesses and the Costs of Production
7-5
30. In the table below you will find a schedule of a firm’s fixed cost and variable cost. Complete the table by
computing total cost, average fixed cost, average variable cost, average total cost, and marginal cost.
Total product Total fixed cost Total variable cost
Total cost Average fixed cost Average variable cost Average total
cost
Marginal cost
0 $100 $ 0 $_____ — — — —
1 100 100 _____ $_____ $_____ $_____ $_____
2 100 180 _____ _____ _____ _____ _____
3 100 240 _____ _____ _____ _____ _____
4 100 320 _____ _____ _____ _____ _____
5 100 440 _____ _____ _____ _____ _____
6 100 600 _____ _____ _____ _____ _____
7 100 800 _____ _____ _____ _____ _____
8 100 1040 _____ _____ _____ _____ _____
9 100 1340 _____ _____ _____ _____ _____
10 100 1800 _____ _____ _____ _____ _____
31. Complete the following short-run cost table using the information provided.
Q TC TFC TVC AVC ATC MC
0 $ 4 $_____ $_____ $_____ $_____ $_____
1 7 _____ _____ _____ _____ _____
2 9 _____ _____ _____ _____ _____
3 10 _____ _____ _____ _____ _____
4 11 _____ _____ _____ _____ _____
5 13 _____ _____ _____ _____ _____
6 17 _____ _____ _____ _____ _____
7 22 _____ _____ _____ _____ _____
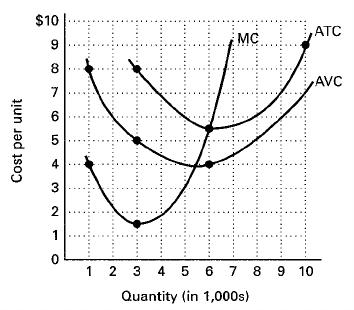
32. Answer the questions below on the basis of the diagram.
(a) How can you tell if these cost curves are for the short run or the long run?
(b) What does the graph indicate about:
(1) AVC at 6000 units of output?
(2) ATC at 6000 units of output?
(3) AFC at 6000 units of output?
(4) TVC at 6000 units of output?
(5) TFC at all levels of output?
(6) TC at 10,000 units of output?
(7) When diminishing returns set in?
33. Explain what happens to AFC, AVC, ATC, and MC curves in these two situations: (a) fixed cost increase;
(b) variable cost increase.

Chapter 07 – Businesses and the Costs of Production
7-6
34. What effect would each of the following have on the short-run average and marginal costs of an auto
dealership: (a) auto mechanics receive a 10% wage increase; (b) property taxes decrease; (c) auto dealers
institute a one-time only promotional campaign?
35. Explain the circumstances under which a firm might encounter a rather extended range of output over
which long-run average costs are relatively constant.
36. The following are three short-run average total cost schedules for the only three possible plant sizes, 1, 2,
and 3. Find the long-run average cost schedule and show the result in the second table.
Size 1 Size 2 Size 3
Q ATC Q ATC Q ATC
10 $1.00 20 $ .95 40 $1.00
20 .90 30 .80 50 .87
30 .85 40 .76 60 .84
40 .88 50 .79 70 .80
50 .93 60 .83 80 .95
60 1.05 70 .90 90 1.05
Long Run
Q AC
10 $_____
__________
__________
__________
__________
__________
__________
__________
90 _____
37. In the table below are data from a book company that prints and binds special-order books. The data show
various quantities that can be produced by the firm in an hour and the unit costs of each quantity.
(1)
Quantity of books (2)
Unit cost A of books (3)
Unit cost B of books
100 $70 $_____
200 60 _____
300 50 _____
400 40 _____
500 35 _____
600 30 _____
700 35 _____
800 45 _____
900 60 _____
1000 80 _____
(a) In the graph below, label the axes and plot the long-run average cost curve for this firm using the data
in columns 1 and 2 of the table above.
Chapter 07 – Businesses and the Costs of Production
7-7
(b) The firm then decides to subcontract the binding work to another company that specializes in the
binding of books. As a consequence, the unit costs of the firm are decreased by $20 at each output
level. Fill in column 3 of the table, and then graph the new long-run average cost curve B for the firm
on the graph.
(c) What will be the minimum cost with unit cost A? With unit cost B?
(d) If the firm produces 400 books, what will be the cost with curve A? With curve B?
38. Below are the short-run average-total-cost schedules for three plants of different size that a firm might
build to produce its product. Assume that these are the only possible sizes of plants that the firm might
build. What is the long-run average-cost schedule for the firm? Show it in the second table below.
Plant size X Plant size Y Plant size Z
Output ATC Output ATC Output ATC
5 $10 5 $13 5 $72
10 9 10 12 10 65
15 8 15 11 15 52
20 7 20 10 20 41
25 6 25 8 25 33
30 9 30 7 30 20
35 12 35 9 35 15
40 18 40 12 40 14
45 20 45 17 45 12
50 23 50 19 50 14
55 29 55 25 55 20
60 31 60 33 60 30
Output Average cost
5 $_____
10 _____
15 _____
20 _____
25 _____
30 _____
35 _____
40 _____
45 _____
50 _____
55 _____
60 _____
For what output levels should the firm build plant X, plant Y, and plant Z?
39. How can diseconomies of scale occur at larger capacities?
40. What factors explain economies of scale?
41. What is minimum efficient scale? What insights would it give about the size of firms in an industry?
42. The values for the long-run ATC curves of three different firms are listed in the table below.
Quantity ATC 1 ATC 2 ATC 3
5 10 7 12
10 8 6 9
15 7 5 7
20 6 6 6
25 6 7 5
30 6 9 4
35 7 13 6
40 8 17 9
(a) Which firm faces the lowest minimum ATC?
(b) Which firm has the greatest minimum efficient scale?
(c) Which firm has the smallest economies of scale?
Chapter 07 – Businesses and the Costs of Production
7-8
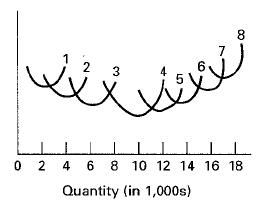
43. Consider the diagram below. Curves 1–8 are the short-run curves which occur with different plant sizes.
Answer the next two questions.
(a) On the graph show the range of outputs for: (1) economies of scale; (2) diseconomies of scale:
Indicate (3) minimum efficient scale.
(b) In the long run, what plant size should the firm build if it wants to produce: (1) 6000 units; (2) 14,000
units?
44. What effect does the increase of the price of corn have on the cost curves of a firm producing items like
cereal, tortilla shells and chewing gum?
45. What effect does the increase of the price of gasoline have on the cost curves of package delivery firms
such as Federal Express or United Parcel Service? How might the effects differ for a software firm such as
Symantec that uses the Internet?
46. What are some of the sources of cost savings for recent business start-ups in the U.S. economy such as
Intel, Starbucks, Microsoft, Dell, Google and Cisco Systems?
47. How would a Verson stamping machine help a firm achieve economies of scale?
48. Explain how the Internet has affected the average fixed cost of a daily print newspaper.
49. Why are there two plants run by one firm that produce large commercial aircraft and thousands of plants
run by hundreds of firms that produce ready-mix concrete? Explain in terms of economies of scale.
50. (Last Word) What is the economic meaning of the saying “Don’t cry over spilt milk” and its implications
for economic decision-making?
Chapter 07 – Businesses and the Costs of Production
7-9
B. Answers to Short-Answer, Essays, and Problems
1. Why are costs important in economics?
2. Why don’t economists use the same cost data as accountants use?
3. What is the real cost of putting an unemployed laborer to work raking leaves or digging holes and refilling
them during a severe recession? Explain.
4. How do firms incorporate opportunity costs to calculate economic costs? Discuss and give example using
an explicit economic cost and an implicit economic cost.
5. Why is it important to distinguish between explicit and implicit costs?
6. Your firm has total sales revenue of $1,000,000 and total explicit costs of $600,000 and total implicit cost
of $300,000. What will be the accounting profit for the firm? What will be the economic profit for the
firm? Explain the difference using the data.
Chapter 07 – Businesses and the Costs of Production
7. Why must normal profits be counted as a cost, according to economists?
8. Evaluate this statement: “If the economic profit is zero, a business will shut down.”
9. Jane quit her job at IBM where she earned $50,000 a year. She cashed in $50,000 in corporate bonds that
earned 10% interest annually to buy a mini-bus. Jane has decided to buy the mini-bus and set up a
commuter service between Lincoln and Omaha. There are 1000 people who will pay $400 a year each for
the commuter service; $280 from each person goes for gas, maintenance, insurance, and depreciation. She
estimates that her entrepreneurial skills would have typically yielded a normal profit of $5,000 in another
business.
(a) Complete the following questions: (1) What are Jane’s total revenues? (2) What are Jane’s explicit
costs? (3) What is her accounting profit?
(b) List the important implicit costs that Jane has not included.
(c) What is Jane’s pure economic profit (loss)?
10. Debbie was earning $100,000 a year working as a scientist for a drug company. She decided to start her
own business that conducted drug trials. She estimates this entrepreneurial talent or forgone
entrepreneurial income to be $10,000 a year. She used $500,000 in savings that earned 5 percent interest
annually to finance the new business. In the first year, the firm earned revenue of $1,500,000. The costs
for rent, supplies, and employees’ salaries were $1,100,000. What was the accounting profit for the new
business? What was the economic profit (or loss)? Explain your calculations for both questions.
Chapter 07 – Businesses and the Costs of Production
7-11
11. Tomas quit his job at the Tri-City bank where he earned $50,000 a year to start his own businesses, a bank
marketing company. He estimates his entrepreneurial talent or forgone entrepreneurial income to be
$5,000 a year. He used $100,000 in savings that earned 5 percent interest annually to finance the new
business. In the first year, the firm earned revenue of $250,000. The costs for rent, supplies, and an
employee’s salary were $200,000. What was the accounting profit for the new business? What was the
economic profit (or loss)? Explain your calculations for both questions.
12. Why is the distinction between fixed and variable cost important?
13. Indicate whether the inputs below are variable (V) or fixed (F) in the short run.
Input Output
_____ Meat in hamburgers.
_____ Fire insurance in dry cleaning.
_____ Tires in automobiles.
_____ Property tax in textile production.
_____ Gasoline in trucking services.
_____ Depreciation in aircraft production.
14. What is the difference between the short run and the long run?
15. Explain the difference between total product, marginal product and average product.
16. What is the relationship between total product, marginal product, and average product shown by the law of
diminishing returns?
Chapter 07 – Businesses and the Costs of Production
17. Interpret this statement: “If diminishing returns did not occur, the world could be fed out of a flower pot.”
18. Comment on the problem with this statement: “Of course, there are diminishing marginal returns from
adding more workers to a fixed quantity of plant and equipment because additional workers are not as good
as initial workers.”
19. What is the law of diminishing returns? Give a descriptive example.
20. (Consider This) How can total course learning and studying be related to the law of diminishing returns?
Chapter 07 – Businesses and the Costs of Production
7-13
21. The table below shows the total production of a firm as the quantity of labor employed increases. The
quantities of all other resources employed are constant. Compute the marginal and average products and
enter them in the table.
Inputs of labor Total product Marginal product of labor Average product of labor
0 0 — —
1 40 _____ _____
2 100 _____ _____
3 165 _____ _____
4 200 _____ _____
5 225 _____ _____
6 240 _____ _____
7 245 _____ _____
8 240 _____ _____
(a) At what levels are there increasing returns to labor and at what levels are there decreasing returns to
labor?
(b) Describe the relationship between the total product and marginal product.
(c) Describe the relationship between marginal and average product.
22. Explain: “Whenever a number which is less than the previous average of a total is added to that total, the
average will necessarily fall. Conversely, whenever a number which is greater than the previous average of
a total is added to that total, the average will necessarily rise.” How does this help explain the relationship
between the various short-run cost curves? Between the various productivity curves?
23. Complete the following table by finding the average and marginal product. At what input-output level will
average variable cost begin to rise? Explain.
Inputs of labor Total product Average product Marginal product
Chapter 07 – Businesses and the Costs of Production
7-14
0 0 _____
1 8 _____ _____
2 18 _____ _____
3 25 _____ _____
4 30 _____ _____
5 33 _____ _____
6 34 _____ _____
24. You are given the following short-run information for an individual firm. Labor (L) is the only variable
input. The price of labor is $200 /week. Fixed costs are $100 / week. Complete the rest of the table.
Describe the relationship between the MP and MC. At which output level does the law of diminishing
returns set in?
Labor
L Total product
Q
MP
TVC
TFC
TC
MC
0 0 _____ $_____ $_____ $_____
1 20 _____ _____ _____ _____ $_____
2 55 _____ _____ _____ _____ _____
3 100 _____ _____ _____ _____ _____
4 150 _____ _____ _____ _____ _____
5 200 _____ _____ _____ _____ _____
6 230 _____ _____ _____ _____ _____
7 250 _____ _____ _____ _____ _____
8 263 _____ _____ _____ _____ _____
9 270 _____ _____ _____ _____ _____
10 275 _____ _____ _____ _____ _____
11 278 _____ _____ _____ _____ _____
12 280 _____ _____ _____ _____ _____
Chapter 07 – Businesses and the Costs of Production
7-15
25. What is the relationship between marginal cost and marginal product?
26. Why does the short-run marginal-cost curve eventually increase for the typical firm?
27. Assume that a firm has a plant of fixed size and that it can vary its output only by varying the amount of
labor it employs. The table below shows the relationships among the amount of labor employed, the output
of the firm, the marginal product of labor, and the average product of labor.
(a) Assume each unit of labor costs the firm $20. Compute the total cost of labor for each quantity of
labor the firm might employ, and enter these figures in the table.
(b) Now determine the marginal cost of the firm’s product as the firm increases its output. Enter these
figures in the table.