Chapter 6: ELASTICITY AND DEMAND
Multiple Choice
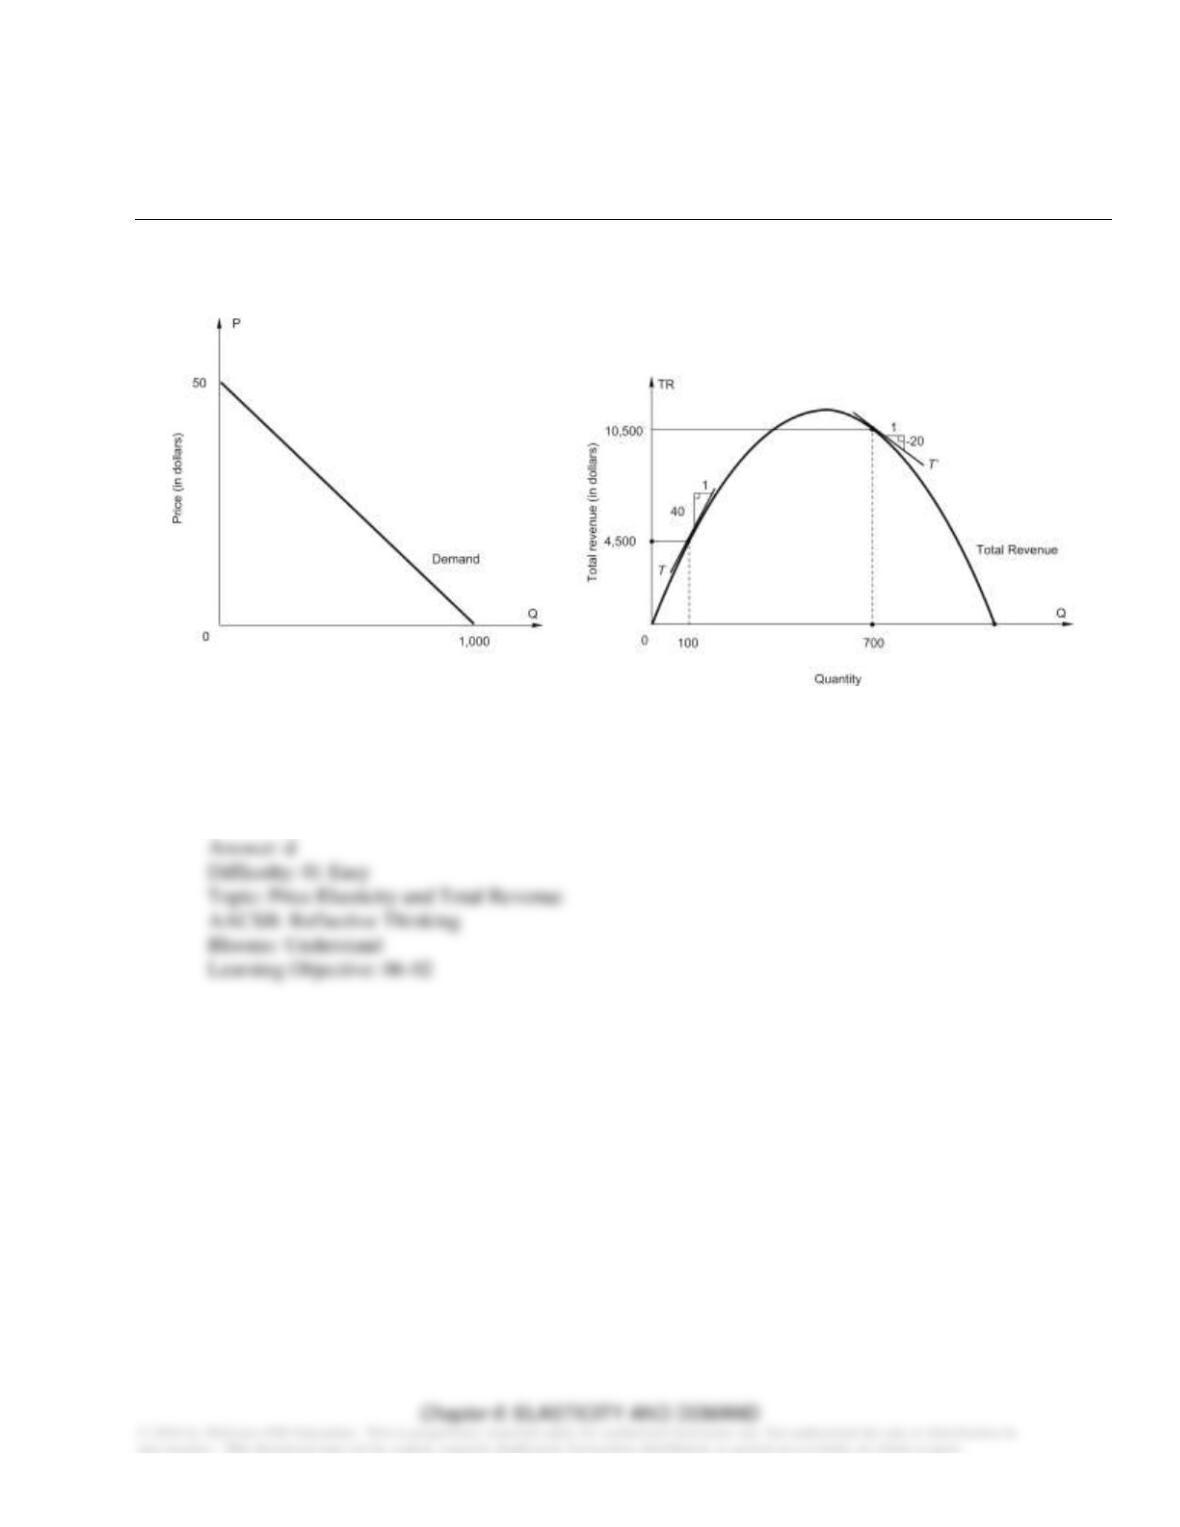
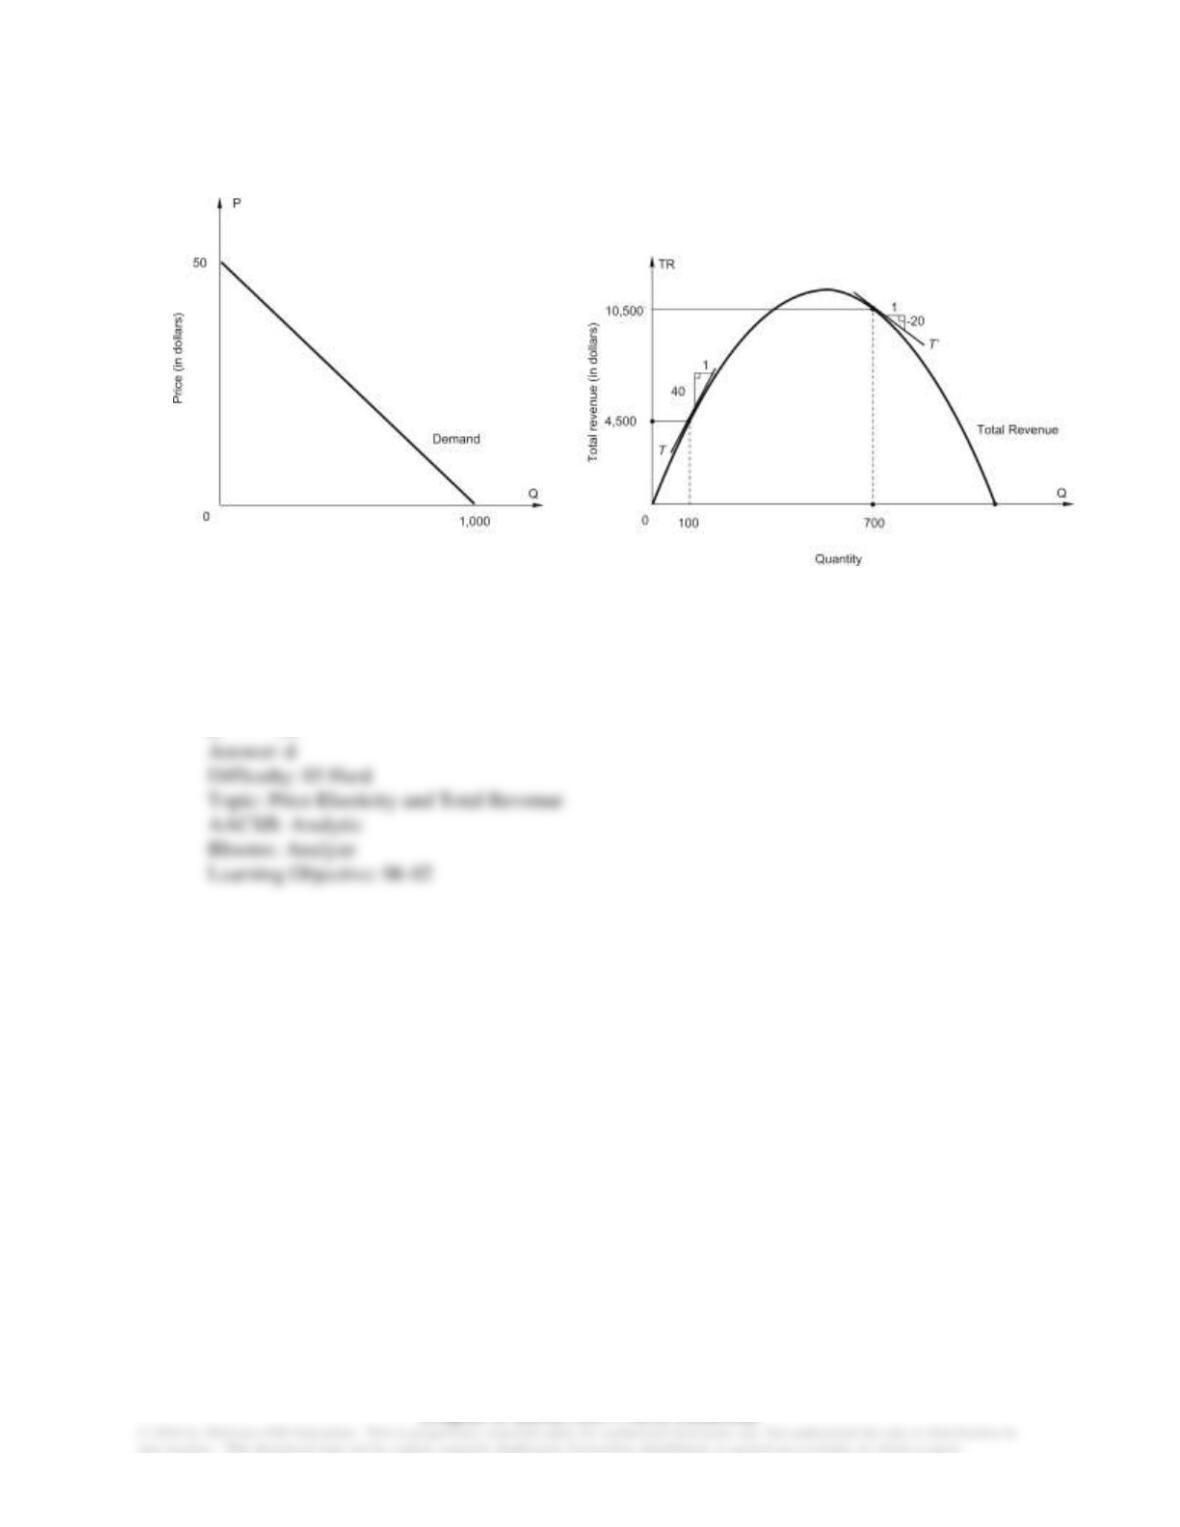
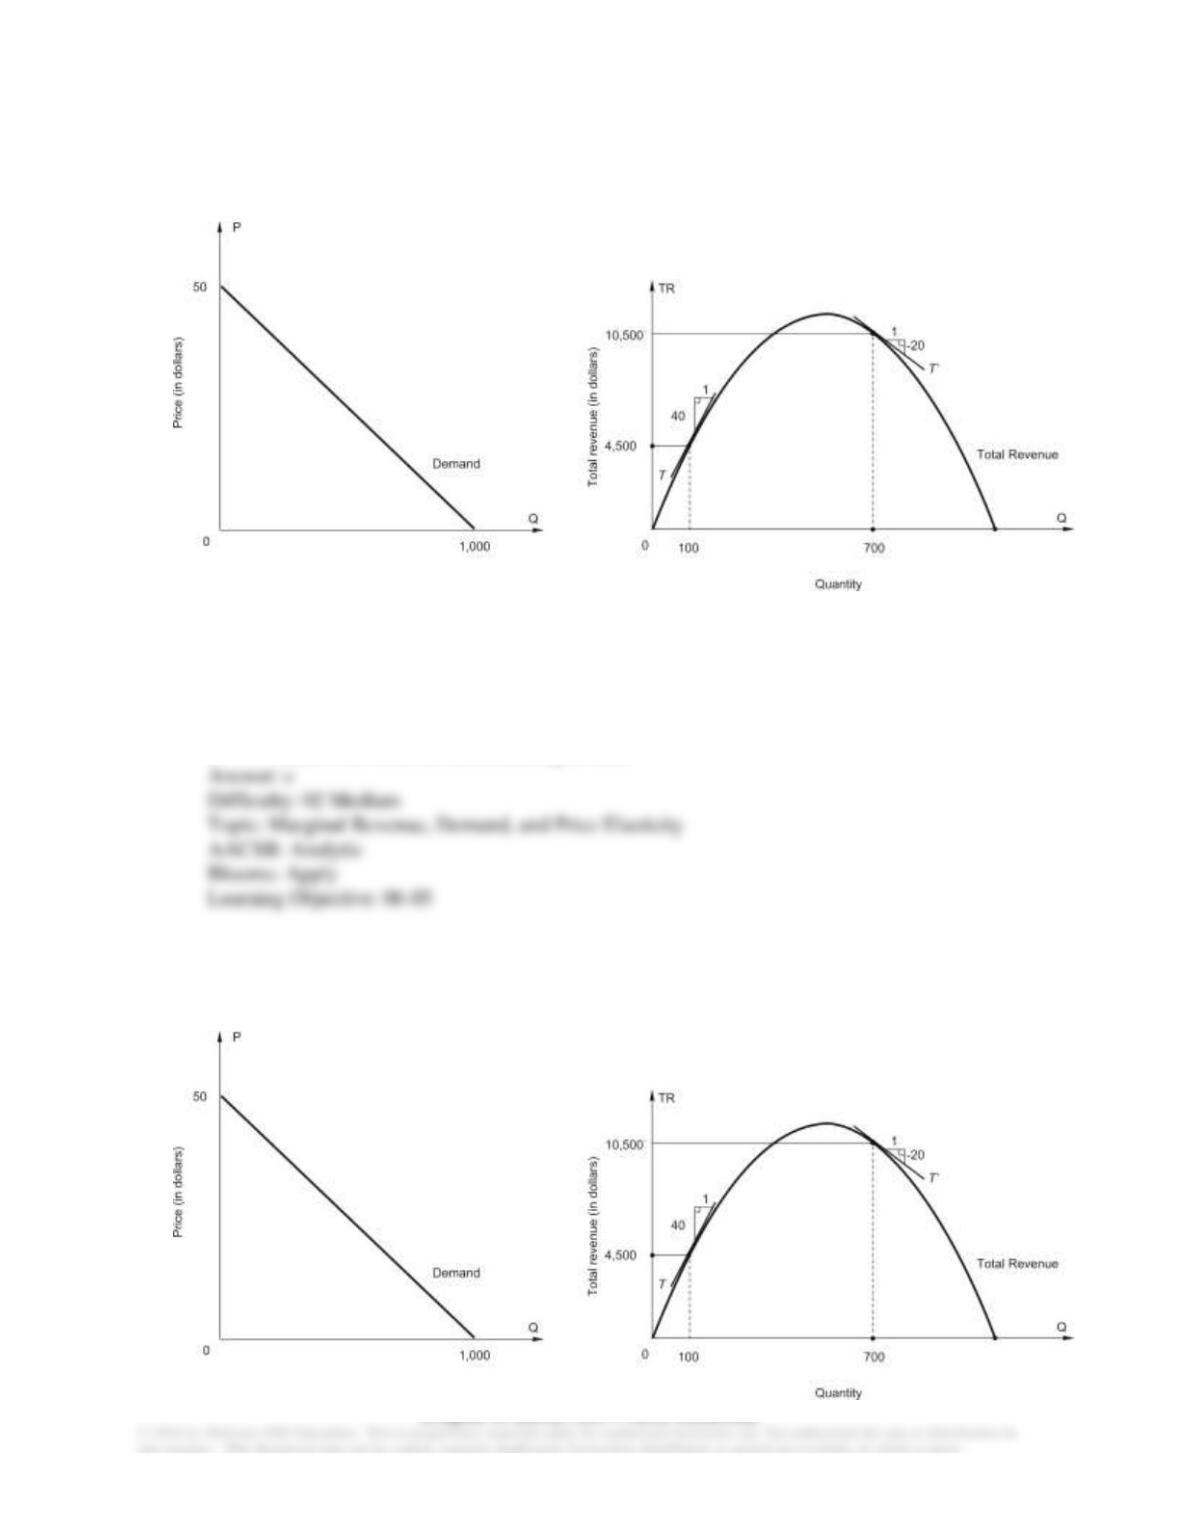
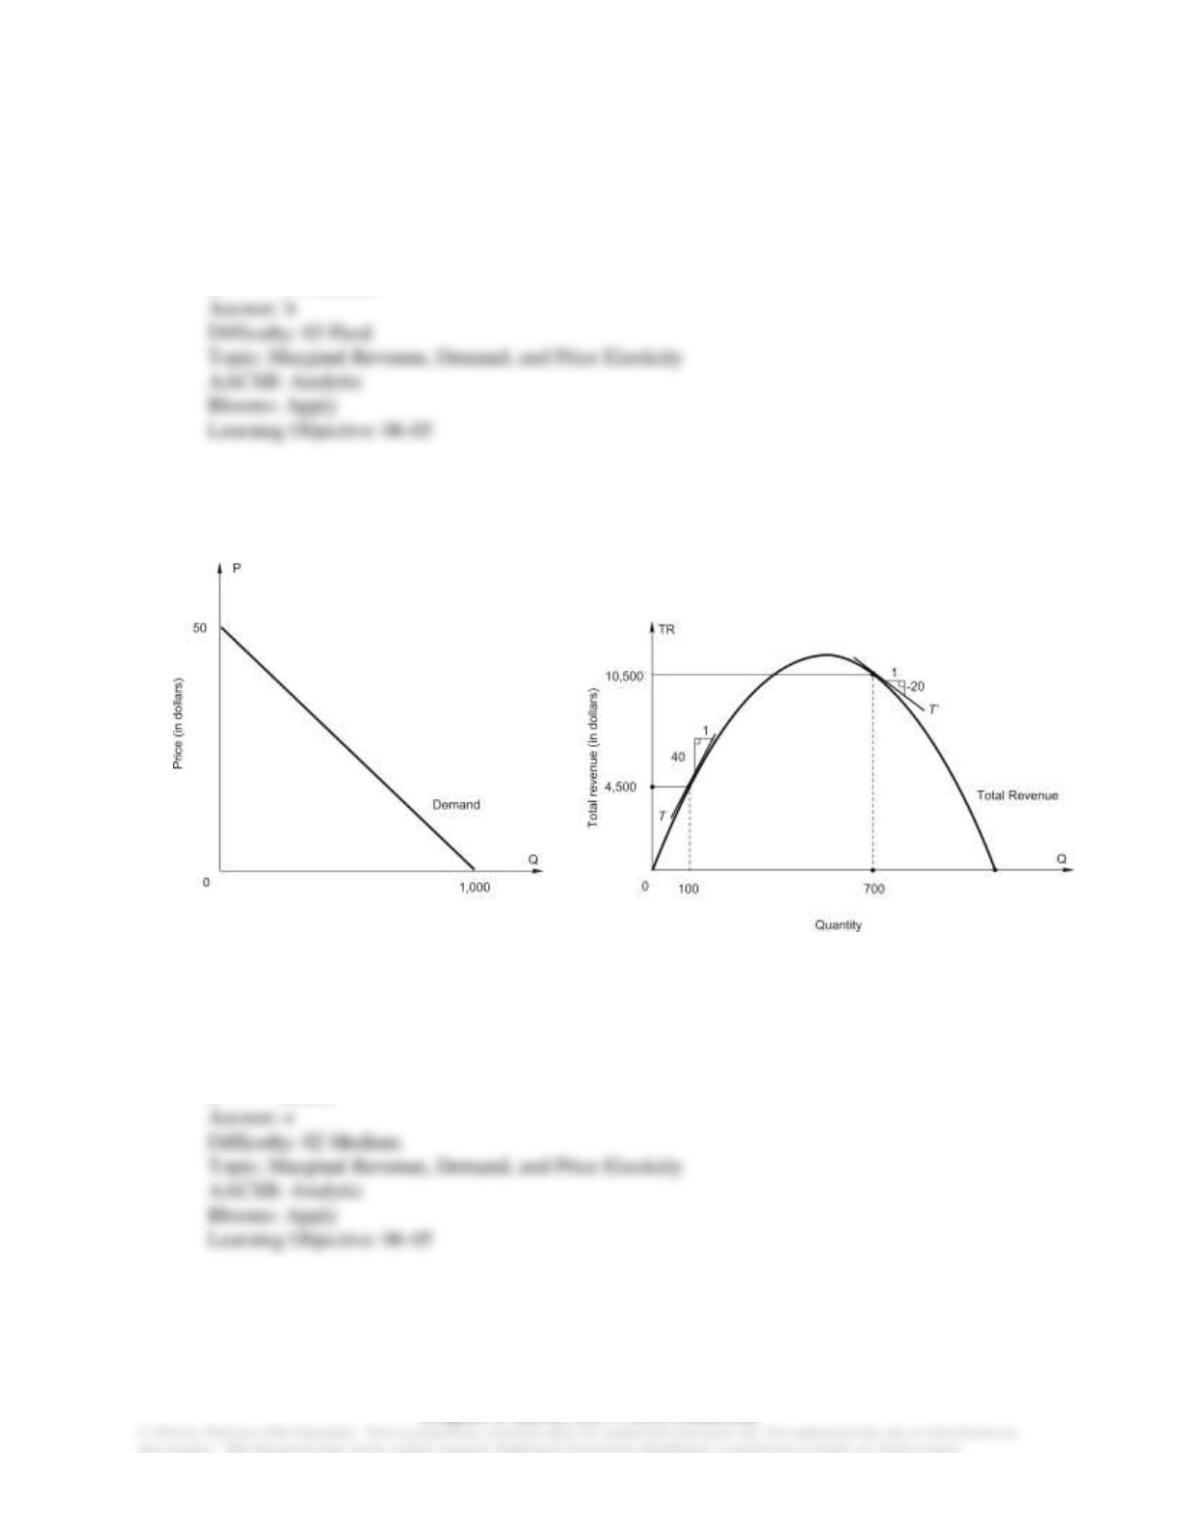
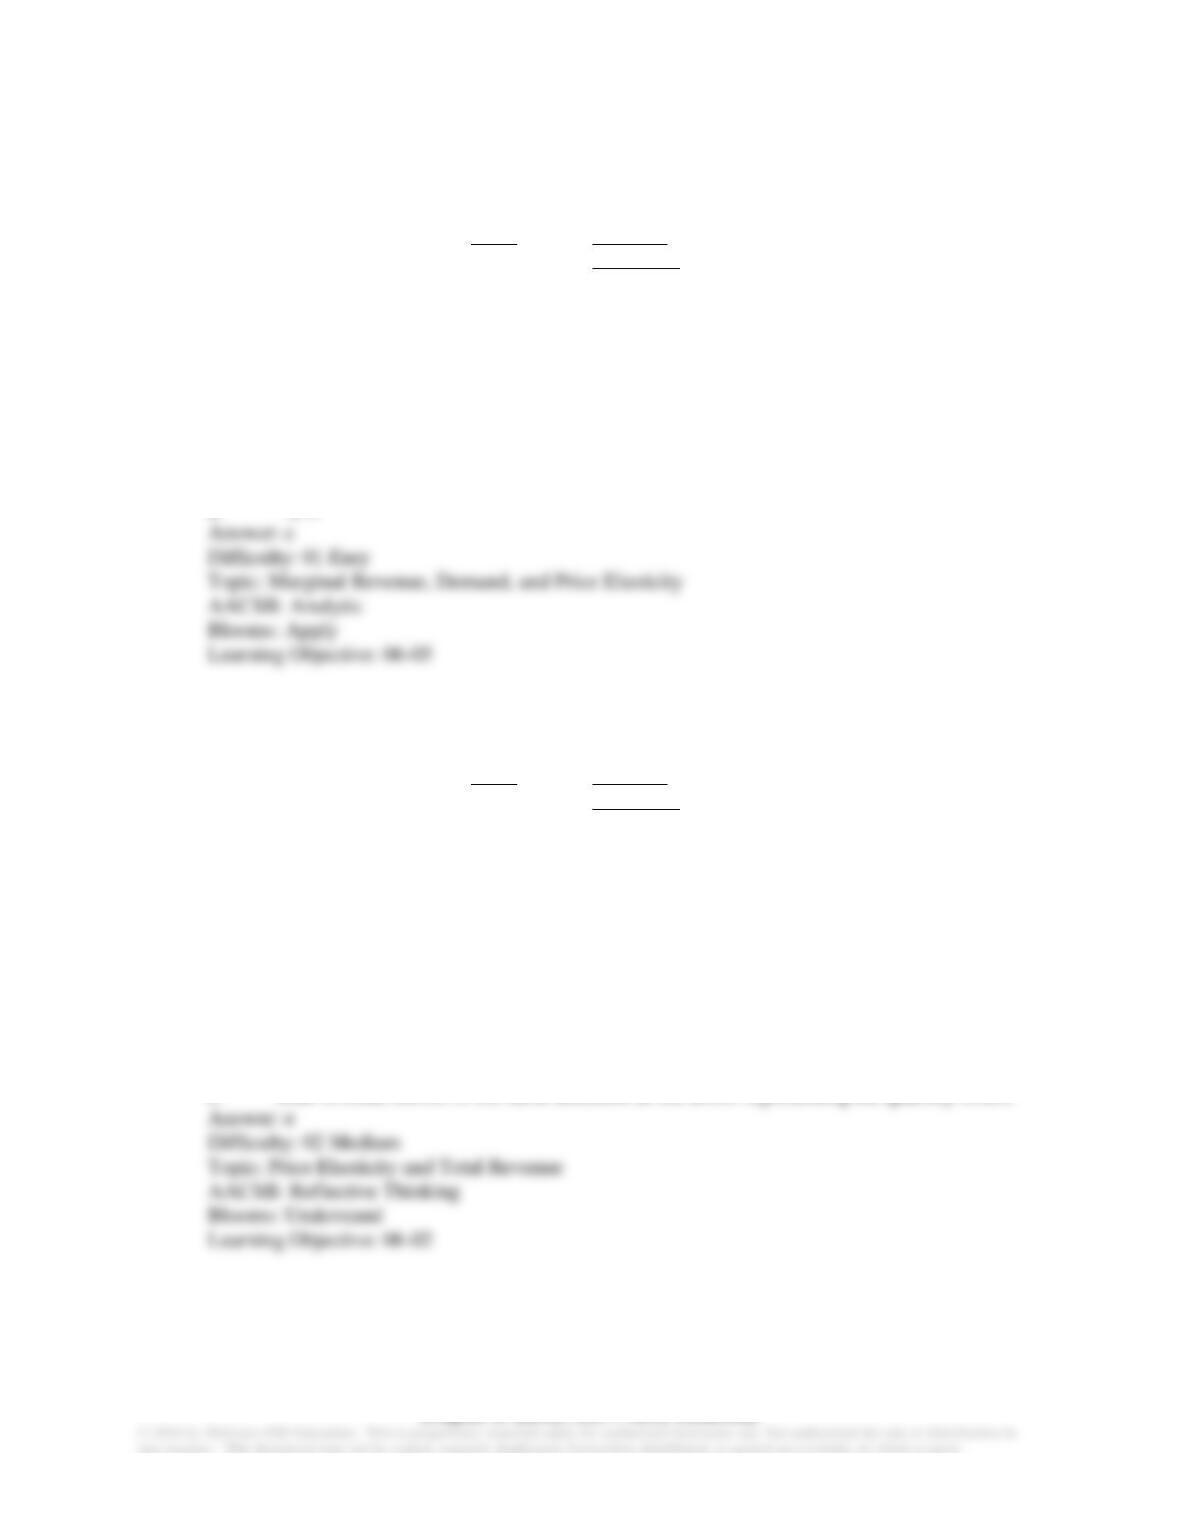
6-1 Use the figure below, which shows a linear demand curve and the associated total revenue curve, to
answer the question.
The price for which 100 units can be sold is $_____.
a. 10
b. 15
c. 25
d. 45
e. 50
Chapter 6: ELASTICITY AND DEMAND
6-2 Use the figure below, which shows a linear demand curve and the associated total revenue curve, to
answer the question.
The price at which total revenue is maximized is $_____.
a. 10
b. 15
c. 20
d. 25
e. 30
Chapter 6: ELASTICITY AND DEMAND
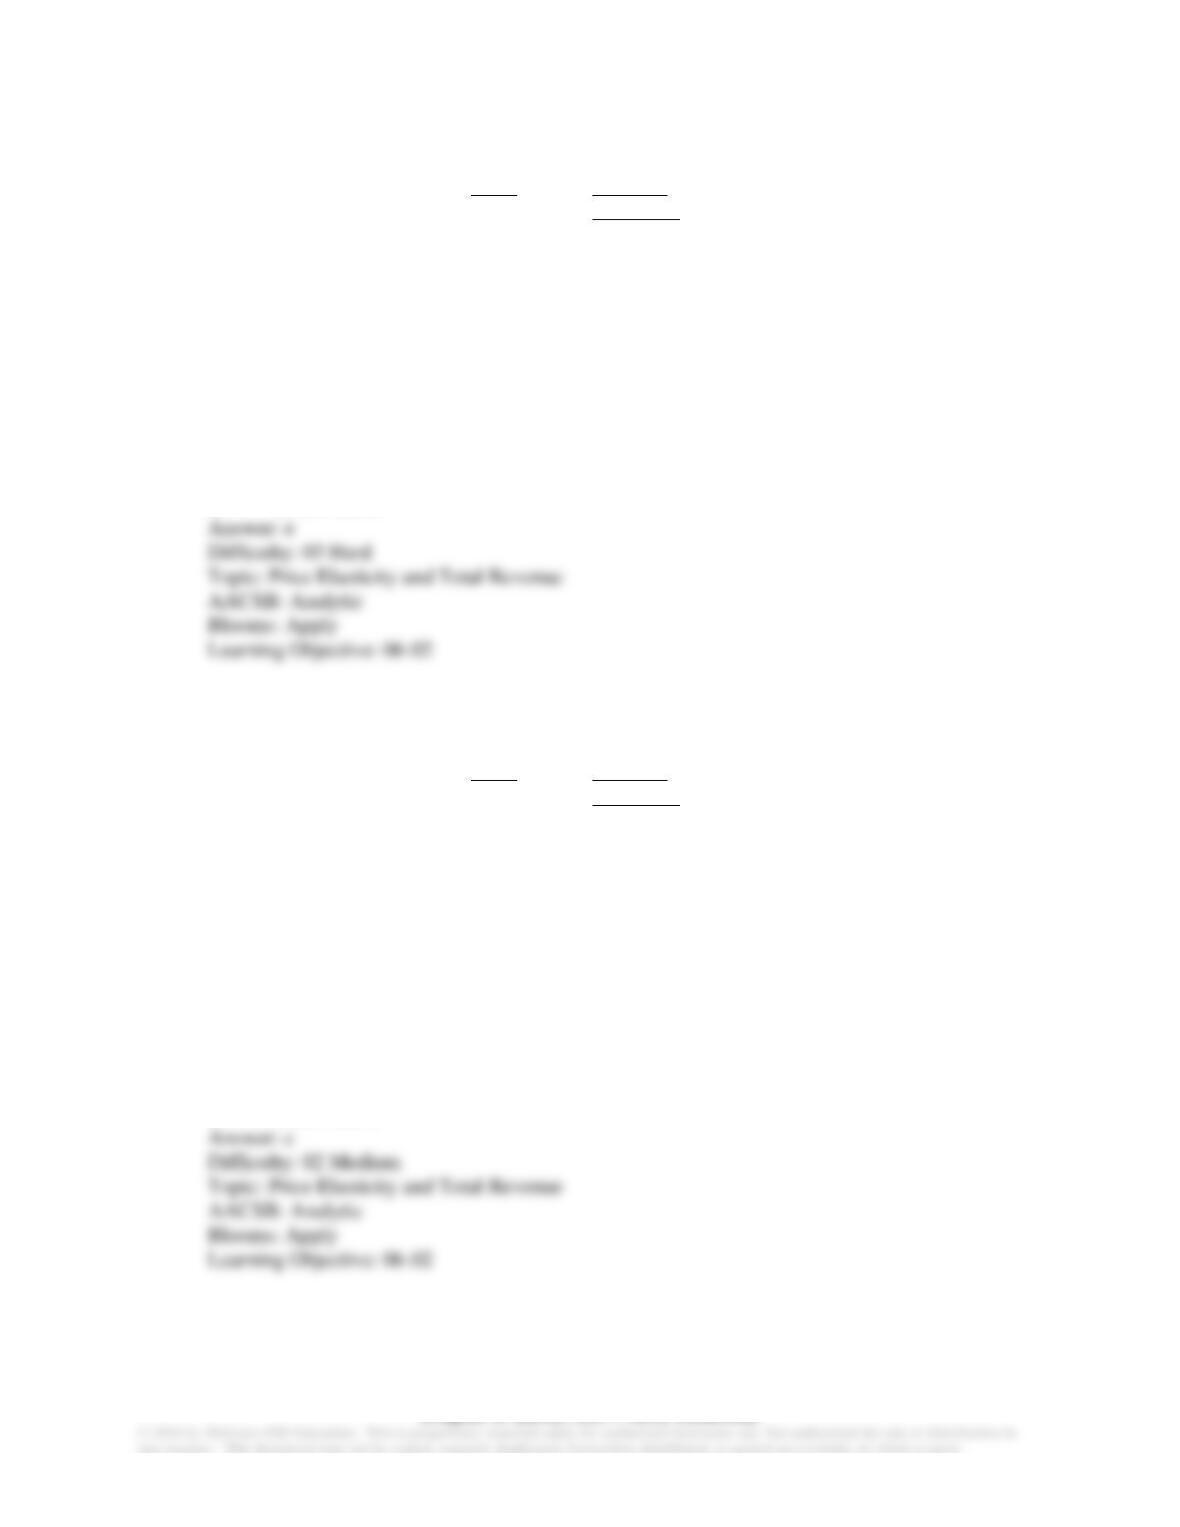
6-3 Use the figure below, which shows a linear demand curve and the associated total revenue curve, to
answer the question.
The marginal revenue of the 100th unit is $_____.
a. 0
b. 20
c. 40
d. 50
e. cannot tell from the information provided
6-4 Use the figure below, which shows a linear demand curve and the associated total revenue curve, to
answer the question.
Chapter 6: ELASTICITY AND DEMAND
The marginal revenue of the 700th unit is $_____ and demand is __________ at this point.
a. –20; elastic
b. –20; inelastic
c. 15; elastic
d. 15; inelastic
6-5 Use the figure below, which shows a linear demand curve and the associated total revenue curve,
to answer the question.
The maximum possible total revenue is $_________.
a. 10,500
b. 11,000
c. 11,500
d. 12,000
e. 12,500
6-6 The Interior Department recently announced that it will increase the entrance fees at Yellowstone
National Park in order to increase park revenues. The Interior Department must believe that
a. park goers are very responsive to price changes.
b. the demand for park services is elastic.
Chapter 6: ELASTICITY AND DEMAND
c. the percentage increase in fees will be greater than the percentage decrease in the number
of park visitors.
d. demand is unitary elastic, and thus the number of visitors will NOT decrease.
6-7 Which of the following will NOT affect the elasticity of demand for a product?
a. the number of substitutes
b. how long consumers have to adapt to price changes
c. the cost of producing the product
d. the percentage of the consumer’s budget spent on the product
e. all of the above will affect the elasticity of demand for a product
6-8 If the demand for umbrellas is price inelastic,
a. changes in price do not affect the number of umbrellas demanded.
b. if more umbrellas are sold as the result of a price decrease, total expenditures by
consumers on umbrellas will decrease.
c. the percentage change in price is less than the percentage change in quantity demanded.
d. the percentage change in quantity demanded is greater than the percentage change in
price.
e. none of the above
Chapter 6: ELASTICITY AND DEMAND
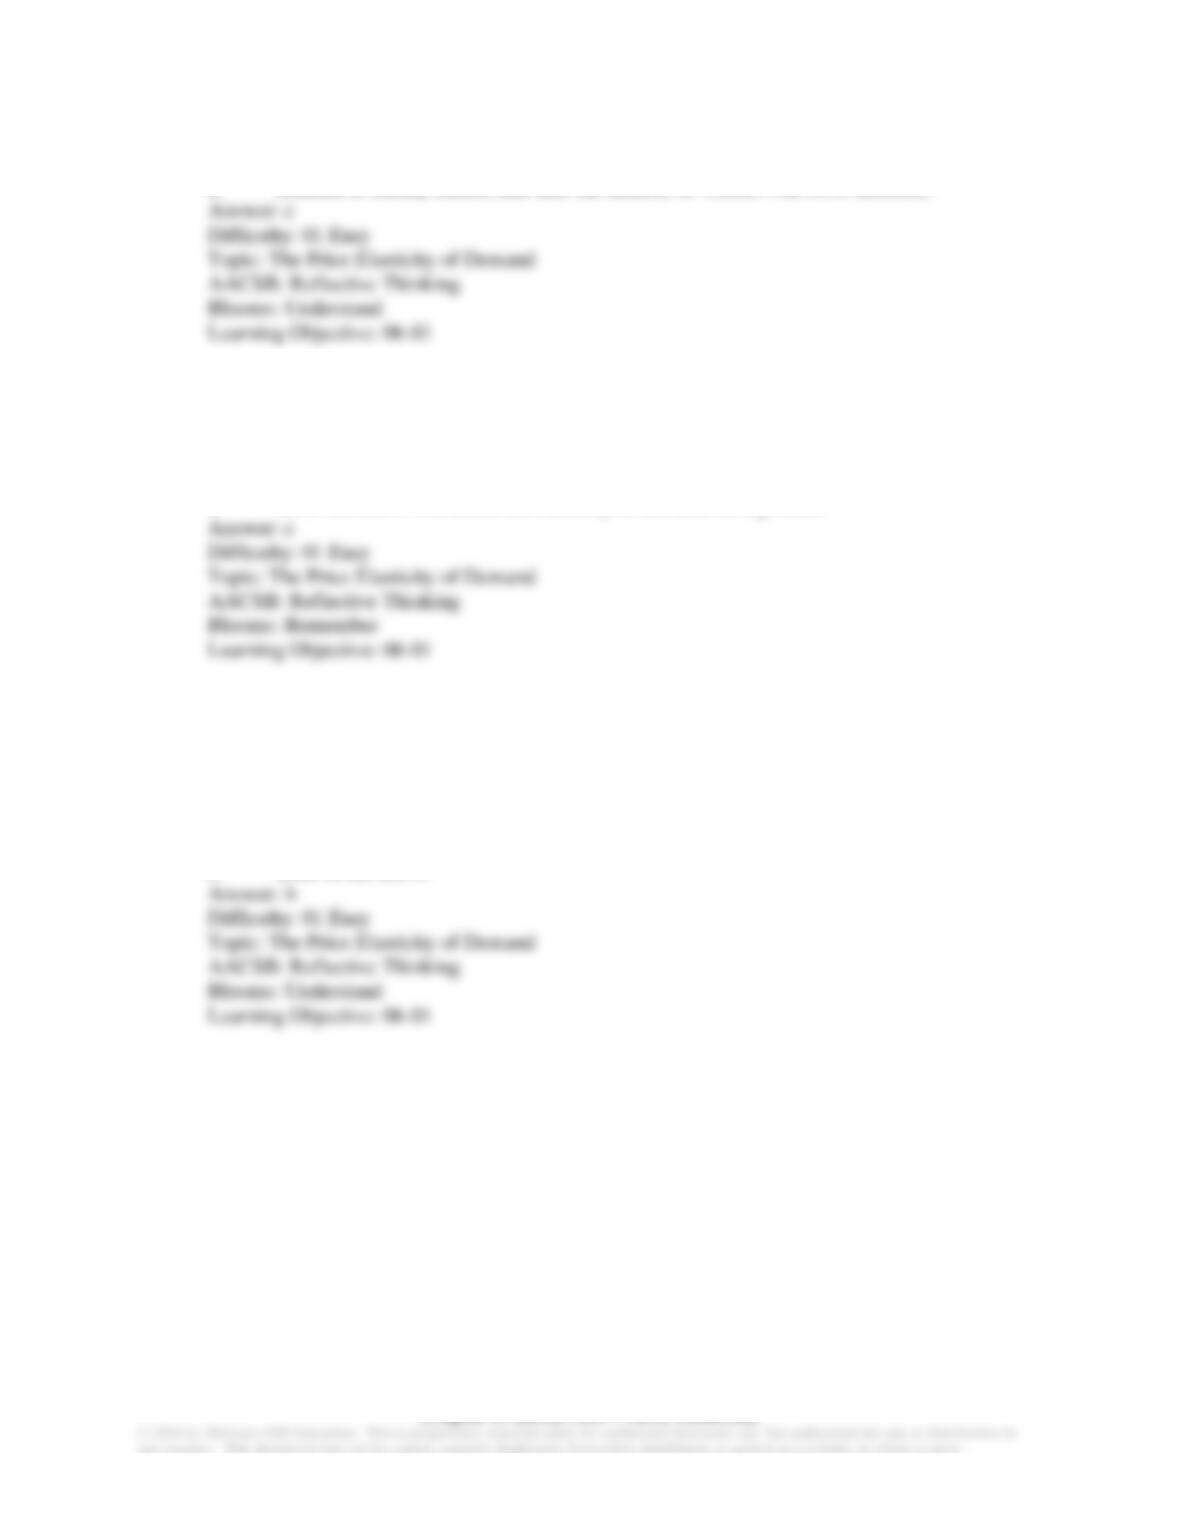
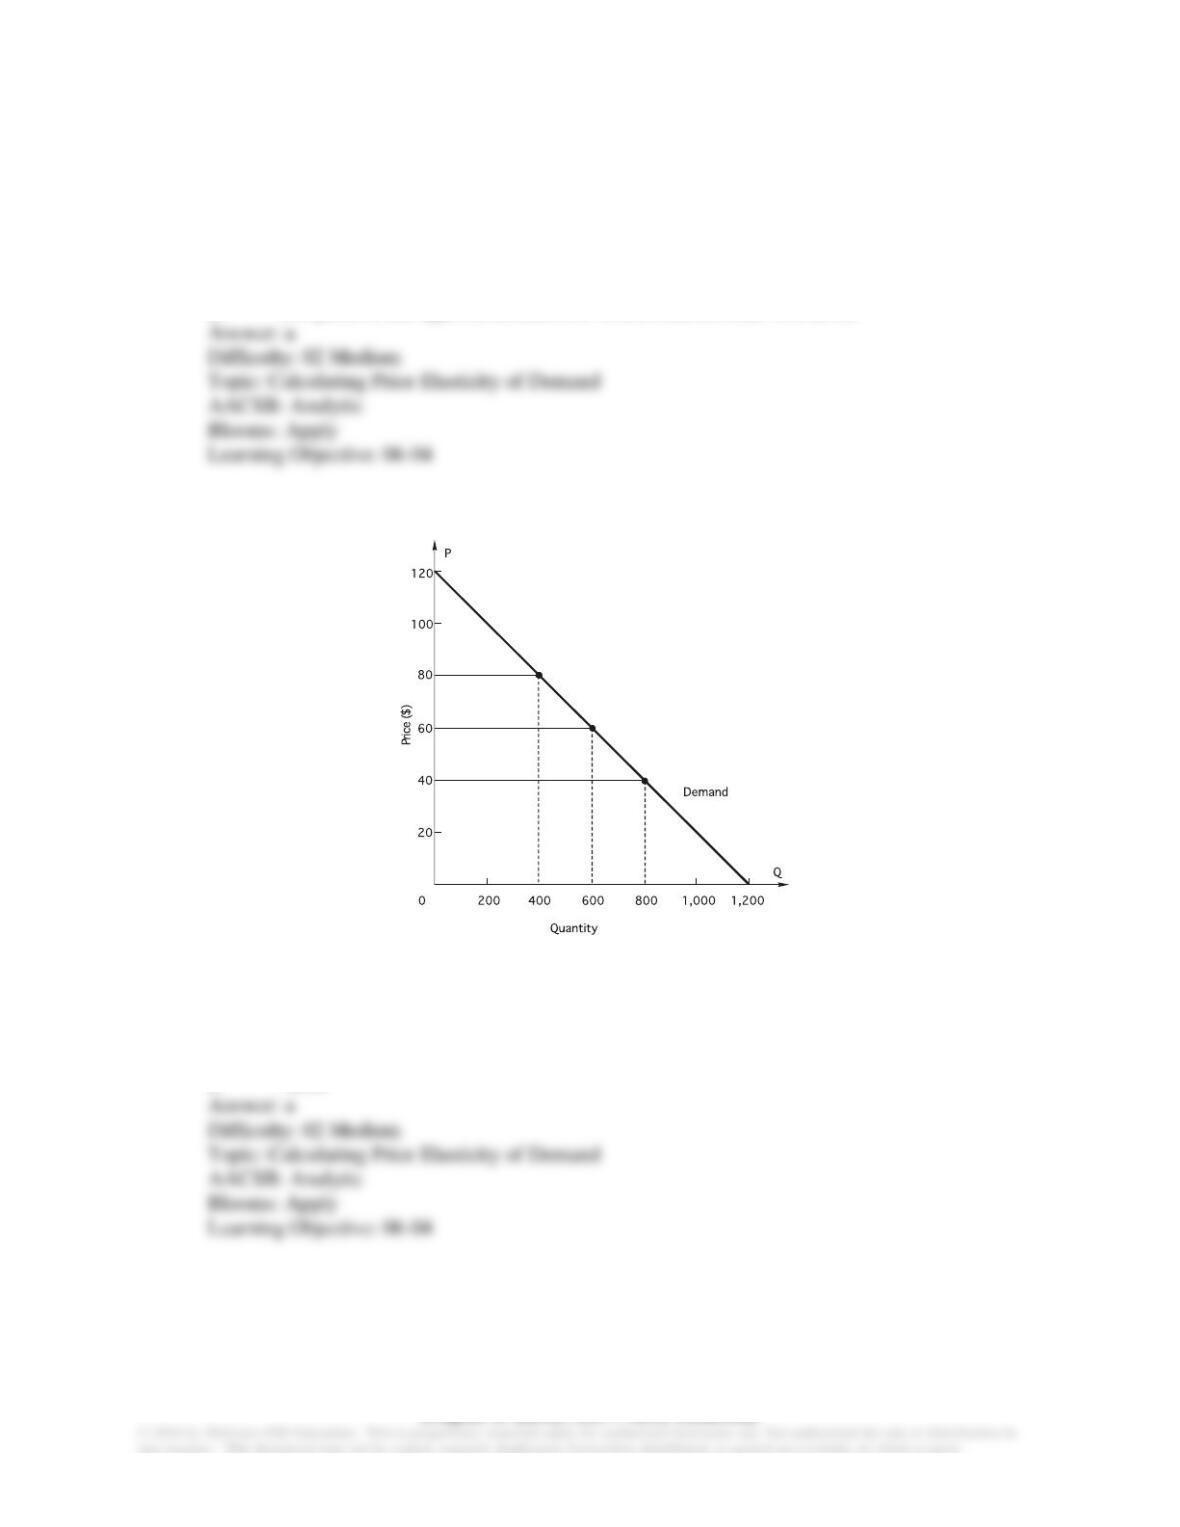
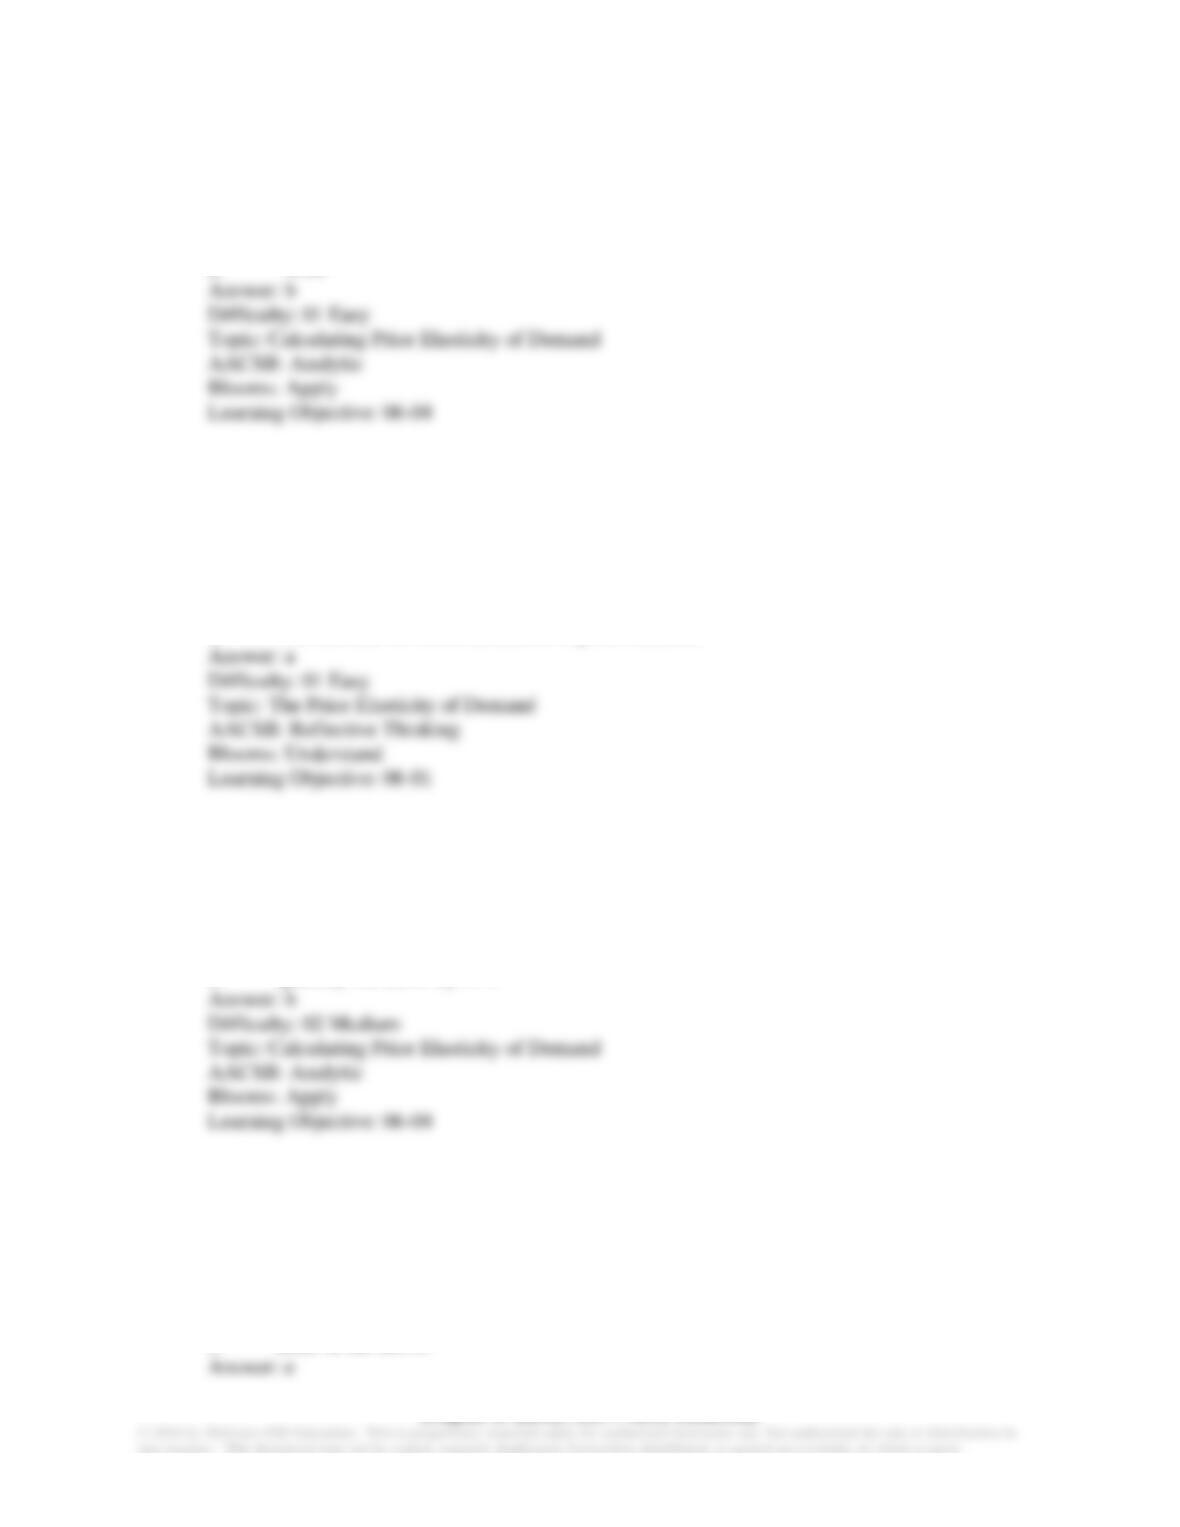
6-9
In the figure above, what is the point price elasticity of demand when price is $60?
a. −0.50
b. −0.75
c. −1.00
d. −1.60
e. −2.00
6-10
Chapter 6: ELASTICITY AND DEMAND
In the figure above, what is the point price elasticity of demand when price is $80?
a. −0.50
b. −0.75
c. −1.00
d. −1.60
e. −2.00
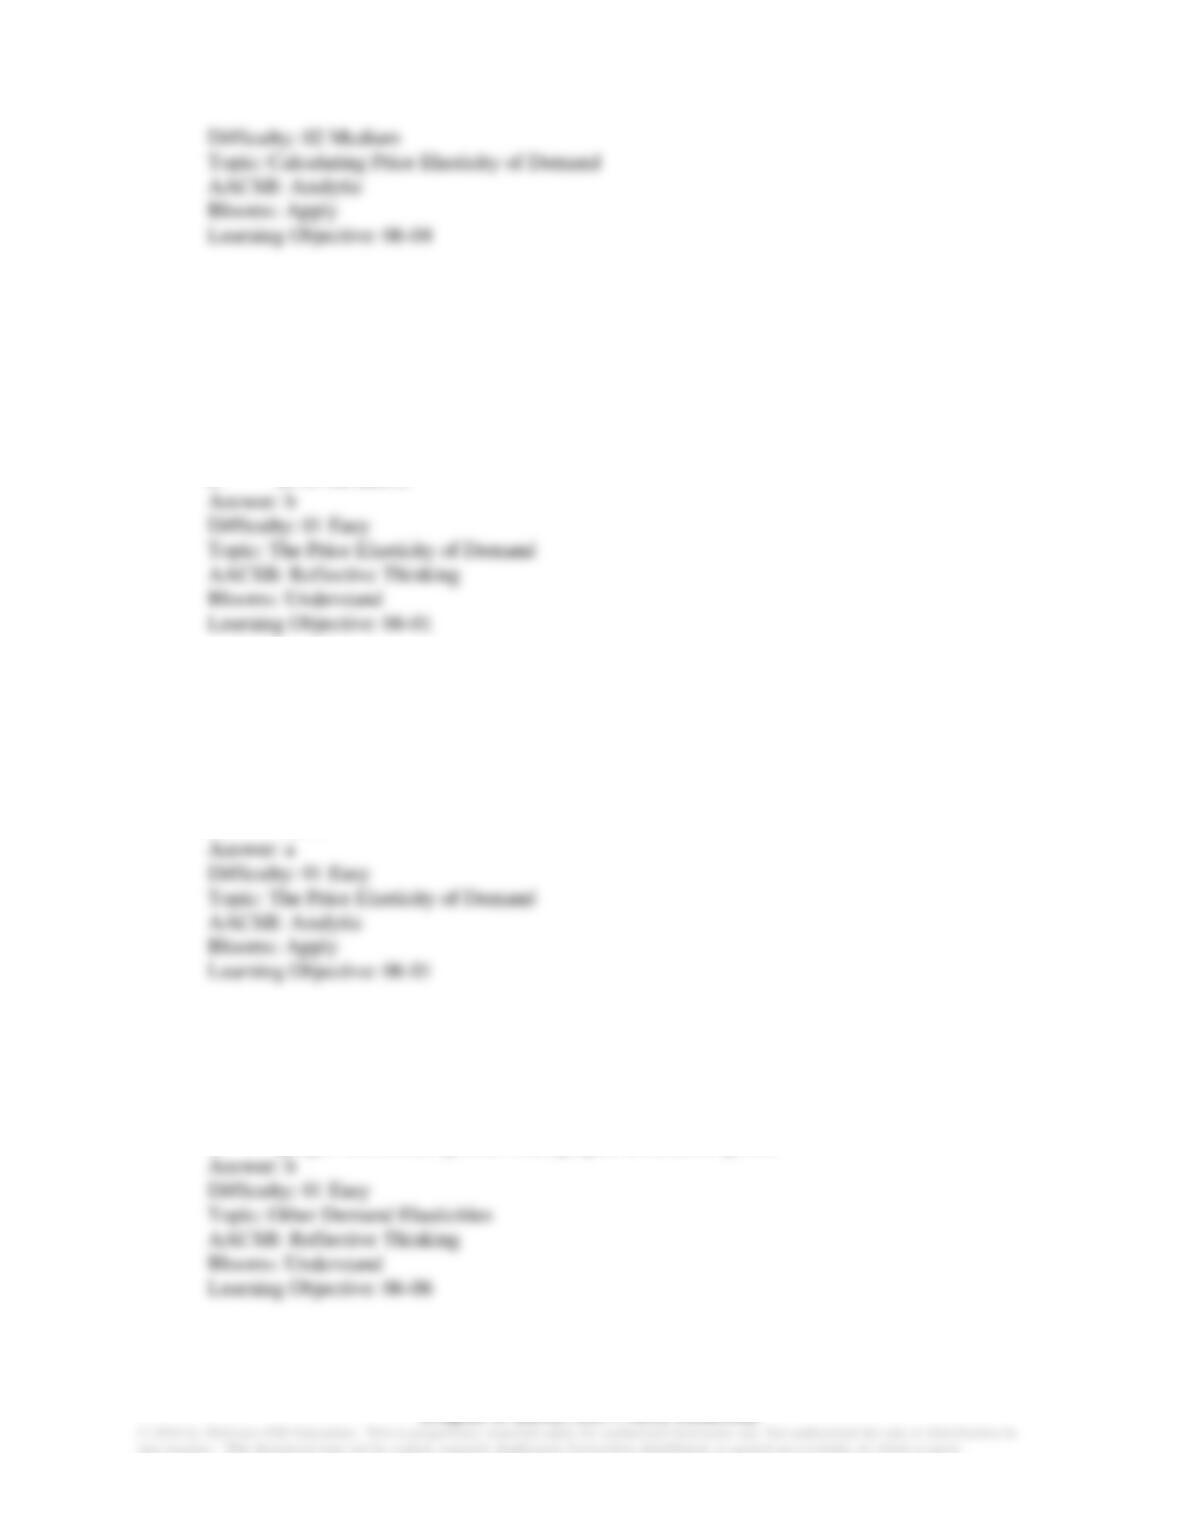
6-11
In the figure above, what is the interval elasticity of demand over the price range $60 to $80?
a. −0.75
b. −1.10
c. −1.00
d. −1.40
e. −2.00
Chapter 6: ELASTICITY AND DEMAND
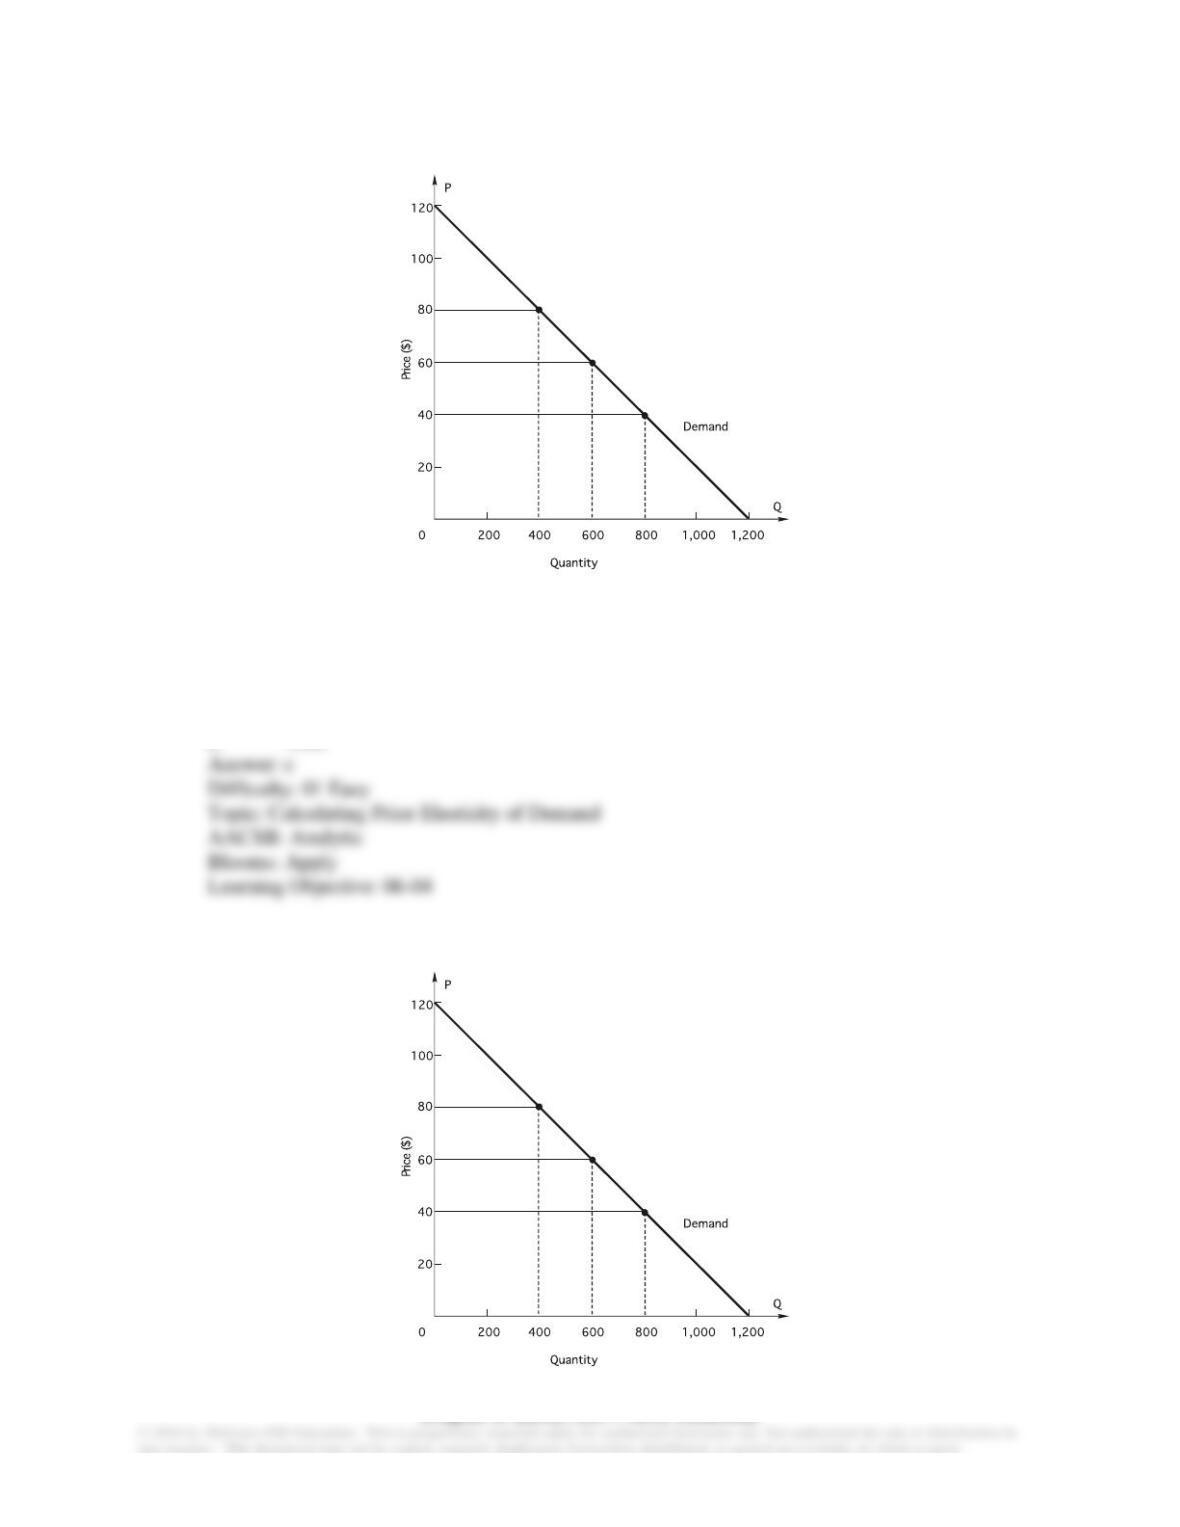
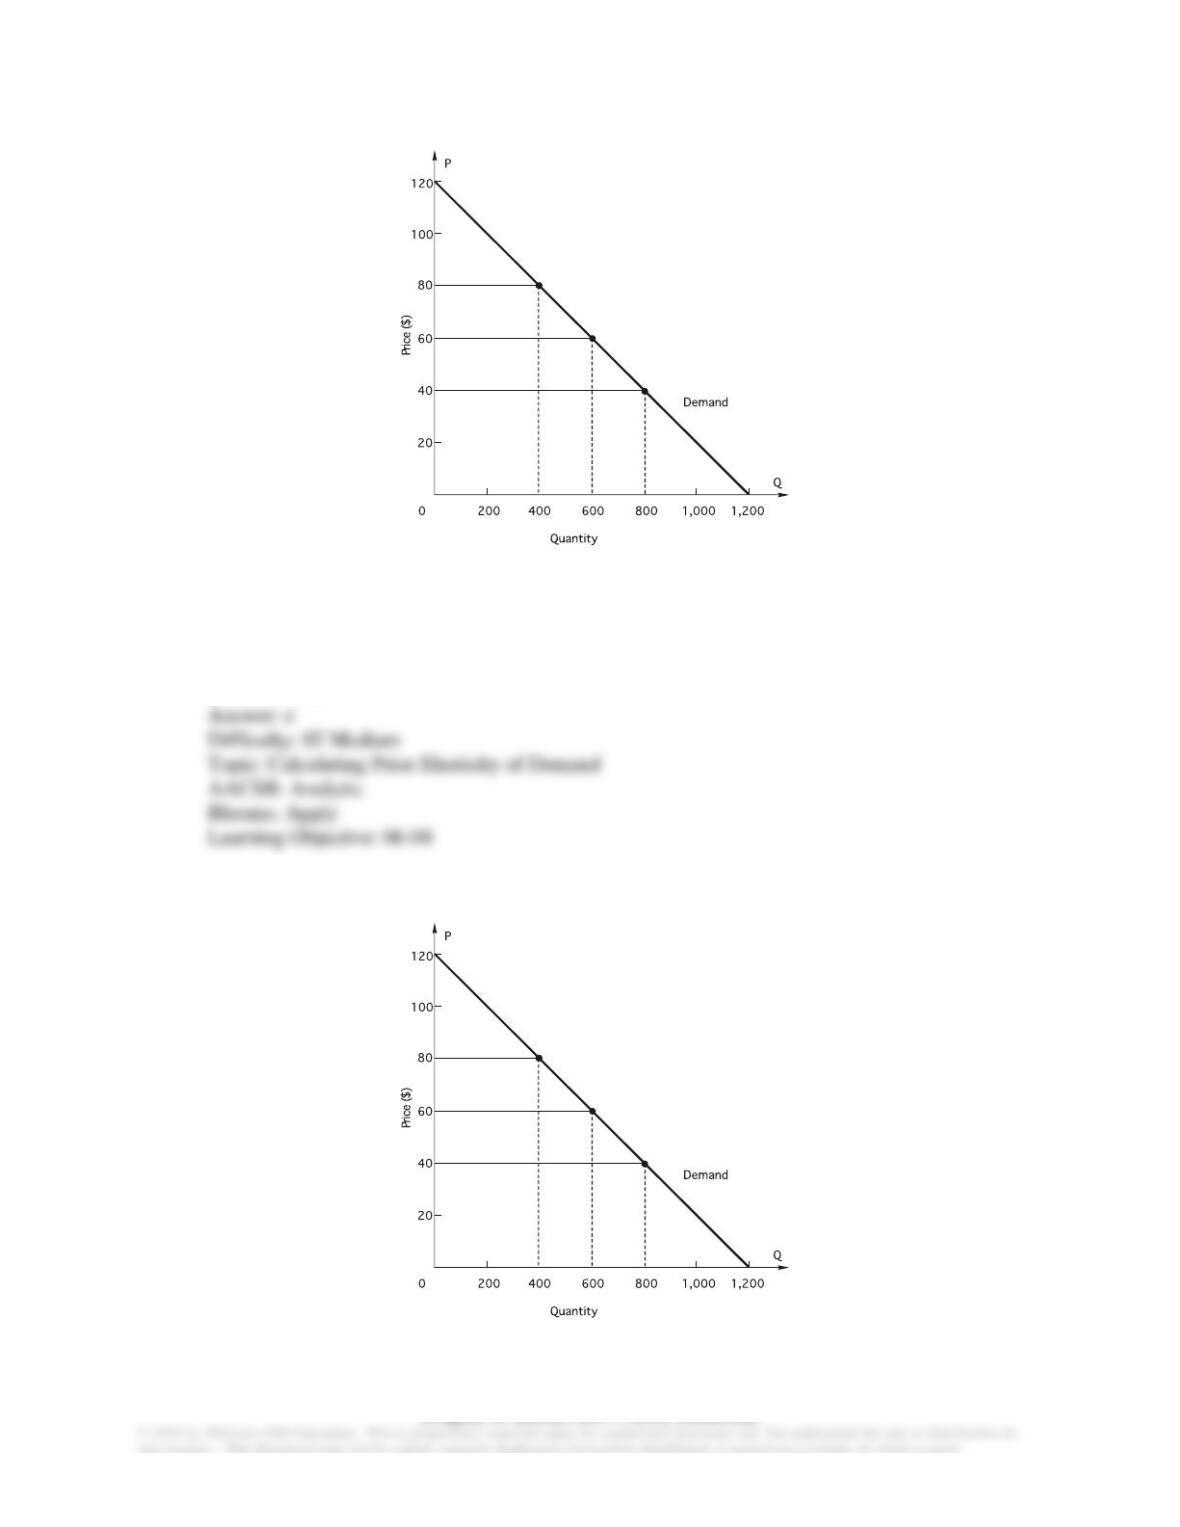
6-12
In the figure above, if price INCREASES from $60 to $80, an arrow representing the PRICE
effect
a. will point upward.
b. will point downward.
c. will be longer than (and in opposite direction of) the arrow representing the quantity
effect.
d. will be shorter than (and in the opposite direction of) the arrow representing the quantity
effect.
e. both a and d
6-13
Chapter 6: ELASTICITY AND DEMAND
In the figure above, if price DECREASES from $80 to $60, an arrow representing the
QUANTITY effect
a. will point upward.
b. will point downward.
c. will be shorter than (and in the opposite direction of) the arrow representing the price
effect.
d. will be shorter than (and in the same direction of) the arrow representing the price effect.
e. will point in the opposite direction in which total revenue will move.
6-14
In the figure above, what is the point price elasticity of demand when price is $40?
a. −0.50
b. −0.75
c. −1.00
d. −1.50
e. −2.00
Chapter 6: ELASTICITY AND DEMAND
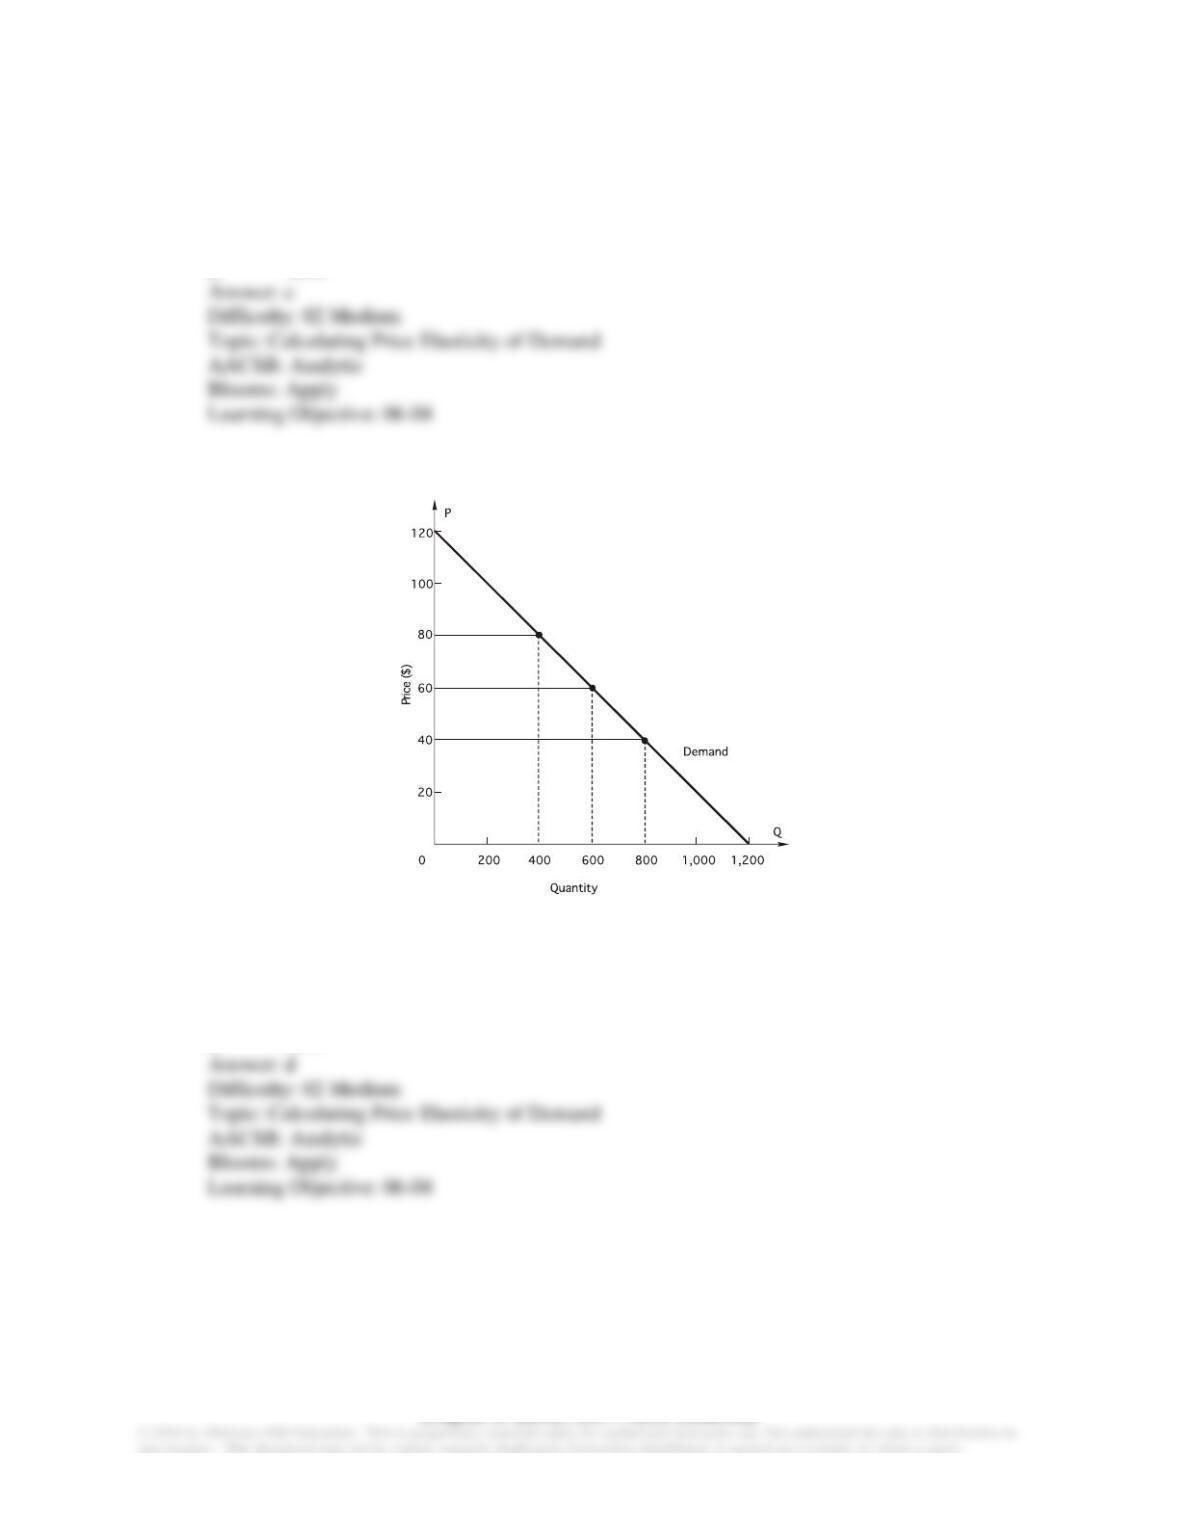
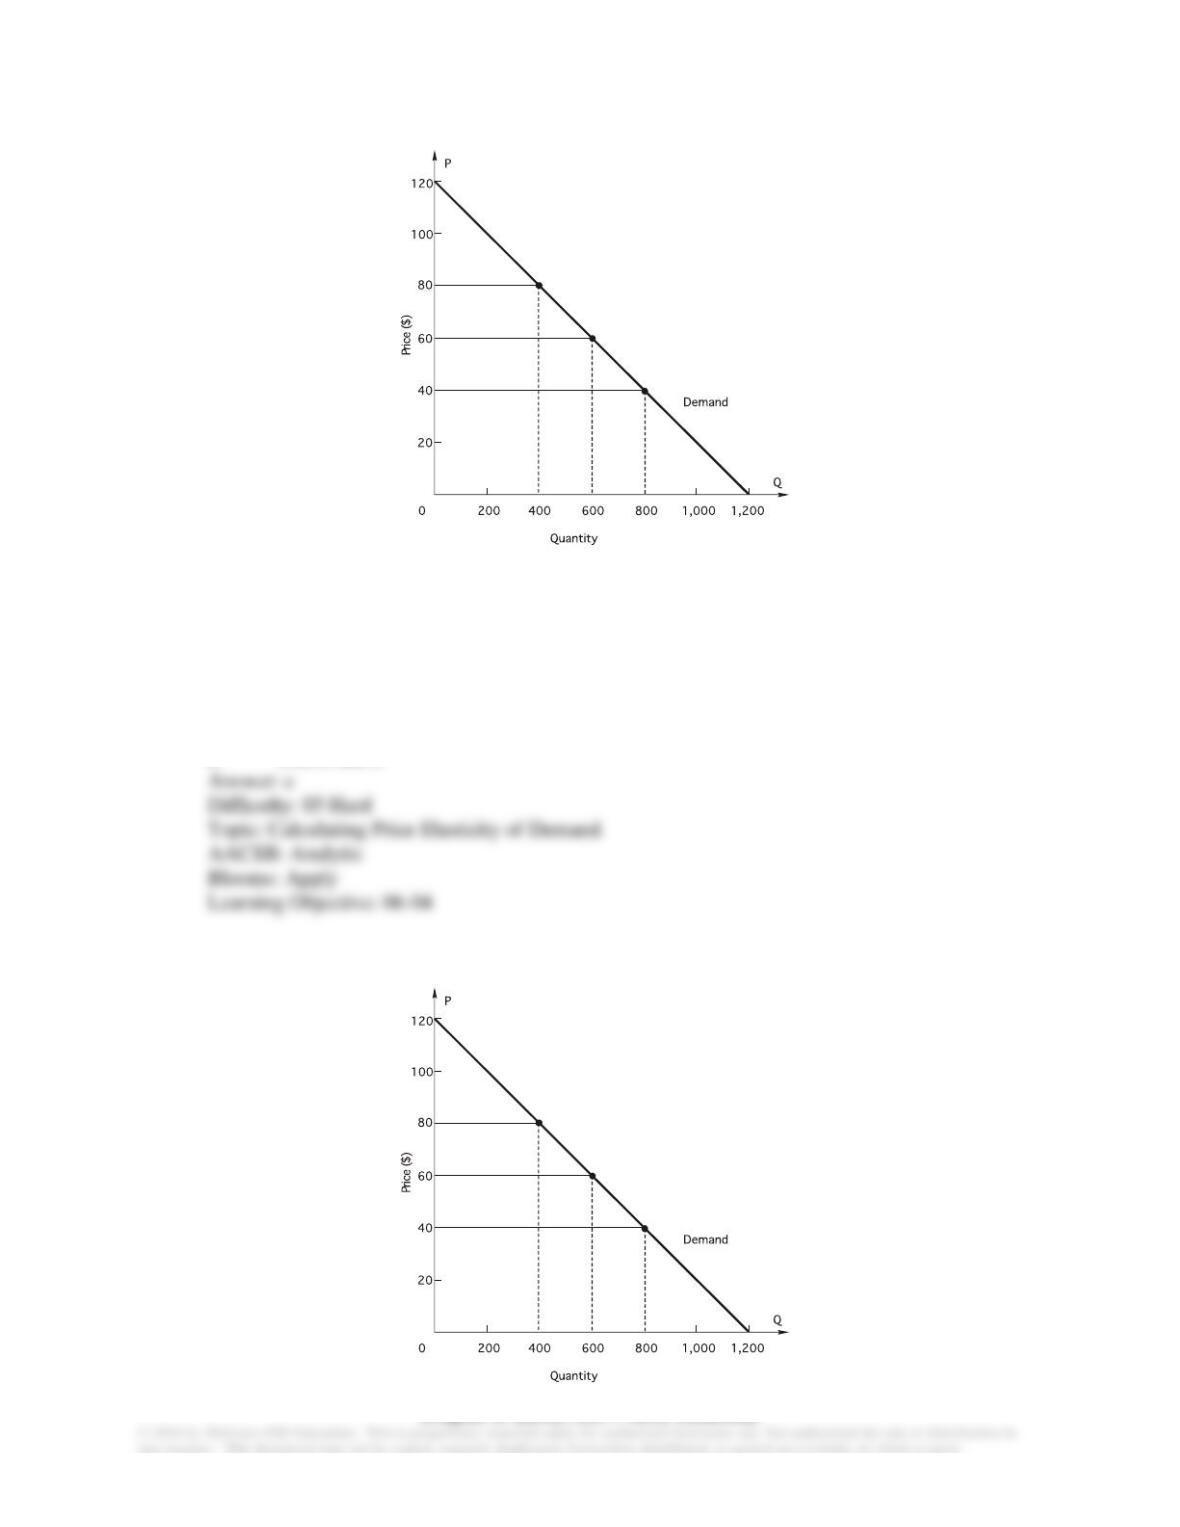
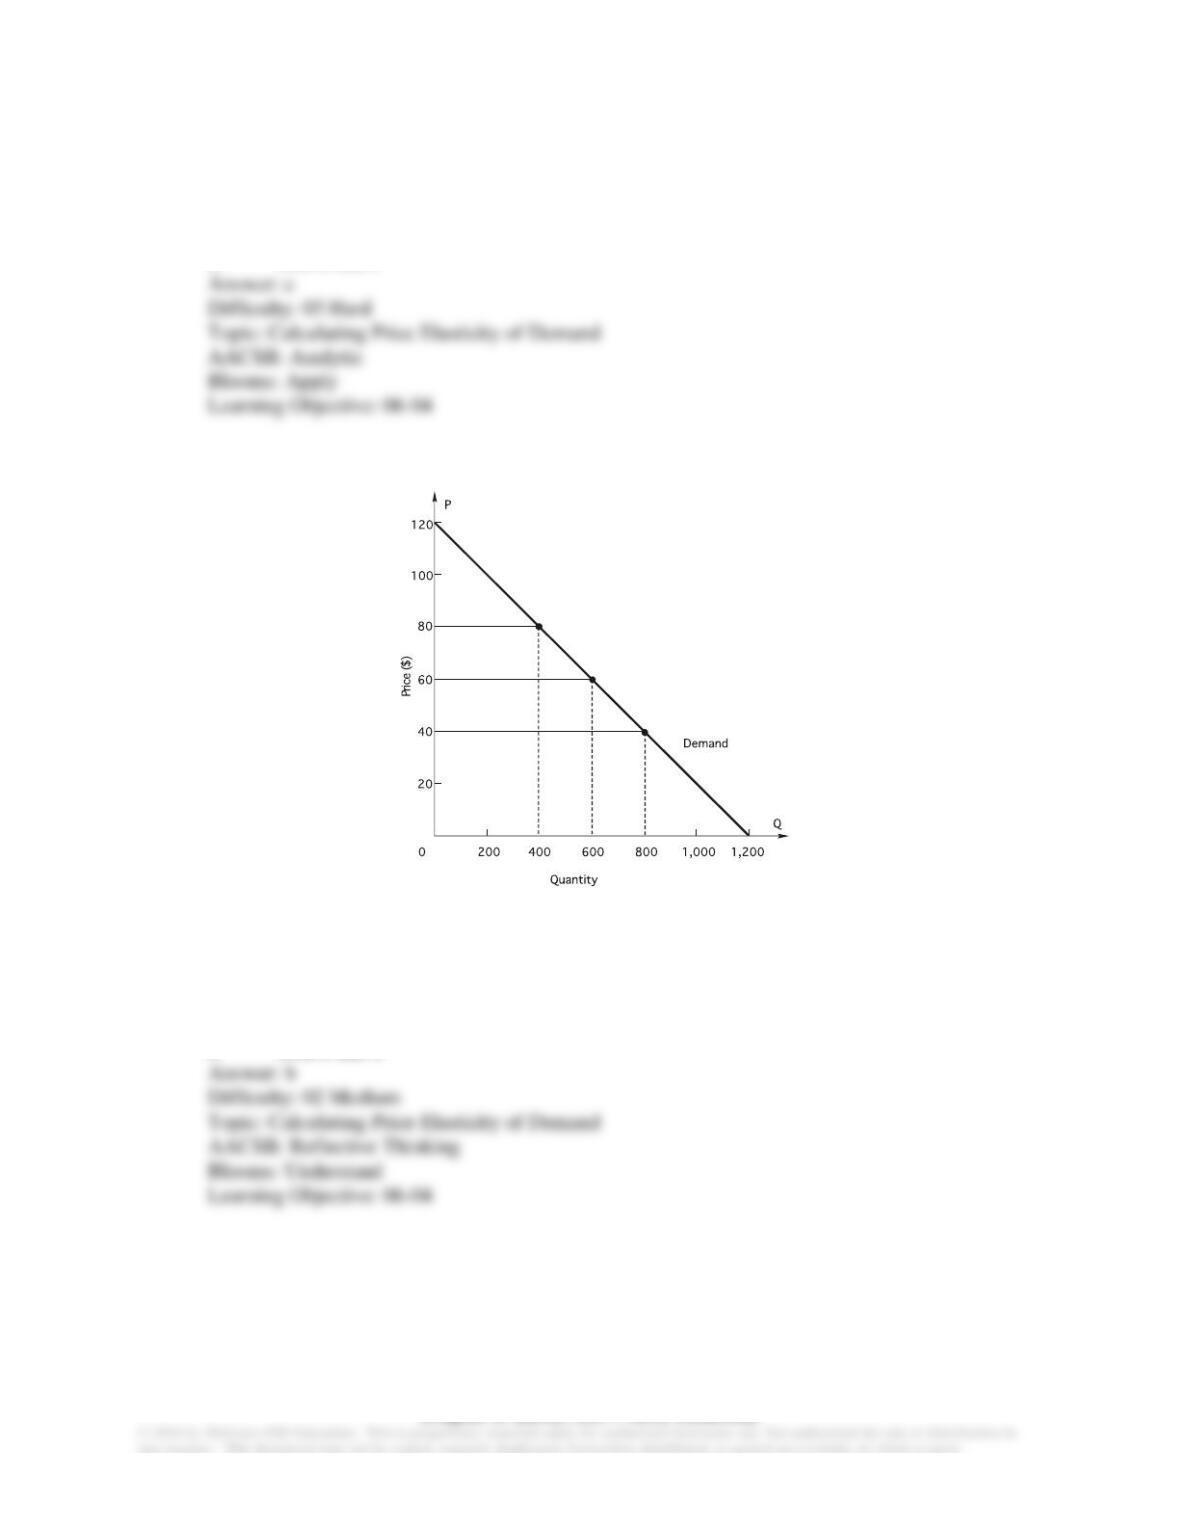
6-15
In the figure above, what is demand elasticity over the price range $40 to $60?
a. −2.00
b. −1.00
c. −0.50
d. −0.95
e. −0.71
6-16
In the figure above, if price INCREASES from $40 to $60, an arrow representing the PRICE
effect
a. will point upward.
Chapter 6: ELASTICITY AND DEMAND
b. will point downward.
c. will be longer than (and in opposite direction of) the arrow representing the quantity
effect.
d. will be shorter than (and in the opposite direction of) the arrow representing the quantity
effect.
e. both a and c
6-17
In the figure above, if price DECREASES from $60 to $40, an arrow representing the
QUANTITY effect
a. will point downward.
b. will be shorter than (and in opposite direction of) the arrow representing the price effect.
c. will be shorter than (and in same direction of) the arrow representing the price effect.
d. will point in the direction in which total revenue will move.
e. both a and d
6-18 The cross-price elasticity of demand between goods X and Y
a. measures the responsiveness of the quantity of X demanded to changes in the price of Y.
b. is the percentage change in the price of Y divided by the percentage change in the
quantity of X demanded.
c. is greater than zero if X and Y are substitutes.
d. both a and c
Chapter 6: ELASTICITY AND DEMAND
e. all of the above
6-19 Marginal revenue
a. is the change in total revenue when output increases by one unit.
b. is always greater than zero.
c. measures the slope of the total revenue curve.
d. both a and c
e. all of the above
6-20 When marginal revenue is positive,
a. demand is elastic.
b. marginal revenue is greater than price.
c. decreasing price will decrease total revenue.
d. both b and c
e. all of the above
Chapter 6: ELASTICITY AND DEMAND
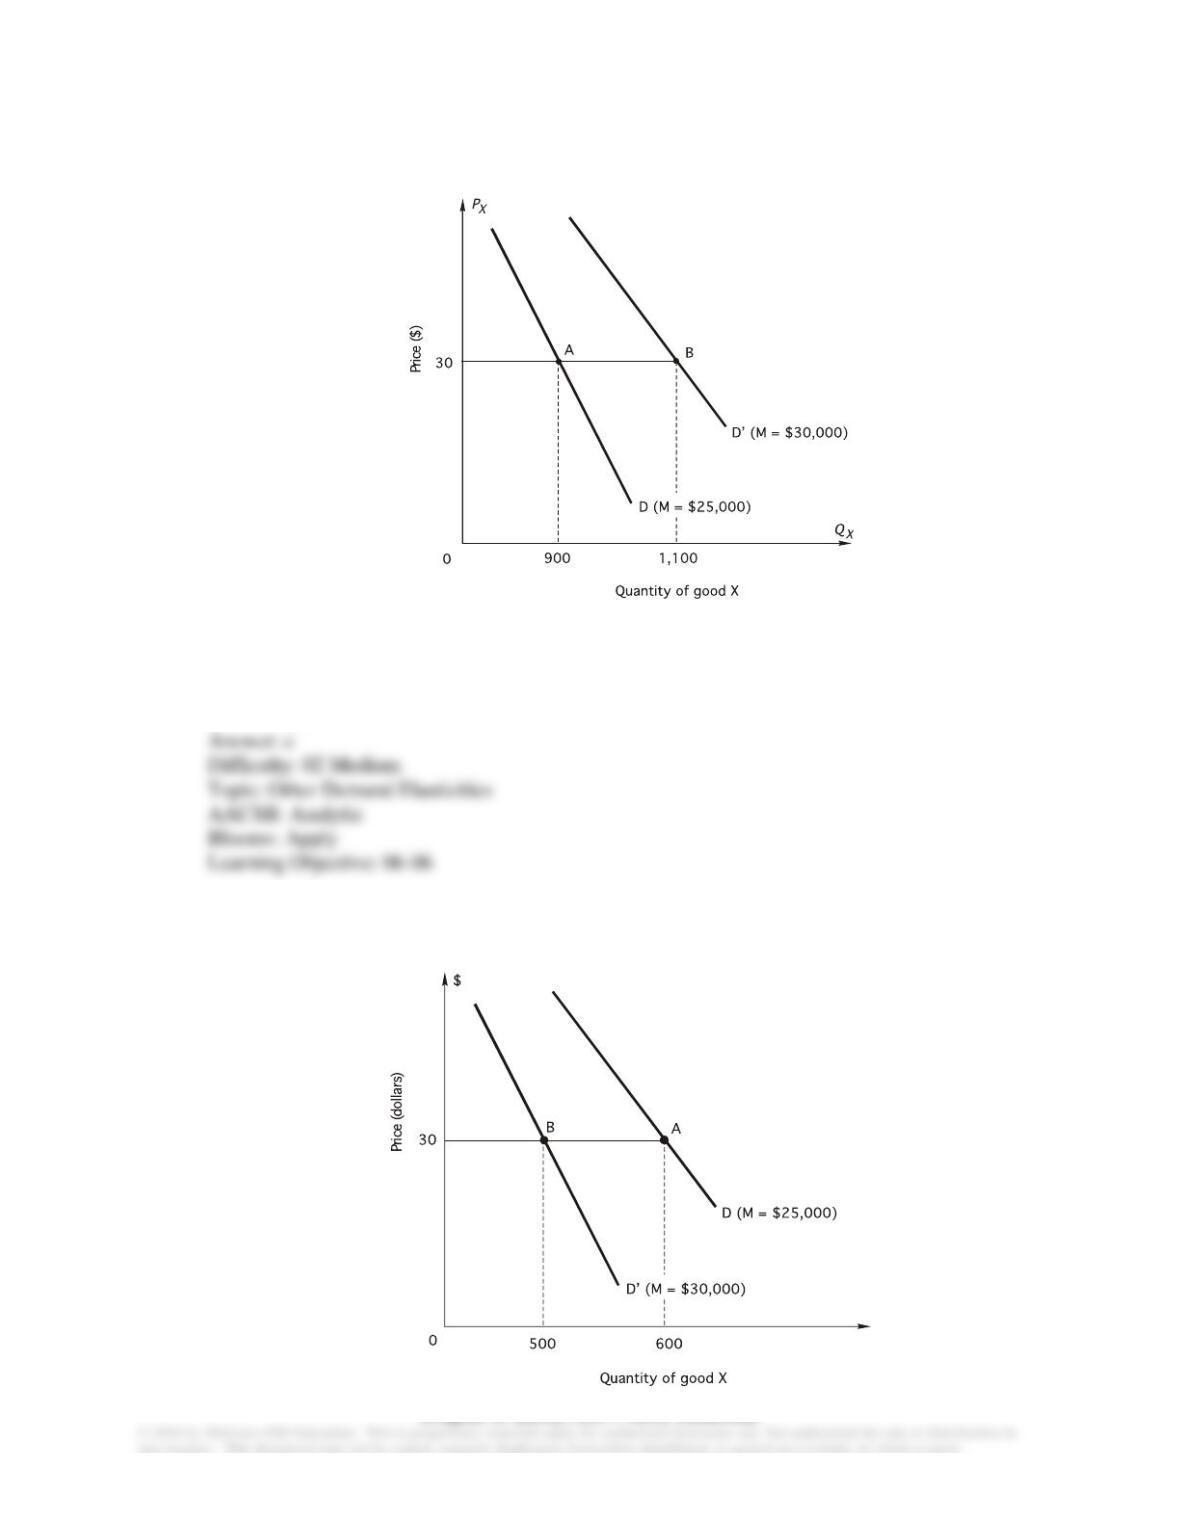
6-21 Use the figure to calculate the income elasticity of demand when income increases from $25,000
to $30,000:
a. −0.10
b. −1.10
c. 0.1818
d. 0.20
e. 1.10
6-22 Use the figure to calculate the income elasticity of demand when income increases from $25,000
to $30,000:
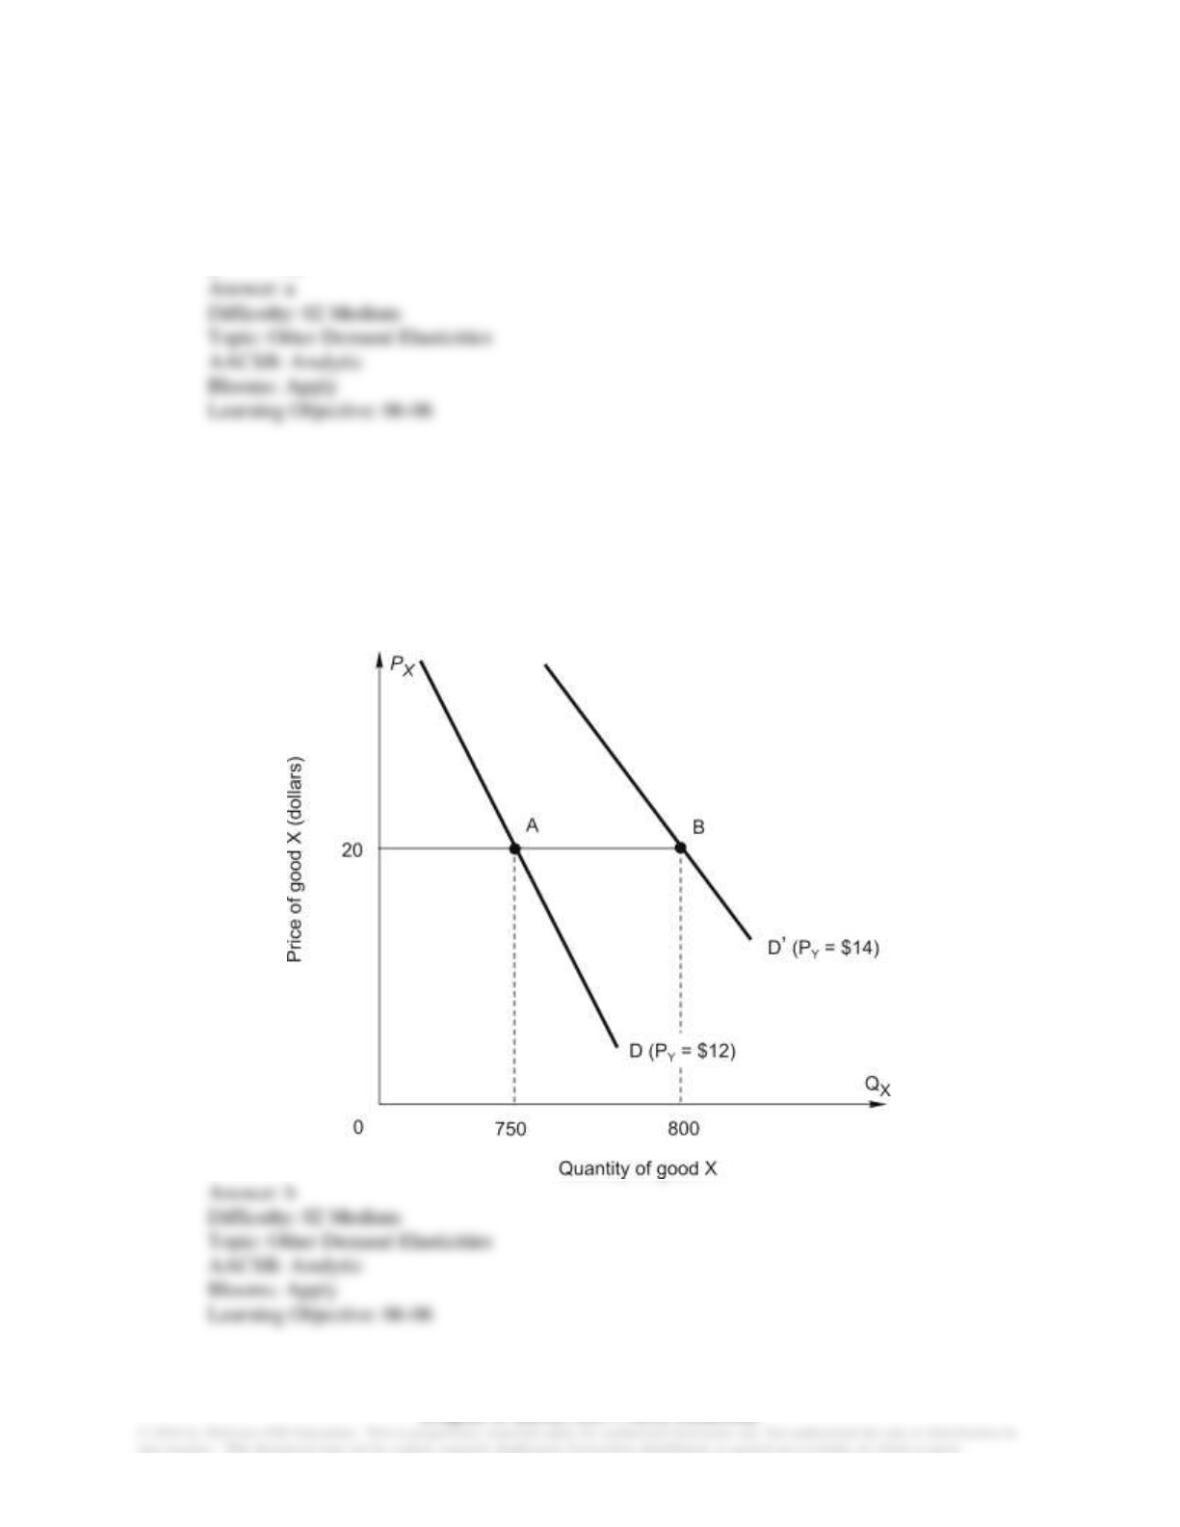
Chapter 6: ELASTICITY AND DEMAND
a. −1.0
b. −0.1818
c. 0.1818
d. −1.5
e. 1.2
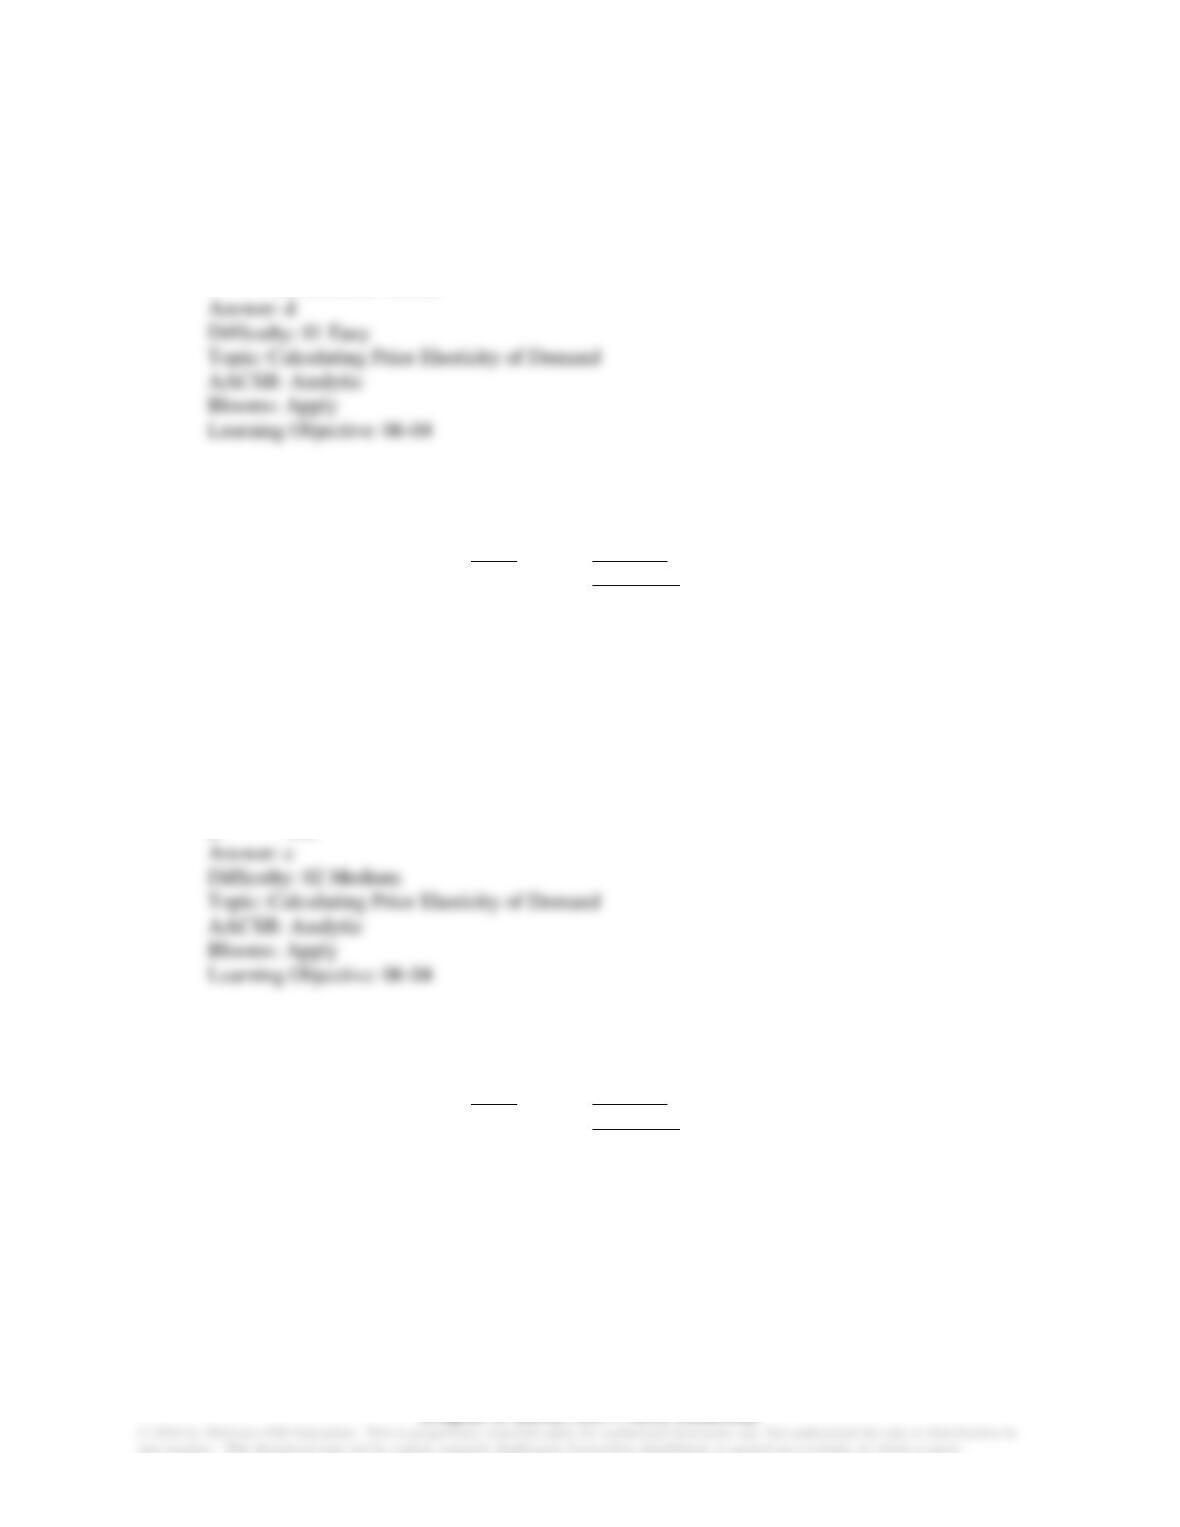
6-23 Use the figure below to calculate the cross-price elasticity of demand for good X when the price
of good Y increases from $12 to $14:
a. 0.64
b. 0.42
c. 0.20
d. 2.00
e. 15.38
Chapter 6: ELASTICITY AND DEMAND
6-24 When demand is inelastic,
a. quantity sold does not increase when price decreases.
b. selling one more unit of output causes marginal revenue to increase.
c. selling one more unit of output cause total revenue to increase.
d. buyers are not very responsive to changes in the price of the product.
e. the percentage change in quantity demanded will exceed the percentage change in price
(in absolute value).
6-25 To answer the question, refer to the following table showing a demand schedule:
Price
Quantity
demanded
$200
1000
150
1400
100
1800
If price falls from $200 to $150, what is the elasticity of demand over this range?
a. −0.62
b. −1.0
c. −1.17
d. −2.5
e. −3.0
6-26 To answer the question, refer to the following table showing a demand schedule:
Price
Quantity
demanded
$200
1000
150
1400
100
1800
As output increases from 1,000 to 1,400 what is marginal revenue?
a. $25
b. $50
c. –$400
d. −$25
e. −$75
Chapter 6: ELASTICITY AND DEMAND
6-27 To answer the question, refer to the following table showing a demand schedule:
Price
Quantity
demanded
$200
1000
150
1400
100
1800
If price falls from $200 to $150,
a. arrows representing the price and quantity effects both point down.
b. an arrow representing the price effect points down and is longer than an arrow for the
quantity effect.
c. an arrow representing the price effect points down and is shorter than an arrow for the
quantity effect.
d. arrows representing the price and quantity effects both point up.
e. total revenue moves in the same direction as the arrow representing the price effect.
6-28 To answer the question, refer to the following table showing a demand schedule:
Price
Quantity
demanded
$200
1000
150
1400
100
1800
If price falls from $150 to $100, what is the elasticity of demand over this range?
a. −0.625
b. −1.0
c. −1.17
d. −2.5
e. −3.0
Chapter 6: ELASTICITY AND DEMAND
6-29 To answer the question, refer to the following table showing a demand schedule:
Price
Quantity
demanded
$200
1000
150
1400
100
1800
As quantity demanded rises from 1,400 to 1,800, what is marginal revenue?
a. $25
b. $50
c. −$400
d. −$50
e. −$75
6-30 To answer the question, refer to the following table showing a demand schedule:
Price
Quantity
demanded
$200
1000
150
1400
100
1800
If price falls from $200 to $150,
a. arrows representing the price and quantity effects both point down.
b. an arrow representing the price effect points down and is longer than an arrow for the
quantity effect.
c. an arrow representing the quantity effect points up and is shorter than an arrow for the
price effect.
d. arrows representing the price and quantity effects both point up.
e. total revenue moves in the same direction as the arrow representing the quantity effect.
Chapter 6: ELASTICITY AND DEMAND
6-31 To answer the question, refer to the following table showing a demand schedule:
Price
Quantity
demanded
$200
1000
150
1400
100
1800
If price falls from $150 to $100,
a. arrows representing the price and quantity effects both point down.
b. an arrow representing the price effect points down and is shorter than an arrow for the
quantity effect.
c. total revenue moves in the same direction as the arrow representing the price effect.
d. the arrow representing the price effect points down and the arrow representing the
quantity effect points up.
e. both c and d
6-32 To answer the question, refer to the following table showing a demand schedule:
Price
Quantity
demanded
$200
1000
150
1400
100
1800
If price rises from $100 to $150,
a. arrows representing the price and quantity effects both point upward.
b. an arrow representing the price effect points upward and is shorter than an arrow for the
quantity effect, which points downward.
c. total revenue moves up as indicated by the direction of the arrow representing the price
effect.
d. the arrow representing the price effect points down and the arrow representing the
quantity effect points up.
e. both c and d
Chapter 6: ELASTICITY AND DEMAND
6-33 When the price of corn dogs is $0.50, 10,000 corn dogs are demanded. When the price of corn
dogs is $1.20, 5,000 are demanded. What is the price elasticity of demand for corn dogs?
a. −0.40
b. −0.81
c. −1.20
d. −1.40
6-34 Suppose that the Houston Rockets’ management is considering a plan in which fans who donate
blood can attend games for $35 instead of the usual $50. If both ticket revenues and blood
donations rise with this plan, which of the following is true?
a. The demand for Houston Rockets’ tickets is price elastic.
b. The demand for Houston Rockets’ tickets is price inelastic.
c. The demand for blood donations is price elastic.
d. The demand for blood donations is price inelastic.
6-35 If the price elasticity of DVD recorders is −0.3 and price increases 20%, what happens to the
quantity of DVD recorders demanded?
a. quantity decreases by 26%
b. quantity decreases by 6%
c. quantity increases by 15%
d. quantity increases by 21%
6-36 If the price elasticity of demand for a good is −0.8 and quantity demanded decreases by 40%,
price must have
a. increased by 5%.
b. increased by 32%.
c. decreased by 20%.
d. decreased by 32%.
e. none of the above
Chapter 6: ELASTICITY AND DEMAND
6-37 The demand for heart surgery is price inelastic. So it follows that
a. the percentage change in price is less than the resulting percentage change in quantity
demanded.
b. if the price of heart surgery increases, total expenditure by consumers on heart surgery
will rise.
c. changes in price do not affect the number of operations demanded.
d. both a and b
e. all of the above
6-38 If the quantity of Harley-Davidson motorcycles demanded decreases by 10% when the price
increases by 20%, the price elasticity of demand for Harley-Davidson motorcycles is:
a. −0.50
b. −2.0
c. −10.0
d. −20.0
6-39 If the quantity of gidgets demanded increases when the price of gadgets decreases
a. gidgets and gadgets are substitutes.
b. gidgets and gadgets are complements.
c. gidgets are normal goods, while gadgets are inferior goods.
d. gadgets are normal goods, while gidgets are inferior goods.