
Macroeconomics, 12e (Parkin)
Chapter 6 Economic Growth
1 The Basics of Economic Growth
1) The best definition for economic growth is
A) a sustained expansion of production possibilities measured as the increase in real GDP over a
given period.
B) a sustained expansion of production possibilities measured as the increase in nominal GDP
over a given period.
C) a sustained expansion of consumption goods over a given period.
D) a sustained expansion of production goods over a given period.
2) Economic growth is measured by
A) changes in real GDP.
B) changes in nominal GDP.
C) changes in the employment rate.
D) All of the above are used to measure economic growth.
3) We are interested in long-term growth primarily because it brings
A) higher price levels.
B) lower price levels.
C) higher standards of living.
D) trade wars with our trading partners.
4) If a nation’s population grows, then
A) growth in real GDP per person will be less than the growth of real GDP.
B) there can be no economic growth.
C) growth in real GDP per person will be greater than the growth of real GDP.
D) there must be an increase in real GDP per person.

2
5) In 2011, Armenia had a real GDP of $4.21 billion and a population of 2.98 million. In 2012,
real GDP was $4.59 billion and population was 2.97 million. What was Armenia’s economic
growth rate from 2011 to 2012?
A) 0.38 percent
B) 9.0 percent
C) 3.8 percent
D) 8.3 percent
6) In 2011, Armenia had a real GDP of approximately $4.21 billion and a population of 2.98
million. In 2012, real GDP was $4.59 billion and population was 2.97 million. From 2011 to
2012, Armenia’s standard of living ________.
A) increased
B) decreased
C) did not change
D) might have increased, decreased, or remained unchanged but more information is needed to
determine which
7) In 2011, Armenia had a real GDP of approximately $4.21 billion and a population of 2.98
million. In 2012, real GDP was $4.59 billion and population was 2.97 million. Armenia’s real
GDP per person in 2012 was
A) $1,545.
B) $380.
C) $1,413.

8) During 2014, the country of Economia had a real GDP of $115 billion and the population was
0.9 billion. In 2013, real GDP was 105 billion and the population was 0.85 billion. In 2014, real
GDP per person was
A) $128.
B) $124.
C) $135.
D) $117.
9) During 2014, the country of Economia had a real GDP of $115 billion and the population was
0.9 billion. In 2013, real GDP was 105 billion and the population was 0.85 billion. In 2013, real
GDP per person was
A) $128.
B) $124.
C) $135.
D) $117.
10) Suppose real GDP for a country is $13 trillion in 2015, $14 trillion in 2016, $15 trillion in
2017, and $16 trillion in 2018. Over this time period, the real GDP growth rate is
A) increasing.
B) decreasing.
C) constant.
D) negative.
11) Suppose that in 2015 a country has a population of 1 million and real GDP of $1 billion. In
2016, the population is 1.1 million and the real GDP is $1.1 billion. The real GDP per person
growth rate is
A) $1000.
B) positive.
C) negative.
D) zero.

12) During 2013, the country of Economia had a real GDP of $115 billion and the population
was 0.9 billion. In 2012, real GDP was 105 billion and the population was 0.85 billion.
Economia’s growth rate of real GDP per person is
A) 3.23 percent.
B) 5 percent.
C) 5.88 percent.
D) 9.52 percent.
13) Suppose a nation’s population grows by 2 percent and, at the same time, its GDP grows by 5
percent. Approximately how fast will real GDP per person increase?
A) 3 percent per year
B) 2 percent per year
C) 5 percent per year
D) 10 percent per year
14) Which of the following is used to calculate the standard of living?
A) real GDP/population
B) ((real GDP in the current year – real GDP in previous year)/real GDP in previous year) × 100
C) the one-third rule
D) real GDP/aggregate hours
15) According to the Economic Times (09/2012), Standard & Poor’s forecast for India’s GDP
growth rate was cut by 1 percentage point to 5.5 percent as the entire Asia Pacific region feels
the pressure of ongoing economic uncertainty. India has averaged 7 percent growth in GDP since
1997. Which of the following is TRUE?
A) India’s PPF has been shifting rightward since 1997.
B) India’s PPF has been shifting leftward since 1997.
C) India has been moving from a point within its PPF to points beyond its PPF.
D) India’s PPF has not shifted since 1997.

16) According to the Economic Times (09/2012), Standard & Poor’s forecast for India’s GDP
growth rate was cut by 1 percentage point to 5.5 percent as the entire Asia Pacific region feels
the pressure of ongoing economic uncertainty. India has averaged 7 percent growth in GDP since
1997. Based on this story, it is most likely that the slowdown reflects a
A) temporary business cycle slowdown.
B) temporary business cycle expansion.
C) change to India’s long-term economic growth rate.
D) shrinkage of India’s economy.
17) The Rule of 70 is used to
A) estimate how much of an economy’s growth rate is due to increases in capital per hour of
labor.
B) calculate the standard of living.
C) calculate the economy’s growth rate.
D) estimate how long it will take the level of any variable to double.
18) Using the Rule of 70, if China’s current growth rate of real GDP per person was 7 percent a
year, how long would it take the country’s real GDP per person to double?
A) 35 years
B) 14 years
C) 10 years
D) 49 years
19) Using the Rule of 70, if the country of Huttodom’s current growth rate of real GDP per
person was 10 percent a year, how long would it take the country’s real GDP per person to
double?
A) 0.7 years
B) 20 years
C) 7 years
D) 10 years

20) Slowdonia’s current growth rate of real GDP per person is 2 percent a year. How long will it
take to double real GDP per person?
A) half a year
B) approximately 10 years
C) 28.6 years
D) 35 years
21) Slowdonia’s current growth rate of real GDP per person is 1 percent a year. Approximately
how long will it take to double real GDP per person?
A) 10 years
B) 35 years
C) 70 years
D) 100 years
22) If real GDP per person is growing at 4 percent per year, approximately how many years will
it take to double?
A) 17.5
B) 25
C) 4
D) 8
23) Suppose a country is producing $20 million of real GDP. If the economy grows at 10 percent
per year, approximately how many years will to take for real GDP to grow to $80 million?
A) 14
B) 7
C) 4
D) 30

24) Real GDP per person in the country of Flip is $10,000, and the growth rate is 10 percent a
year. Real GDP per person in the country of Flap is $20,000 and the growth rate is 5 percent a
year. When will real GDP per person be greater in Flip than in Flap?
A) in 2 years
B) in 15 years
C) never
D) in 10 years
25) According to the Economic Times (09/2012), Standard & Poor’s forecast for India’s GDP
growth rate was cut by 1 percentage point to 5.5 percent as the entire Asia Pacific region feels
the pressure of ongoing economic uncertainty. India has averaged 7 percent growth in GDP since
1997. Which of the following is TRUE?
A) India’s PPF has been shifting rightward since 1997.
B) India’s PPF has been shifting leftward since 1997.
C) India has been moving from a point within its PPF to points beyond its PPF.
D) India’s PPF has not shifted since 1997.
26) According to the Economic Times (09/2012), Standard & Poor’s forecast for India’s GDP
growth rate was cut by 1 percentage point to 5.5 percent as the entire Asia Pacific region feels
the pressure of ongoing economic uncertainty. India has averaged 7 percent growth in GDP since
1997. Based on this story, it is most likely that the slowdown reflects a
A) temporary business cycle slowdown.
B) temporary business cycle expansion.
C) change to India’s long-term economic growth rate.
D) shrinkage of India’s economy.
2 Long-Term Growth Trends
1) Over the last 100 years, the average U.S. growth rate in real GDP per person was about
A) 2 percent per year.
B) 6 percent per year.
C) 12.5 percent per year.
D) 1 percent per year.
2) Over the past 100 years, real GDP per person in the United States has grown at an average of
________ percent a year.
A) 1
B) 2
C) 3
D) 4
3) The growth rate of real GDP per person in the United States has
A) averaged approximately 2 percent per year over the past century.
B) has consistently been 2 percent per decade over the past century.
C) has been the highest in the world over the past 5 decades.
D) has increased every year over the past century.
4) Over the past 100 years real GDP per person in the United States, on average, has
A) decreased by about 5 percent per year.
B) increased by about 2 percent per year.
C) increased by about 5 percent per year.
D) increased by about 10 percent per year.
5) Over the past 100 years, in the United States the average growth rate of ________ grew at a
faster rate than ________.
A) real GDP; nominal GDP
B) the population; real GDP
C) real GDP; the population
D) inflation; real GDP
6) Over the past four decades
A) the growth rate of real GDP per person in the United States has been increasing.
B) U.S. real GDP per person has fallen below that of the other rich industrial countries.
C) U.S. real GDP per person has increased.
D) Both answers A and C are correct.
7) The historical record for the United States for the past 100 years shows
A) growth in real GDP per person during most years.
B) economic growth for about half the years and economic decline for the other half.
C) growth until 1970 and then a period of constant per person real GDP.
D) continuous economic growth, although at different rates, throughout the entire century.
8) Which of following was a period of below-average economic growth in the United States?
A) the 1920s
B) the 1960s
C) the 1930s
D) all of the above
9) Which of the following statements are CORRECT?
I. The average economic growth rate in real GDP per person in the United States over the last
century was 5 percent per year.
II. The United States has the highest economic growth rate of any nation.
A) I only
B) II only
C) both I and II
D) neither I nor II
10) The historical record for the United States over the last 100 years shows
A) mostly positive economic growth, though the Great Depression caused actual GDP to dip
well below potential GDP.
B) economic growth for about half the years and economic decline for the other half.
C) growth until 1970 and then a period of constant per person real GDP.
D) continuous economic growth for each year, although at different rates, throughout the entire
century.
11) Which of the following statements regarding U.S. economic growth is NOT correct?
A) Over the past 100 years, on the average real GDP per person grew 2 percent a year.
B) The average annual growth rate of real GDP per person in the United States was rapid during
World War II.
C) In the 1930s, real GDP fell well below its trend.
D) The growth rate of real GDP per person accelerated between 1973 to 1984.
12) In 2010, of the following which nations had the highest level of real GDP per person?
A) Japan
B) Europe Big 4
C) Canada
D) China
13) In 2010, of the following ________ had the highest real GDP per person.
A) Japan
B) Canada
C) the Europe Big 4 countries
D) the United States
14) During the last 50 years, which of the following had the lowest level of real GDP per person?
A) Africa
B) Central and South America
C) United States
D) Central Europe
15) During the 1990s, which of the following experienced the slowest rate of growth in real GDP
per person?
A) Japan
B) The big 4 nations of Europe
C) United States
D) Canada
16) Countries or regions in which real GDP per person has not grown as fast as in the United
States since 1960 include
A) Japan.
B) countries in Africa.
C) Hong Kong.
D) Canada.

17) Since 1960
A) in every decade, Japan has experienced faster growth than the United States.
B) growth rates in South American countries have exceeded those in North America.
C) real GDP per person in Hong Kong and Singapore have grown and are approaching or
surpassing that in the United States.
D) due to rapid growth, real GDP per person in China is now about 50 percent of that in the
United States.
18) Since 1960, which of the following countries had average growth rates in real GDP per
person higher than that of the United States?
A) Singapore
B) Hong Kong
C) South Korea
D) All of the above answers are correct.
19) Of the following Asian countries, which has the lowest level of real GDP per person?
A) China
B) Korea
C) Singapore
D) Hong Kong
20) The gap between real GDP per person in Africa and real GDP per person in the United States
has been
A) increasing.
B) decreasing.
C) remaining fairly constant.
D) there is no gap in real GDP per person between Africa and the United States.

21) Over the past fifty years, there has been substantial closure of the gap in real GDP per person
between which of the following groups of countries?
A) the United States and Central and South America
B) Africa and Western Europe
C) Central and South America and Africa
D) the United States and Japan
22) Between which pair of countries or continents listed below has real GDP per person
converged the most since 1960?
A) Canada and Japan
B) United States and Africa
C) United States and South America
D) Canada and South America
23) If a rich country grows at a faster rate than a poor one, then
A) the gap in their standard of living will widen over time.
B) the gap in their standard of living will close over time.
C) the difference in their living standards will not change over time.
D) whether or not the living standards gap widens or closes over time depends on the absolute
size of the relative growth rates.
24) Convergence of the income gap has been most dramatic between
A) Hong Kong and the United States.
B) the Central European countries and the United States.
C) Africa and the United States.
D) South America and the United States.

25) The gaps between the United States and the Asian countries of Honk Kong, Singapore,
Korea and China have been
A) decreasing
B) increasing
C) remaining fairly constant
D) there are no gaps between these Asian countries and the United States
26) By measuring ________ we can see that the economies of Hong Kong and Singapore are
catching up to the economies of North America but that the economies of Central and South
America are not.
A) inflation per person
B) real GDP per person
C) the population
D) real GDP
1) Moving along the aggregate production function shows the relationship between ________,
holding all else constant.
A) capital input and real GDP
B) labor input and real GDP
C) labor input, capital input and real GDP
D) technology and real GDP
2) The aggregate production function shows how ________ varies with ________.
A) leisure time; labor
B) labor; leisure time
C) real GDP; labor
D) labor; capital

3) An aggregate production function shows the relationship between
A) real GDP and leisure.
B) real GDP and the quantity of labor employed.
C) leisure and unemployment.
D) real GDP and unemployment.
4) The aggregate production function describes the relationship between
A) real GDP and the quantity of labor employed.
B) real GDP and the price level.
C) the rate of growth of real GDP and inflation.
D) real GDP and the unemployment rate.
5) A movement along the aggregate production function is the result of a change in
A) the quantity of labor.
B) technology.
C) capital.
D) interest rates.
6) Along the aggregate production function, as the quantity of labor rises, real GDP
A) rises.
B) falls.
C) stays the same.
D) may fall, rise, or stay the same.
7) The aggregate production function shows that an economy increases its real GDP in the short
run by
A) developing new technologies.
B) increasing its physical capital stock.
C) using more labor.
D) exploring for new deposits of natural resources.
8) Moving along the aggregate production function, all of the following are held constant
EXCEPT
A) labor.
B) capital.
C) human capital.
D) technology.
9) An increase in labor hours will lead to
A) a shift of the aggregate production function but no movement along it.
B) a movement along the aggregate production function but no shift in it.
C) both a movement along and a shift in the aggregate production function.
D) neither a movement along nor a shift in the aggregate production function.
10) The aggregate production function is graphed as
A) a downward sloping curve.
B) an upward sloping straight line.
C) an upward sloping line that becomes flatter as the quantity of labor increases.
D) an upward sloping line that becomes steeper as the quantity of labor increases.

11) The aggregate production function
A) measures the productivity of labor as leisure decreases.
B) increases only with increases in productivity.
C) shows that real GDP can increase because of increased productivity as well as increased labor
hours.
D) cannot show the impacts of productivity improvements.
12) The aggregate production function relating real GDP to labor hours
A) has a constant slope.
B) has a negative slope.
C) has a positive slope and becomes steeper as employment increases.
D) has a positive slope and becomes less steep as employment increases.
13) The curvature of the production function shows that as employment increases, the
productivity of labor
A) remains positive and increases.
B) remains positive but decreases.
C) decreases and becomes negative.
D) remains constant.
14) The decreasing slope of a production function reflects
A) diminishing returns.
B) rising unemployment.
C) decreasing costs.
D) increasing aggregate demand.

18
15) As labor increases, there is a
A) shift of the aggregate production function, but no movement along it.
B) movement along the aggregate production function, but no shift in it.
C) movement along the aggregate production function and real GDP will increase less with each
additional increase in labor.
D) movement along the aggregate production function and real GDP will decrease less with each
additional increase in labor.
16) According to the law of diminishing returns, an additional unit of
A) capital produces more output than an additional unit of labor.
B) labor decreases output.
C) labor produces more output than the previous unit.
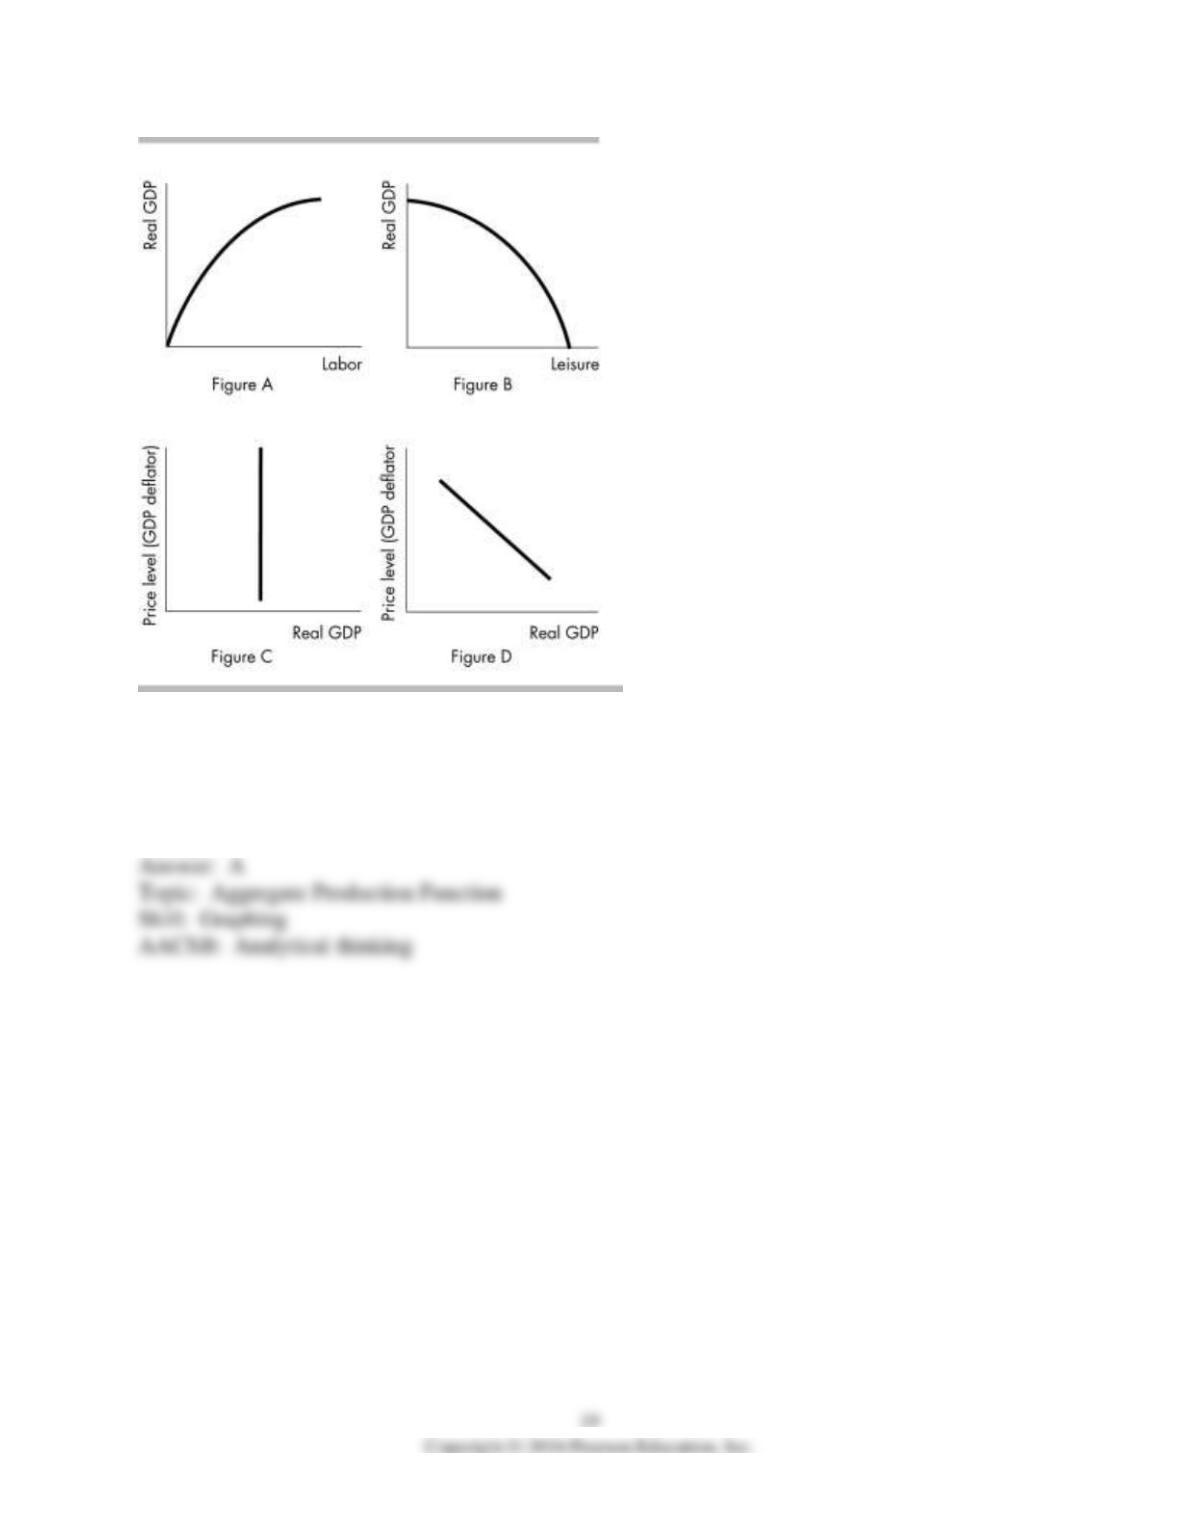
17) In the illustration above, which figure shows an aggregate production function?
A) Figure A
B) Figure B
C) Figure C
D) Figure D
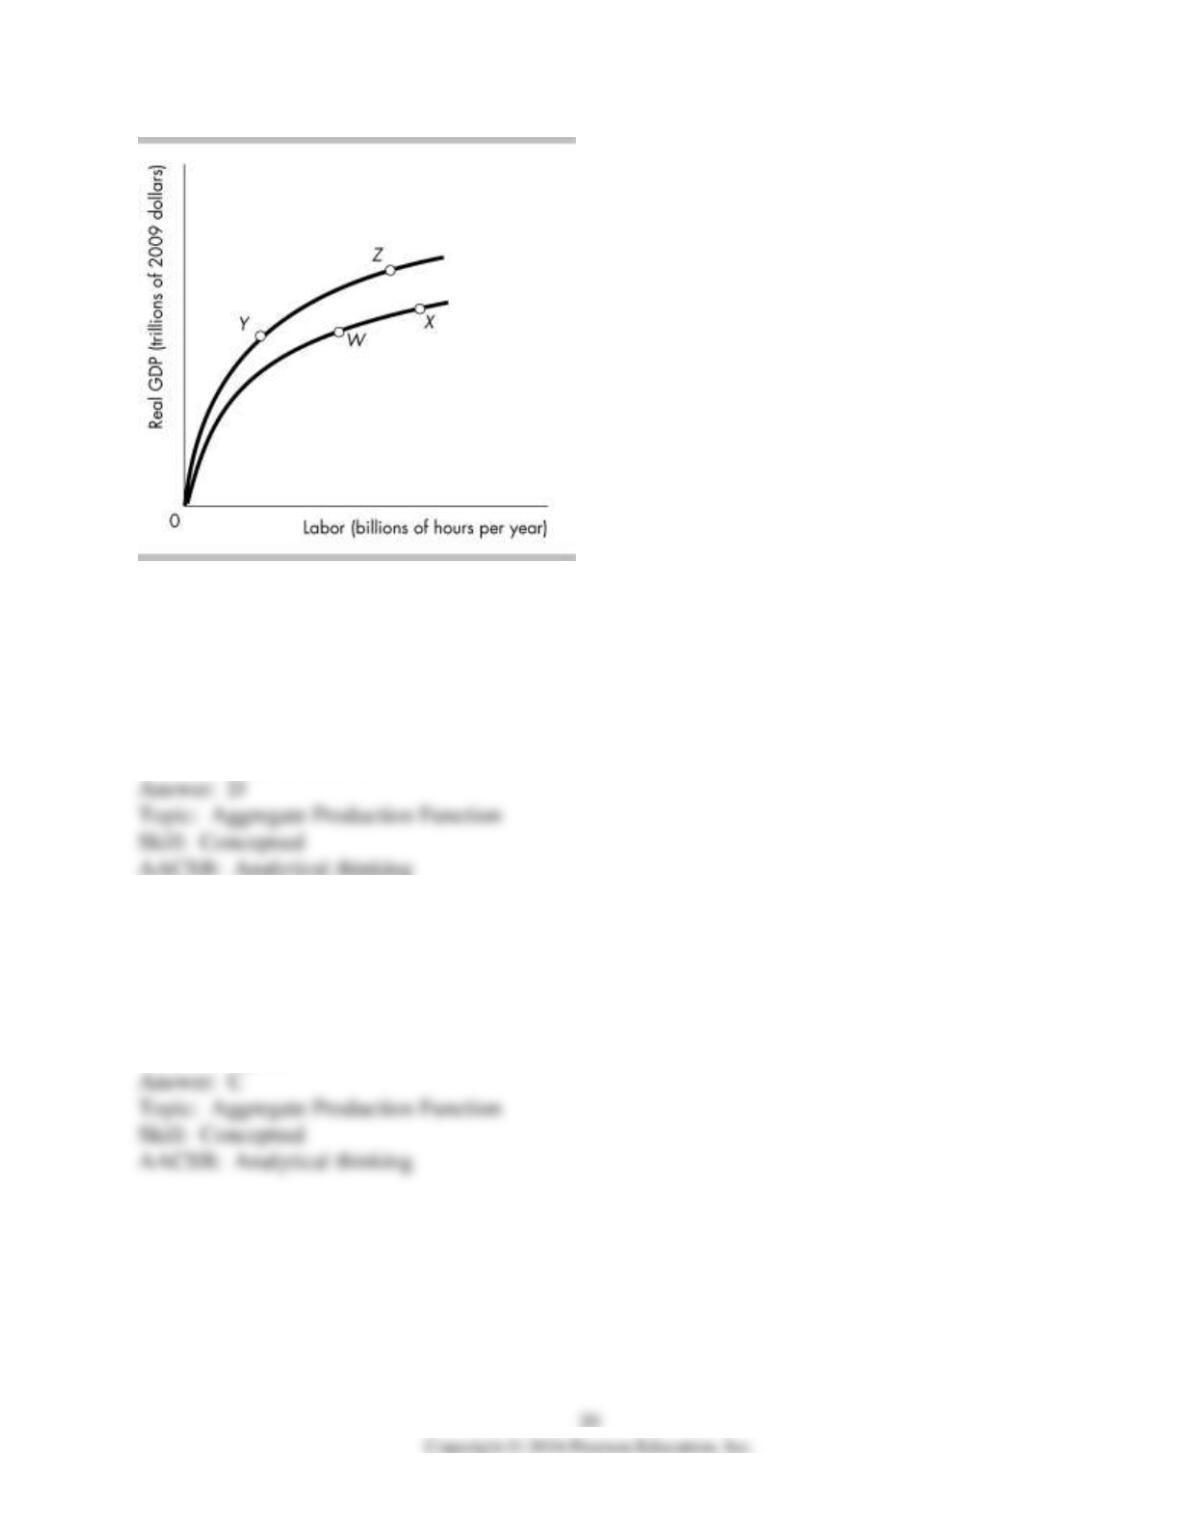
18) The country of Kemper is on its aggregate production function at point W in the above
figure. The government of Kemper passes a law that makes 4 years of college mandatory for all
citizens. After all citizens have their education, the economy will
A) move to point such as Y.
B) remain at point W.
C) move to point such as X.
D) move to point such as Z.
19) The country of Kemper is on its aggregate production function at point W in the above
figure. If the population increases with no change in capital or technology, the economy will
A) move to point such as Y.
B) remain at point W.
C) move to point such as X.
D) move to point such as Z.