Macroeconomics, 7e (Abel/Bernanke/Croushore)
Chapter 6 Long-Run Economic Growth
6.1 The Sources of Economic Growth
1) Between 1870 and 2006, among the United States, Germany, Japan, and Australia, ________
grew at the fastest rate and ________ grew at the slowest rate.
A) United States; Germany
B) Germany; United States
C) Australia; Japan
D) Japan; Australia
2) The elasticity of output with respect to capital
A) is the increase in output resulting from an increase in the capital stock.
B) is the percentage increase in output resulting from a 1% increase in the capital stock.
C) is always greater than one.
D) is the inverse of the elasticity of output with respect to labor.
3) Suppose the current level of output is 5000 and the elasticity of output with respect to capital
is 0.4. A 10% increase in capital would increase the current level of output to
A) 5020.
B) 5050.
C) 5200.
D) 5500.
4) Suppose the current level of output is 5000 and the elasticity of output with respect to labor is
0.7. A 10% increase in labor would increase the current level of output to
A) 5035.
B) 5070.
C) 5350.
D) 5700.
5) Suppose the current level of output is 5000. If the elasticities of output with respect to capital
and labor are 0.3 and 0.7, respectively, a 10% increase in capital combined with a 5% increase in
labor and a 5% increase in productivity would increase the current level of output to
A) 5015.
B) 5325.
C) 5575.
D) 6000.
6) Over the past year, productivity grew 2%, capital grew 1%, and labor grew 1%. If the
elasticities of output with respect to capital and labor are 0.2 and 0.8, respectively, how much did
output grow?
A) 1%
B) 2%
C) 3%
D) 4%
7) Over the past year, productivity grew 1%, capital grew 2%, and labor grew 2%. If the
elasticities of output with respect to capital and labor are 0.3 and 0.7, respectively, how much did
output grow?
A) 1%
B) 2%
C) 3%
D) 4%
8) Over the past year, productivity grew 1%, capital grew 0%, and labor grew 5%. If the
elasticities of output with respect to capital and labor are 0.4 and 0.6, respectively, how much did
output grow?
A) 1%
B) 2%
C) 3%
D) 4%
9) The growth accounting equation is
A) Y = AaKK aNN
B) Y = AF(K, N)
C) ΔY/Y = ΔA/A + aKΔK/K + aNΔN/N
D) ΔY/Y = ΔA/A – aKΔK/K – aNΔN/N
10) If capital and labor each grow 5% in a year, the elasticities of output with respect to capital
and labor sum to one, and productivity grows 2% in the year, by how much does output grow
during the year?
A) 2%
B) 3%
C) 5%
D) 7%
11) Total factor productivity growth is that part of economic growth due to
A) capital growth plus labor growth.
B) capital growth less labor growth.
C) capital growth times labor growth.
D) neither capital growth nor labor growth.
12) Over the past year, output grew 4%, capital grew 2%, and labor grew 1%. If the elasticities
of output with respect to capital and labor are 0.3 and 0.7, respectively, how much did
productivity grow?
A) 2.0%
B) 2.7%
C) 3.0%
D) 3.3%
13) Over the past year, output grew 5%, capital grew 5%, and labor grew 1%. If the elasticities
of output with respect to capital and labor are 0.3 and 0.7, respectively, how much did
productivity grow?
A) 0.5%
B) 1.0%
C) 2.2%
D) 2.8%
14) Over the past year, output grew 6%, capital grew 2%, and labor grew 4%. If the elasticities
of output with respect to capital and labor are 0.3 and 0.7, respectively, how much did
productivity grow?
A) 2.0%
B) 2.6%
C) 3.0%
D) 3.3%
15) Over the past year, output grew 5%, capital grew 5%, and labor grew 1%. If the elasticities
of output with respect to capital and labor are 0.5 and 0.5, respectively, how much did
productivity grow?
A) 0.5%
B) 1.0%
C) 1.5%
D) 2.0%
16) Labor productivity increased so much in the second half of the 1990s because of
A) improved information and communications technologies.
B) higher levels of educational attainment by workers.
C) cheaper foreign imports used in production.
D) increased foreign competition.
17) Edward Denison found that labor’s contribution to output growth in the United States since
1929 was attributable to all the factors below EXCEPT
A) rising population.
B) an increase in the percentage of the population in the labor force.
C) an increase in the number of hours worked per person.
D) higher educational levels.
18) All of the following are explanations of the post-1973 productivity slowdown EXCEPT
A) problems in measuring productivity.
B) changes in the legal and human environment.
C) higher oil prices.
D) greater competition from foreign imports.
19) The idea that measurement problems could explain the productivity slowdown since 1973 is
based on the fact that
A) official output measures make no adjustment for quality.
B) output can’t be measured.
C) capital can’t be measured.
D) quality improvements aren’t fully accounted for in the data.
20) A new pollution law requires businesses to pay for inspections of their plants by independent
pollution-monitoring firms. What effect is this likely to have?
A) Increase productivity
B) Increase the capital stock
C) Reduce productivity
D) Increase the demand for labor in those firms
21) Why do some people think that the productivity slowdown since 1973 is just a return to
normalcy after fast productivity growth during the previous 25 years?
A) Productivity growth of the previous 25 years was abnormally low.
B) The Great Depression and World War II had prevented technological opportunities from
being exploited.
C) The United States is the only country to face the slowdown, due to poor regulatory decisions.
D) The United States has allowed countries like Japan to steal its technological breakthroughs.
22) Greenwood and Yorukoglu view the post-1973 productivity slowdown as resulting from
A) the information technology revolution.
B) high oil prices.
C) measurement errors.
D) technological depletion.
23) From one year to the next, a country’s output rose from 4000 to 4500, its capital stock rose
from 10,000 to 12,000, and its labor force declined from 2000 to 1750. Suppose aK = 0.3 and aN
= 0.7.
(a) How much did capital contribute to economic growth over the year?
(b) How much did labor contribute to economic growth over the year?
(c) How much did productivity contribute to economic growth over the year?
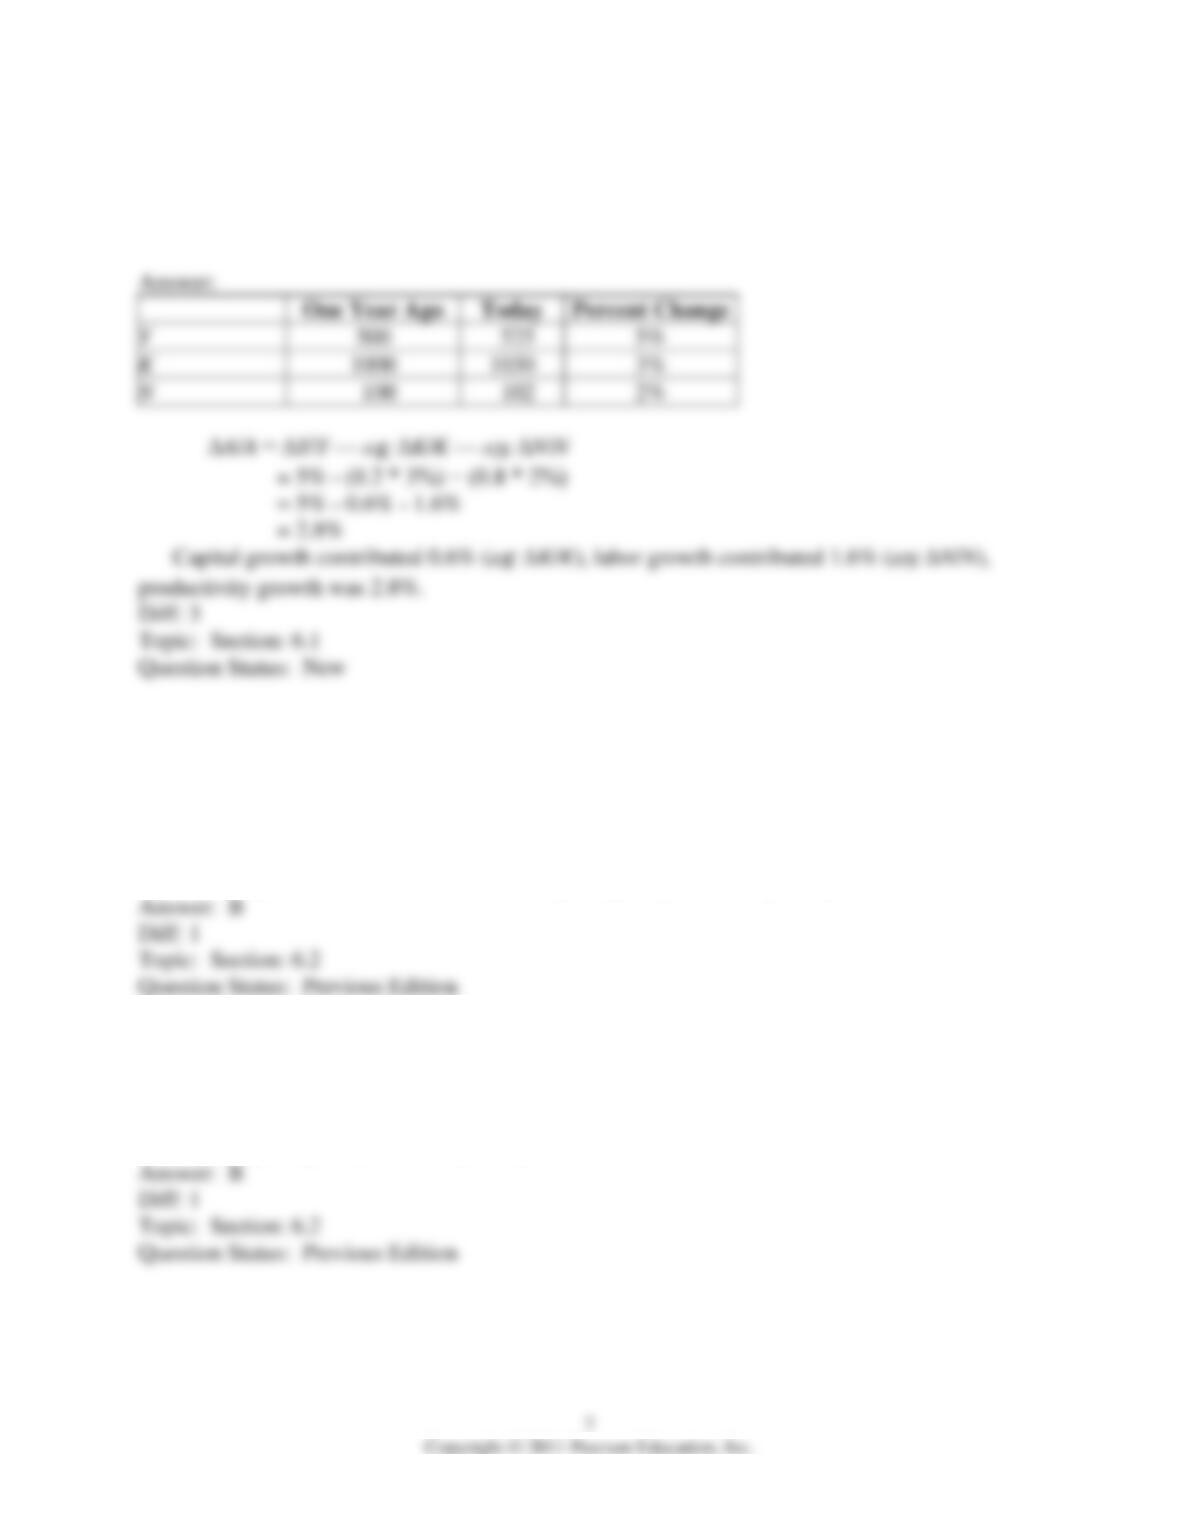
24) Over the past year, an economy’s labor supply increased from 100 to 102, its capital stock
increased from 1000 to 1030, and its output increased from 500 to 525. All measurements are in
real terms. Calculate the contributions to economic growth of growth in capital, labor, and
productivity if aK = 0.2 and aN = 0.8.
6.2 Growth Dynamics: The Solow Model
1) The per-worker production function in the Solow model assumes
A) constant returns to scale and increasing marginal productivity of capital.
B) constant returns to scale and diminishing marginal productivity of capital.
C) increasing returns to scale and diminishing marginal productivity of capital.
D) decreasing returns to scale and diminishing marginal productivity of capital.
2) The bowed shape of the per-worker production function is caused by
A) wealth effects that reduce labor supply.
B) diminishing marginal productivity of capital.
C) increasing marginal productivity of labor.
D) increasing marginal productivity of capital.
3) In the Solow model, if productivity doesn’t change,
A) the economy must eventually reach a steady state.
B) the capital-labor ratio must decline.
C) the capital-labor ratio must rise.
D) there can be no saving.
4) In a steady state
A) both consumption per worker and the capital-labor ratio are constant.
B) consumption per worker is constant, but the capital-labor ratio can change.
C) capital and labor, by definition, are inversely related to one another.
D) consumption per worker can change, but the capital-labor ratio is constant.
5) Steady-state investment per worker is positively related to the capital-labor ratio because the
higher the capital-labor ratio
A) the lower the capital depreciation rate.
B) the greater the amount of resources available for capital investment.
C) the more investment per worker is required to replace depreciating capital.
D) the less the economy needs to equip new workers with the same high level of capital.
6) In the absence of productivity growth, in a steady-state economy
A) output per worker and consumption per worker remain constant over time.
B) output per worker remains constant over time, but consumption per worker grows over time.
C) output per worker grows over time, but consumption per worker remains constant over time.
D) output per worker and consumption per worker both grow over time.
7) According to the Solow model, an increase in the capital-labor ratio will
A) always reduce steady state consumption per worker.
B) always increase steady state consumption per worker.
C) reduce steady state consumption per worker if the capital-labor ratio is below the Golden rule
capital stock.
D) increase steady state consumption per worker if the capital-labor ratio is below the Golden
rule capital stock.
8) The level of the capital-labor ratio that maximizes consumption per worker in the steady state
is known as the
A) Solow residual capital-labor ratio.
B) Golden Rule capital-labor ratio.
C) q theory capital-labor ratio.
D) dynamically efficient capital-labor ratio.
9) The Golden Rule capital-labor ratio is the level of the capital-labor ratio that, in the steady
state,
A) maximizes output per worker.
B) maximizes investment per worker.
C) maximizes consumption per worker.
D) maximizes capital per worker.
10) If the capital-labor ratio is above the Golden Rule capital-labor ratio, then in the steady state,
A) capital per worker is above its maximum.
B) output per worker is less than it would be at the Golden Rule capital-labor ratio.
C) investment per worker exceeds output per worker.
D) consumption per worker is not at its maximum.
11) The idea that saving equals investment in the Solow model means that a steady state can be
reached only when
A) s = k.
B) s = n + d.
C) sf(k) = (s + d)k.
D) sf(k) = (n + d)k.
12) In the Solow model, if f(k) = 2k0.5, s = 0.3, n = 0.05, and d = 0.15, what is the value of k at
equilibrium?
A) 1
B) 3
C) 6
D) 9
13) In the Solow model, if f(k) = 2k0.5, s = 0.25, n = 0.05, and d = 0.2, what is the value of k at
equilibrium?
A) 1
B) 2
C) 3
D) 4
14) In the Solow model, if f(k) = 2k0.5, s = 0.1, n = 0.1, and d = 0.05, what is the value of f(k) at
equilibrium?
A) 2/3
B) 4/3
C) 2
D) 8/3
15) In the Solow model, if f(k) = 8k0.5, s = 0.2, n = 0.3, and d = 0.1, what is the value of k at
equilibrium?
A) 1
B) 4
C) 9
D) 16
16) In the Solow model, if f(k) = 6k0.5, s = 0.1, n = 0.1, and d = 0.2, what is the value of c at
equilibrium?
A) 10
B) 10.4
C) 10.8
D) 11.2
17) In the Solow model, if k = 8, y = 20, and s = 0.2, what is c?
A) 24
B) 20
C) 16
D) 12
18) In the Solow model, if k = 8, y = 24, and s = 0.25, what is c?
A) 24
B) 20
C) 18
D) 12
19) The Solow model demonstrates that
A) in the absence of productivity growth, economic growth will turn negative in the long run.
B) in the absence of productivity growth, economic growth will reach a steady state of zero per-
capita growth in the long run.
C) productivity growth must exceed the rate of growth in the population to avoid a steady state in
the long run.
D) productivity growth will inevitably decline due to diminishing marginal productivity.
20) An earthquake destroys a good portion of the capital stock. How would you expect this to
affect the capital-labor ratio in the long run? There would be
A) a rightward movement along the saving-per-worker curve and an increase in the capital-labor
ratio.
B) no change in the long-run capital-labor ratio.
C) a downward shift in the saving-per-worker curve and a decrease in the capital-labor ratio.
D) a leftward movement along the saving-per-worker curve and a decrease in the capital-labor
ratio.
21) Which of the following changes would lead, according to the Solow model, to a higher level
of long-run output per worker?
A) A lower level of capital per worker.
B) An increase in the saving rate.
C) A rise in the rate of population growth.
D) A decrease in productivity.
22) An increase in the saving rate in a steady-state economy would cause
A) a rightward movement along the saving-per-worker curve and an increase in the capital-labor
ratio.
B) an upward shift in the saving-per-worker curve and an increase in the capital-labor ratio.
C) a downward shift in the saving-per-worker curve and a decrease in the capital-labor ratio.
D) a leftward movement along the saving-per-worker curve and a decrease in the capital-labor
ratio.
23) In the long run, an increase in the saving rate in a steady-state economy will cause
A) an increase in the capital-labor ratio and an increase in consumption per worker.
B) an increase in the capital-labor ratio and a decrease in consumption per worker.
C) a decrease in the capital-labor ratio and a decrease in consumption per worker.
D) a decrease in the capital-labor ratio and an increase in consumption per worker.
24) All else being equal, a permanent decrease in the saving rate in a steady-state economy
would cause
A) an increase in the capital-labor ratio and an increase in consumption per worker.
B) an increase in the capital-labor ratio and a decrease in consumption per worker.
C) a decrease in the capital-labor ratio and a decrease in consumption per worker.
D) a decrease in the capital-labor ratio and an increase in consumption per worker.
25) An increase in the growth rate of population in a steady-state economy would cause
A) a parallel shift upward in the investment line.
B) a pivot up and to the left in the investment line.
C) a pivot down and to the right in the investment line.
D) a parallel shift downward in the investment line.
26) An increase in population growth will lead to a ________ in the steady-state capital-labor
ratio and a ________ in output per worker.
A) fall; fall
B) fall; rise
C) rise; rise
D) rise; fall
27) A productivity improvement will cause
A) a rightward movement along the saving-per-worker curve and an increase in the capital-labor
ratio.
B) an upward shift in the saving-per-worker curve and an increase in the capital-labor ratio.
C) a downward shift in the saving-per-worker curve and a decrease in the capital-labor ratio.
D) a leftward movement along the saving-per-worker curve and a decrease in the capital-labor
ratio.
28) An increase in pollution has caused a permanent increase in the rate of capital depreciation.
This would cause
A) an increase in the capital-labor ratio.
B) output per worker to fall.
C) a decline in consumption per worker.
D) the capital-labor ratio to be unaffected.
29) In the long run, a reduction in productivity will cause
A) an increase in the capital-labor ratio and an increase in consumption per worker.
B) an increase in the capital-labor ratio and a decrease in consumption per worker.
C) a decrease in the capital-labor ratio and a decrease in consumption per worker.
D) a decrease in the capital-labor ratio and an increase in consumption per worker.
30) In the very long run, the level of consumption per worker can grow continually if
A) the saving rate continually falls.
B) the population growth rate continually rises.
C) productivity continually improves.
D) the depreciation rate continually rises.
31) Endogenous growth theory attempts to
A) replace the Solow model with a model in which money growth plays a key role.
B) explain how societies can more easily reach the “Golden Rule.”
C) show how population growth reduces capital and output.
D) explain why productivity changes.
32) In the textbook model of endogenous growth, in equilibrium, output grows at the rate of
A) sA – d.
B) n + d.
C) K.
D) A.
33) In the textbook model of endogenous growth, long-run output growth would decline if there
were either a ________ in the saving rate or a ________ in the depreciation rate.
A) rise; rise
B) rise; fall
C) fall; rise
D) fall; fall
34) A country has the per-worker production function
yt = 5
k5.0
t
,
where yt is output per worker and kt is the capital-labor ratio. The depreciation rate is 0.2 and the
population growth rate is 0.05. The saving function is
St = 0.2Yt,
where St is total national saving and Yt is total output.
(a) What is the steady-state value of the capital-labor ratio?
(b) What is the steady-state value of output per worker?
(c) What is the steady-state value of consumption per worker?
35) A country has the per-worker production function
yt = 6
k3/2
t
,
where yt is output per worker and kt is the capital-labor ratio. The depreciation rate is 0.1 and the
population growth rate is 0.1. The saving function is
St = 0.1 Yt,
where St is total national saving and Yt is total output.
(a) What is the steady-state value of capital-labor ratio?
(b) What is the steady-state value of output per worker?
(c) What is the steady-state value of consumption per worker?
36) A country has the per-worker production function
yt = 6
kt
5.0
,
where yt is output per worker and kt is the capital-labor ratio. The depreciation rate is 0.1 and the
population growth rate is 0.1. The saving function is
St = 0.1 Yt,
where St is total national saving and Yt is total output.
(a) What is the steady-state value of capital-labor ratio?
(b) What is the steady-state value of output per worker?
(c) What is the steady-state value of consumption per worker?
37) What happens in the steady state to the capital-labor ratio, output per worker, and
consumption per worker when each of the following events occur? You should assume that the
steady-state capital-labor ratio is below the Golden Rule level.
(a) Productivity falls.
(b) Population growth falls.
(c) The saving rate falls.
(d) The depreciation rate falls.
38) Country A has a capital-labor ratio that is initially twice as big as that of country B, but
neither is yet in a steady state. Both countries have the same production function, f(k) = 6k1/2.
Country A has a 10% saving rate, 10% population growth rate, and 5% depreciation rate, while
country B has a 20% saving rate, 10% population growth rate, and 20% depreciation rate.
(a) Calculate the steady-state capital-labor ratio for each country. Does the initial capital-labor
ratio affect your results?
(b) Calculate output per worker and consumption per worker for each country. Which country
has the highest output per worker? The highest consumption per worker?
39) How would each of the following changes affect the steady-state values of the capital-labor
ratio, output per worker, and consumption per worker?
(a) A change in the composition of the capital stock raises the depreciation rate.
(b) A change in social mores lowers the population growth rate.
(c) Government tax policies change to encourage a higher saving rate.
(d) A supply shock reduces productivity sharply.
40) (a) In the model of endogenous growth, if s = 0.1, A = 2, and d = 0.15, calculate the
economy’s growth rate. Show your work.
(b) If the depreciation rate declines to d = 0.10, calculate the economy’s growth rate. Show your
work.
(c) Is the impact on the growth rate arising from a change in the depreciation rate in the
endogenous growth model the same as in the Solow model?
6.3 Government Policies to Raise Long-Run Living Standards
1) A government policy that would reduce the saving rate is
A) eliminating the social security system.
B) giving tax breaks to increase the real return that savers receive.
C) increasing the government budget surplus by cutting government spending.
D) switching the tax system to tax consumption instead of income.
2) Government policies to raise the rate of productivity growth include all of the following
EXCEPT
A) improving infrastructure.
B) encouraging research and development.
C) reducing the government budget surplus.
D) improving human capital development.
3) Government policies to raise the rate of productivity growth include all of the following
EXCEPT
A) improving infrastructure.
B) encouraging research and development.
C) reducing the government budget surplus.
D) improving human capital development.
4) A government policy that would raise the rate of productivity growth is
A) shifting infrastructure expenditures to the private sector.
B) taxing expenditures on research and development.
C) reducing the government budget surplus.
D) improving human capital development.
5) What types of government policies can increase long-run living standards?