
9) Strategy to Address Dependence on Foreign Workers, Labour Market Demands
The prime minister of Malaysia announced his government’s “immediate focus would be to
enhance skills development and improve the quality of education.” By “the constant upgrading of
skills of the country’s workforce” he hoped to improve the country’s “global competitiveness and
raise average incomes of workers.”
www.thestar.com.my 11/21/2008
The long-run benefit of enhancing “skill development and improve….education” is to
A) improve property rights.
B) increase labor supply.
C) speed economic growth.
D) smooth the growth of labor productivity.
10) “Why India Cannot Sustain High Economic Growth”, by Kunal KumarKundu
In his article about India’s prospects for growth, the author notes that “Per capita availability of
food grain is falling as population is growing faster than food grain production. Deplorable rural
infrastructure leads to India wasting an amount of food grain… . India’s agriculture is still so very
highly monsoon dependent…”
www.rediff.com 5/29/2008
This view of India’s economic growth is best reflected in the ________.
A) classical growth theory.
B) new growth theory.
C) neoclassical growth theory.
D) aggregate production theory.

11) “Why India Cannot Sustain High Economic Growth”, by Kunal KumarKundu
In his article about India’s prospects for growth, the author notes that “Per capita availability of
food grain is falling as population is growing faster than food grain production. Deplorable rural
infrastructure leads to India wasting an amount of food grain… . India’s agriculture is still so very
highly monsoon dependent…”
www.rediff.com 5/29/2008
If the author is suggesting that India’s growth prospects are explained by the classical growth
theory, we also expect that
A) real GDP per worker will increase.
B) the subsistence wage will increase.
C) the economy will perpetually grow.
D) labor productivity, which has risen in recent years, will eventually decline.
12) Use the table below to answer this question. The data show national savings rates as a
percentage of GDP; the growth rate of real GDP per person; and birth rates in 2006.
Country
National Saving
(% of GDP)
Growth rate of real GDP
per person
Birth Rate
Japan
28
1.6
9.96
Canada
24
2.6
11.4
Germany
23
1.9
9.35
U.S.
14
1.9
14.2
www.econstats.com; www.os-connect.com
If the data support the neoclassical growth theory, we would expect to see
A) Japan with the highest economic growth rate because the high saving means that more capital
is accumulated.
B) the United States with the highest economic growth rate because a lower savings rate means
more income is spent on consumption.
C) Canada with the highest economic growth rate because it has the highest real GDP per person.
D) the United States with the highest economic growth rate because it has the highest birth rate.

13) “Global Innovation 1000—Money Isn’t Everything.”
The report by Booz Allen Hamilton Consulting claims that “There is no direct relationship
between R&D spending and significant measures of corporate success such as growth,
profitability, and shareholder return. …However, the pace of corporate R&D spending continues
to accelerate, as many executives continue to believe that enhanced innovation is required to fuel
their future growth.
www.boozallen.com 10/11/2005
The report provides ________ evidence of the ________.
A) conflicting; new growth model which claims that profits are linked to innovation
B) supporting; new growth model which claims that innovation is indirectly related to profit
C) conflicting; neoclassical growth model which claims that population growth spurs technology
D) supporting; neoclassical growth model which claims that technology advances are random
14) According to UNESCO reporting, “Governments in North America and Western Europe
invested the highest shares of national resources in education: 5.6 percent of GDP.” As a result,
we would expect ________, all else held constant.
www.worldometers.info
A) higher economic growth rates in these countries compared to other countries
B) lower economic growth rates in the countries because fewer resources can be devoted to
innovation
C) lower research and development spending and lower economic growth unless the
governments can raise taxes
D) lower saving rates and slower economic growth
15) Cuba spends the highest percentage of GDP (18.7 percent) on education while the United
States is the 38th highest spender with 5.7 percent of GDP. If spending on education is important
for economic growth, which of the following statements explain why Cuba’s economic growth
rate is lower than the U.S. economic growth rate?
(data from United Nations Human Development Programme)
A) Cuba trades with many more countries than does the United States.
B) Cuba doesn’t offer property rights that promote innovation.
C) Cuba’s population is smaller than the U.S. population.
D) all of the above explain why Cuba’s economic growth rate is lower than the U.S. economic
growth rate.

7 Essay Questions
1) How has U.S. real GDP per person changed over the last 100 years?
2) Briefly explain how growth in real GDP differs across economies including the United States,
Japan, Africa, Central America, Hong Kong, Korea, and Singapore.
3) How has the U.S. growth experience compared to that of Central Europe and Africa? How has
compared to the recent experience of Asian nations such as Hong Kong and Singapore.
4) Discuss the aggregate production function. How does the aggregate production function relate
to the labor market and potential GDP?
5) Define the aggregate production function. Discuss why the aggregate production function
exhibits diminishing returns.
6) What is the real wage rate?
7) Explain how the labor market and the production function determine potential GDP.

8) How will an increase in physical capital affect labor productivity, labor demand, and potential
GDP?
9) What happens to the real wage rate and potential GDP if population increases?
10) With no change in labor productivity, what would happen to the real wage rate and potential
GDP if the population increased?
11) What is the effect on real GDP per person if labor productivity increases?
12) Define labor productivity. Discuss the relationship between labor productivity, human capital
growth, and technology change.
13) What factors raise the productivity of labor?
14) List and explain the factors that can increase labor productivity.
15) What are the sources of human capital?

16) What are the basic arguments of the classical growth theory?
17) What is the main difference between classical economists’ ideas about economic growth
versus what modern evidence suggests?
18) In the classical theory of growth, what is the final outcome of an increase in growth and
labor productivity?
19) What are the basic arguments of the neoclassical growth theory?

20) “According to the neoclassical growth theory, national incentives to save, invest, accumulate
human capital, and develop new technology influence the country’s growth rate of real GDP.”
Comment on the accuracy of the previous statement.
21) What is the role of profits in the neoclassical growth theory versus the new growth theory?
22) What is the main shortcoming of the neoclassical growth model and how does the new
growth theory address this shortcoming?
23) How does the new growth theory explain economic growth?
24) Of the three economic growth theories, which is the most optimistic about the chances of real
GDP per person growing indefinitely? Which is the most pessimistic? What accounts for the
differences?
25) Explain the role played by technological change in classical growth theory, neoclassical
growth theory, and new growth theory.

26) Suppose the President asks you to write him a letter suggesting ways the government might
help the economy achieve permanently higher rates of economic growth. Based on your
understanding of growth theory and growth accounting, what would you suggest?
27) Describe ways that governments can promote faster economic growth.

8 Numeric and Graphing Questions
Labor demand
(billions of
hours per
year)
Real wage rate
(2009 dollars)
Labor supply
(billions of
hours per
year)
0
30
6
1
25
5
2
20
4
3
15
3
4
10
2
Employment
(billions of
hours per
year)
Real GDP
(billions of
2009 dollars)
6
95
5
90
4
80
3
60
2
30
1) The first table above gives the labor demand and labor supply schedules for a nation. The
second table gives its production function.
a) What are the equilibrium real wage rate and the level of employment?
b) What is potential GDP?

Real wage rate
(2009 dollars)
Labor demand
(billions of
hours per
year)
Labor supply
(billions of
hours per
year)
30
100
700
25
200
600
20
300
500
15
400
400
10
500
300
Employment
(billions of
hours per
year)
Real GDP
(trillions of
2009 dollars)
200
3.0
300
4.0
400
4.8
500
5.4
600
5.8
2) The first table above gives the labor demand and labor supply schedules for a nation. The
second table gives its production function.
a) What are the equilibrium real wage rate and the level of employment?
b) What is potential GDP?

Real wage rate
(2009 dollars)
Labor demand
(billions of
hours per
year)
Labor supply
(billions of
hours per
year)
5
360
260
10
325
275
15
300
300
20
280
330
Employment
(billions of
hours per
year)
Real GDP
(trillions of
2009 dollars)
100
2.0
200
3.0
300
3.8
400
4.4
3) The first table above gives the labor demand and labor supply schedules for a nation. The
second table gives its production function.
a) What are the equilibrium real wage rate and the level of employment?
b) What is potential GDP? If you cannot determine a precise amount, give the range in which
potential GDP must lie.
4) Real GDP equals $12 trillion and aggregate hours equals 300 billion hours. What does labor
productivity equal?

9 True or False
1) Economists are interested in long-term economic growth because growth increases real GDP
per person and improves our standard of living.
2) Over the last 100 years, real GDP per person in the United States has grown at an average rate
of approximately 2 percent per year.
3) The United States had the largest real GDP per person until the 2012 when the China’s real
GDP per person overtook and then exceeded that in the United States.
4) Because the United States is a developed economy, every other country is catching up to the
level of U.S. real GDP per person.
5) The gap between real GDP per person in the United States and South America has been
narrowing since 1980.
6) Real GDP per person is slowly converging around the world.

7) Labor productivity has grown at almost the same rate each year over the last 40 years in the
United States.
8) If the price level rises faster than the money wage rate, the real wage rate falls.
9) The real wage rate measures the quantity of goods and services an hour’s work will buy.
10) The demand curve for labor shows how many hours workers demand to work.
11) In general, a higher real wage rate decreases the quantity of labor supplied because fewer
people enter the labor force.
12) The higher the real wage rate, the higher the labor force participation rate.
13) To achieve faster growth, economies can increase income tax rates in order to increase
saving rates.

14) Faster long-term growth can be achieved by discouraging saving and encouraging
consumption.
15) All else equal, an increase in population decreases potential GDP.
16) The classical growth theory shows how technology changes continually generate economic
growth.
17) The classical growth theory’s view of the economy and its ability to achieve growth can be
compared to a perpetual motion machine.
18) The neoclassical growth theory is based on a subsistence real wage rate.
19) The neoclassical growth theory concluded that economic growth is temporary because of a
population explosion that occurs as a result of economic growth.
20) In neoclassical growth theory, technological progress is the key to continuous growth in
labor productivity.

98
21) New growth theory claims that economic growth occurs because firms reap profits from
research and add to the stock of capital.
22) New growth theory holds that choices, and the discoveries that result from them, result in
growth that is temporary in nature.
10 Extended Problems
Leisure
(hours)
Real GDP
(2009 dollars)
0
2,000
40
1,920
80
1,680
120
1,280
160
720
200
0
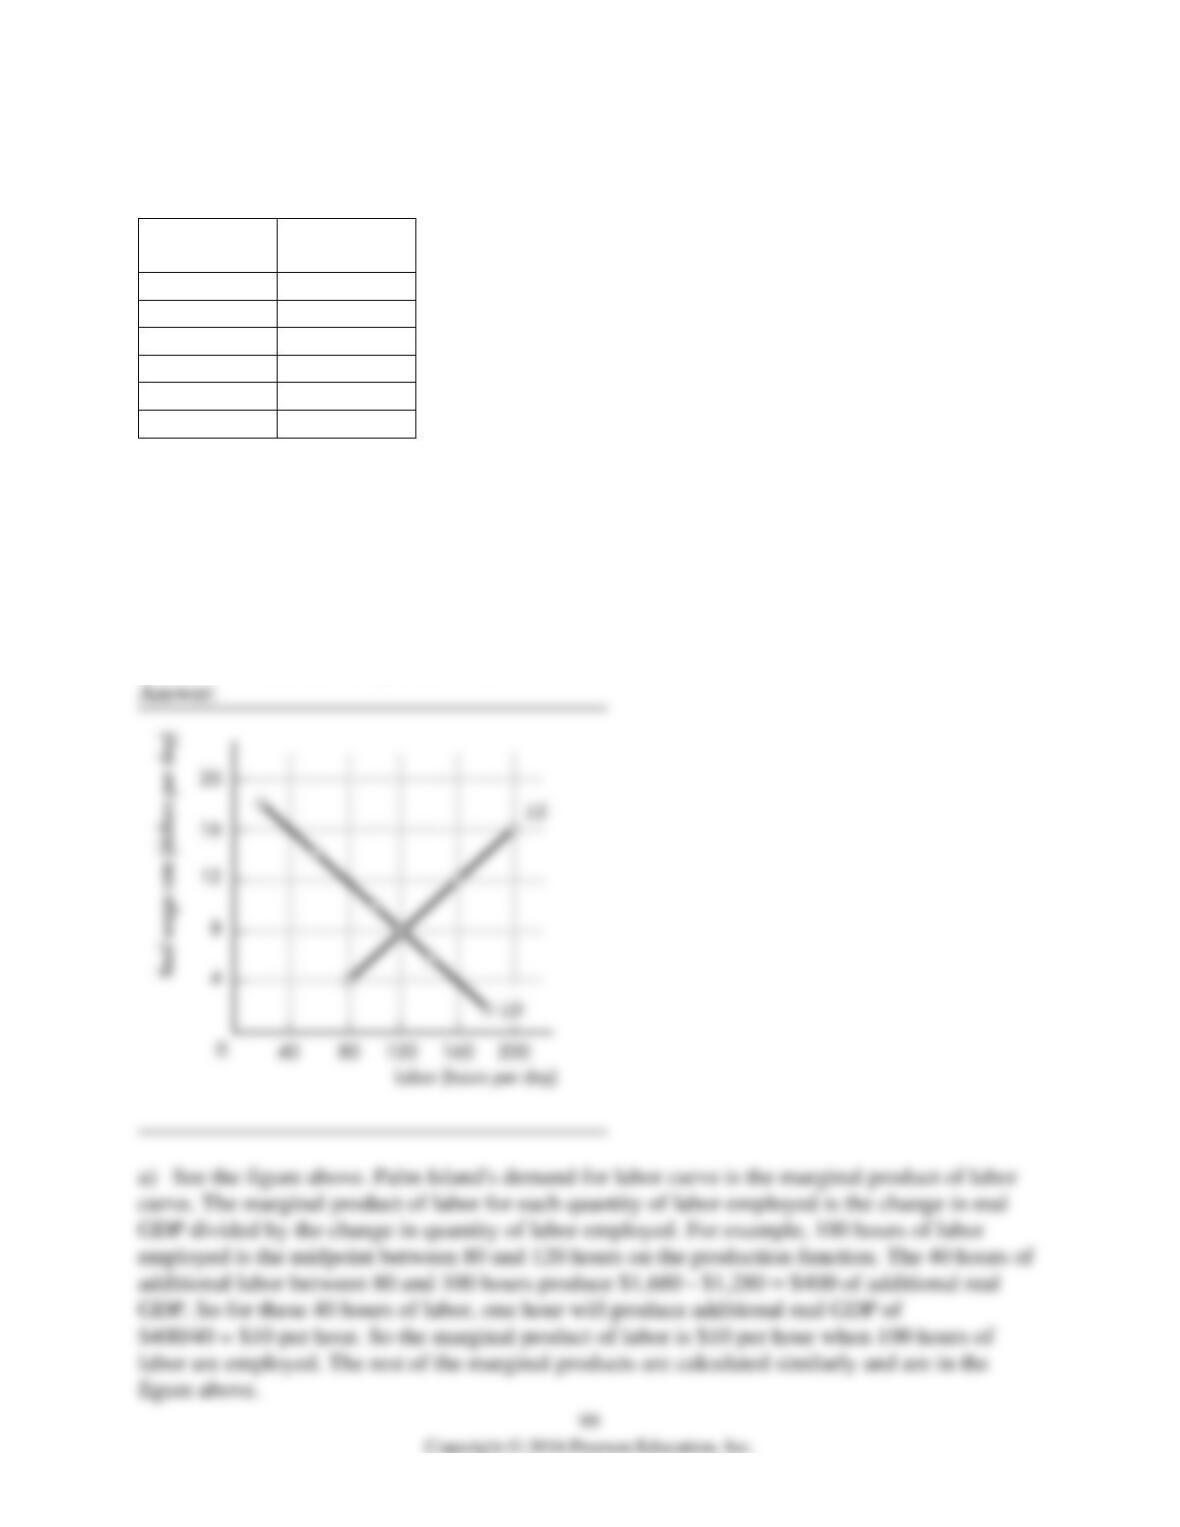
1) The people of Palm Island are willing to work 80 hours a day for a real wage rate of $4 an
hour. Then each dollar increase in the real wage, they are willing to work 10 additional hours a
day. Palm Island’s production possibilities are in the table above.
a) Draw Palm Island’s demand for labor curve.
b) Draw Palm Island’s supply of labor curve.
c) What are the full-employment equilibrium real wage rate and quantity of labor in Palm
Island’s economy?
d) What is Palm Island’s potential GDP?

100