4) Population growth is similar to depreciation, in that ________.
A) each lowers the capital-labor ratio
B) each tends to encourage saving
C) capital wears out faster when used by more workers
D) each helps to explain how economies can sustain a positive growth rate of output
5) If output per worker in a steady state is $30,000, depreciation is 13%, the population growth
rate is two percent, and the saving rate is 20%, what is the steady state capital-labor ratio?
A) $10,500
B) $85,714
C) $22,500
D) $40,000
6) Output per worker is 50, the saving rate is 15 percent, the population is growing at one
percent, depreciation is 9 percent, and the capital-labor ratio is 80. Consumption per worker is
________.
A) 37.5
B) falling
C) 75
D) 68
7) “Capital dilution” refers to ________.
A) the flow of investment in the “bathtub model”
B) the depreciation of capital associated with an increase in the percentage of younger workers
C) the decline in the marginal product of capital that results from reliance on new, inexperienced
workers
D) the decrease in capital per worker that is a direct consequence of an increase in the number of
workers
8) On the Solow Diagram, an increase in population growth is shown by ________.
A) an upward shift of the depreciation plus capital dilution line
B) an upward shift of the investment function
C) an upward shift of the per-worker production function
D) a downward shift of the investment function
13
9) The impact of immigration on an economy’s steady state capital-labor ratio is reduced to the
extent that the immigrants tend to ________ than the native population.
A) save more
B) have higher fertility
C) have lower income
D) be younger
10) A One-Child Policy was instituted in 1979 in ________.
A) Brazil
B) South Africa
C) India
D) China
11) According to the Solow model, a benefit of policies to limit population growth might be
________.
A) that smaller families are more likely to contribute to technological advances
B) that smaller families have better access to birth control methods and devices
C) that smaller families might provide each person a larger share of national income
D) that smaller families have less need to save, and so enjoy higher consumption
12) Evidence of a negative correlation between income per capita and population growth rates
________.
A) implies that birth control is most effective in low-income countries
B) has not been found in the available data
C) is consistent with the Solow model
D) suggests that population growth stimulates technological progress
14
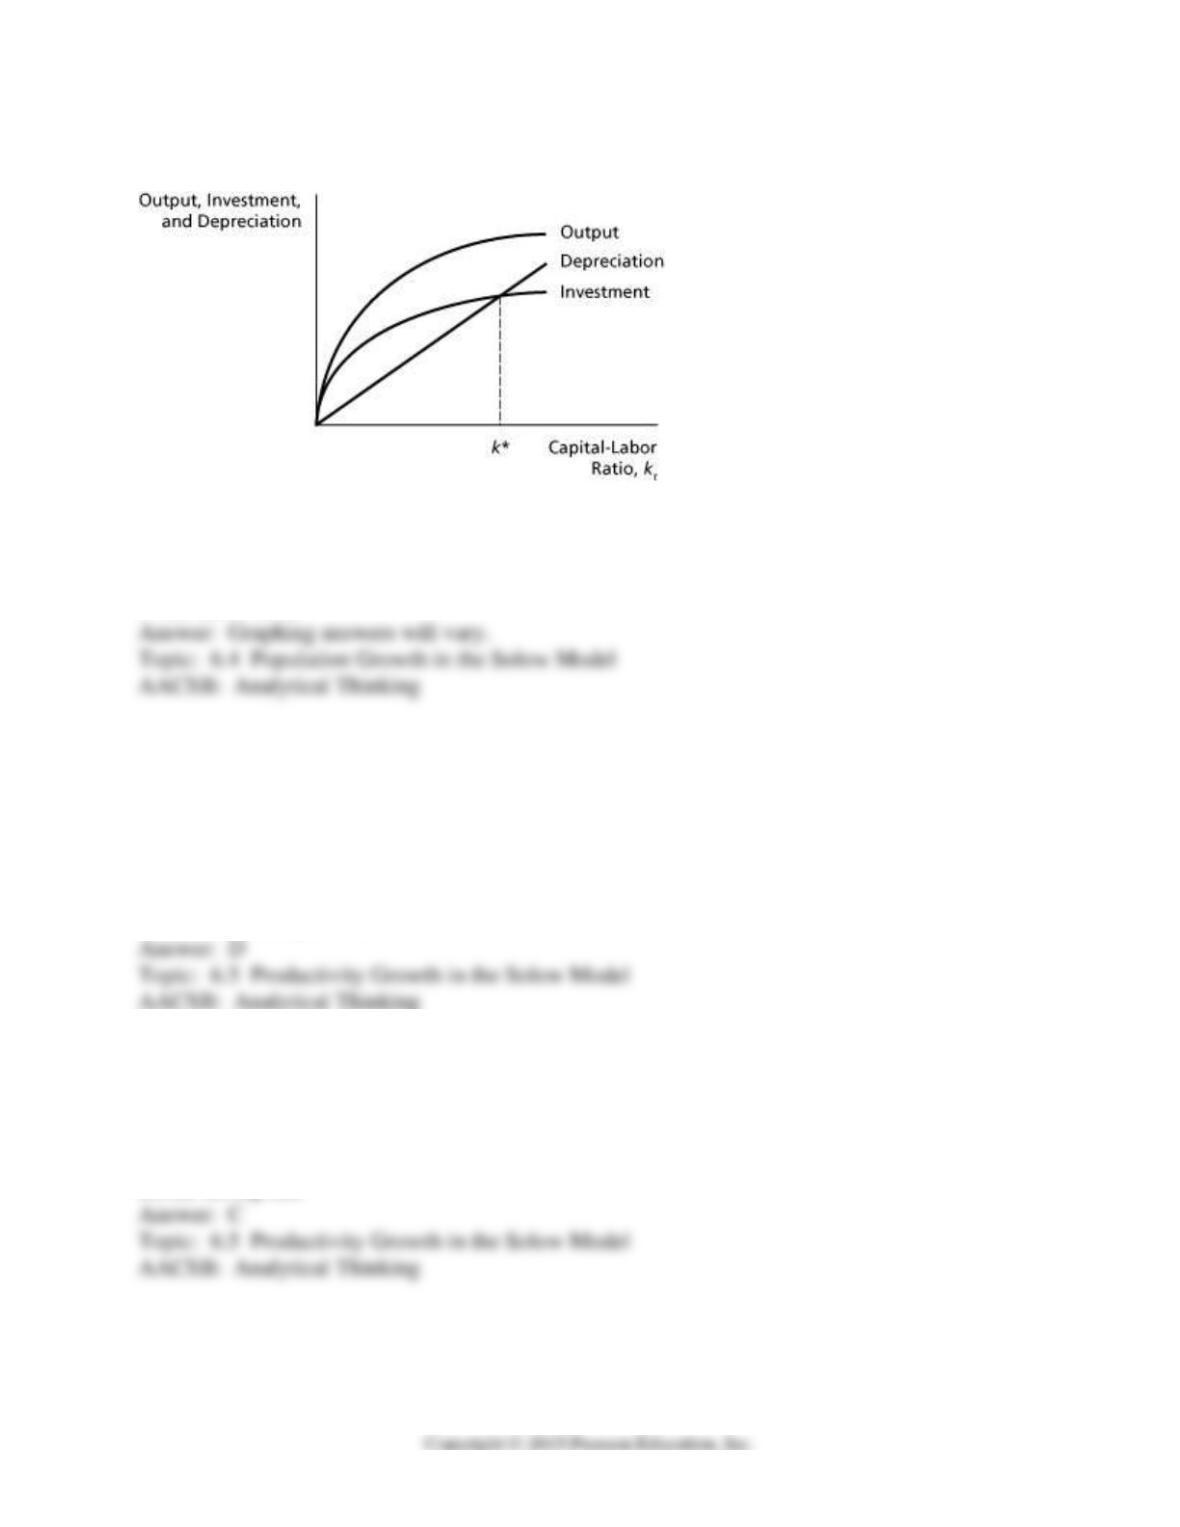
Solow Diagram
13) The diagram above shows a steady state with a constant quantity of labor. Show on the
graph how the steady state is determined if the labor force is growing at some constant rate. On
the graph, show how to measure the change in consumption per worker that results from growth
of the labor force.
6.5 Productivity Growth in the Solow Model
1) When an economy experiences a one-time increase in productivity, there is an immediate
increase in ________.
A) the saving rate
B) the capital-labor ratio
C) the depreciation rate
D) consumption per worker
2) When an economy experiences a one-time increase in productivity, there is an increase in the
long-run, steady state value of ________.
A) the growth rate of output
B) the depreciation rate
C) consumption per worker
D) the saving rate
15
3) Comparing steady states, which of the following is a result of a permanent increase in the
saving rate, but is not a consequence of a one-time increase in productivity?
A) an increase in consumption per worker
B) a decrease in the marginal product of capital
C) an increase in output per worker
D) an increase in the growth rate of output
4) On the Solow Diagram, an increase in productivity is shown by ________.
A) an upward shift of the depreciation plus capital dilution line
B) an upward shift of the investment function
C) a downward shift of the depreciation plus capital dilution line
D) a downward shift of the investment function
5) If productivity is growing at some sustained rate g, then output and capital per worker
________.
A) are growing at the same rate g, in a stable steady state
B) are growing faster than g, because improving technology encourages a higher rate of saving
and investment
C) are growing slower than g, because some of the new capital is merely replacing obsolete
capital
D) are growing faster than g, because productivity does not suffer from diminishing marginal
product
6) The Solow model implies that continuous growth in productivity at a rate of one percent will
result in continuous growth of output per worker at a rate of 1.43%. Thus, if at a point in time
output per worker is 270 and productivity rises by one percent, the resulting level of output per
worker is ________.
A) 386
B) 273
C) 274
D) 277
16
7) A major contribution of the Solow model is its ________.
A) insight into what distinguishes rich economies from poor economies
B) explanation of why productivity grows over time
C) demonstration that the key to sustained growth is a high level of saving
D) encouragement of policies to limit population growth
8) In theory, differences in output across economies and over time might be the result of
differences in either capital input, labor input, or productivity. The evidence points clearly to
productivity as a more likely and powerful source of growth differences. Which aspects of the
Solow growth model help to explain why the inputs of capital and labor contribute little to
growth of output, relative to productivity?
6.6 Summing Up the Solow Model
1) There are no questions for this section.
17
6.7 Sources of Economic Growth: Growth Accounting
1) National output is a function of ________.
A) capital and saving
B) technology, employment and demand
C) labor and depreciation
D) labor, technology and capital
2) The growth accounting equation suggests that the growth rate of output is equal to the growth
rate of ________.
A) total factor productivity plus the contributions of both capital and labor
B) total factor productivity minus the rate of depreciation
C) capital and labor
D) the overall population
3) Capital and labor are distinct from productivity in that ________.
A) productivity is independent of technology changes
B) productivity can only increase over time
C) productivity is subject to diminishing returns
D) capital and labor are subject to diminishing marginal returns
4) Which of the following is the most difficult to measure? Changes in ________.
A) the size of the labor force
B) population
C) the quantity of labor
D) productivity
5) Productivity growth can be measured ________.
A) by dividing output by Kt0.3 Lt0.7
B) by adding the contributions from capital growth and labor growth
C) by subtracting the contributions from capital growth and labor growth from the growth of
output
D) by dividing the growth of output by the contributions from capital growth and labor growth
18
6) Productivity is ________.
A) determined by central bank policy
B) the combined effect of monetary and fiscal policy
C) the residual component of the production function
D) driven by changes in the rate of growth of output
7) If productivity growth equals 3.0 percent, the contribution from capital growth 1.2 percent and
the contribution from labor growth 2.0 percent, then output growth must equal ________.
A) 2.2 percent
B) 4.2 percent
C) 6.2 percent
D) 7.2 percent
8) If the contribution from capital and labor growth in a given economy equals 4.0 percent and
output growth equals 6.4 percent over that same period of time, then productivity growth must
equal ________.
A) 25.6 percent
B) 10.4 percent
C) 2.4 percent
D) 1.6 percent
9) The slowdown in U.S. economic growth in the period 1974-95 was primarily caused by
________.
A) falling labor growth
B) falling capital growth
C) falling productivity growth
D) none of the above
10) The highest rate of U.S. growth was recorded in which of the following periods?
A) 1948-73
B) 1967-83
C) 1974-95
D) 1996-2008
19
11) Economic growth ________.
A) is driven by different elements in different economies
B) is driven primarily by digital technology
C) is driven primarily by labor growth
D) cannot be explained using economic models
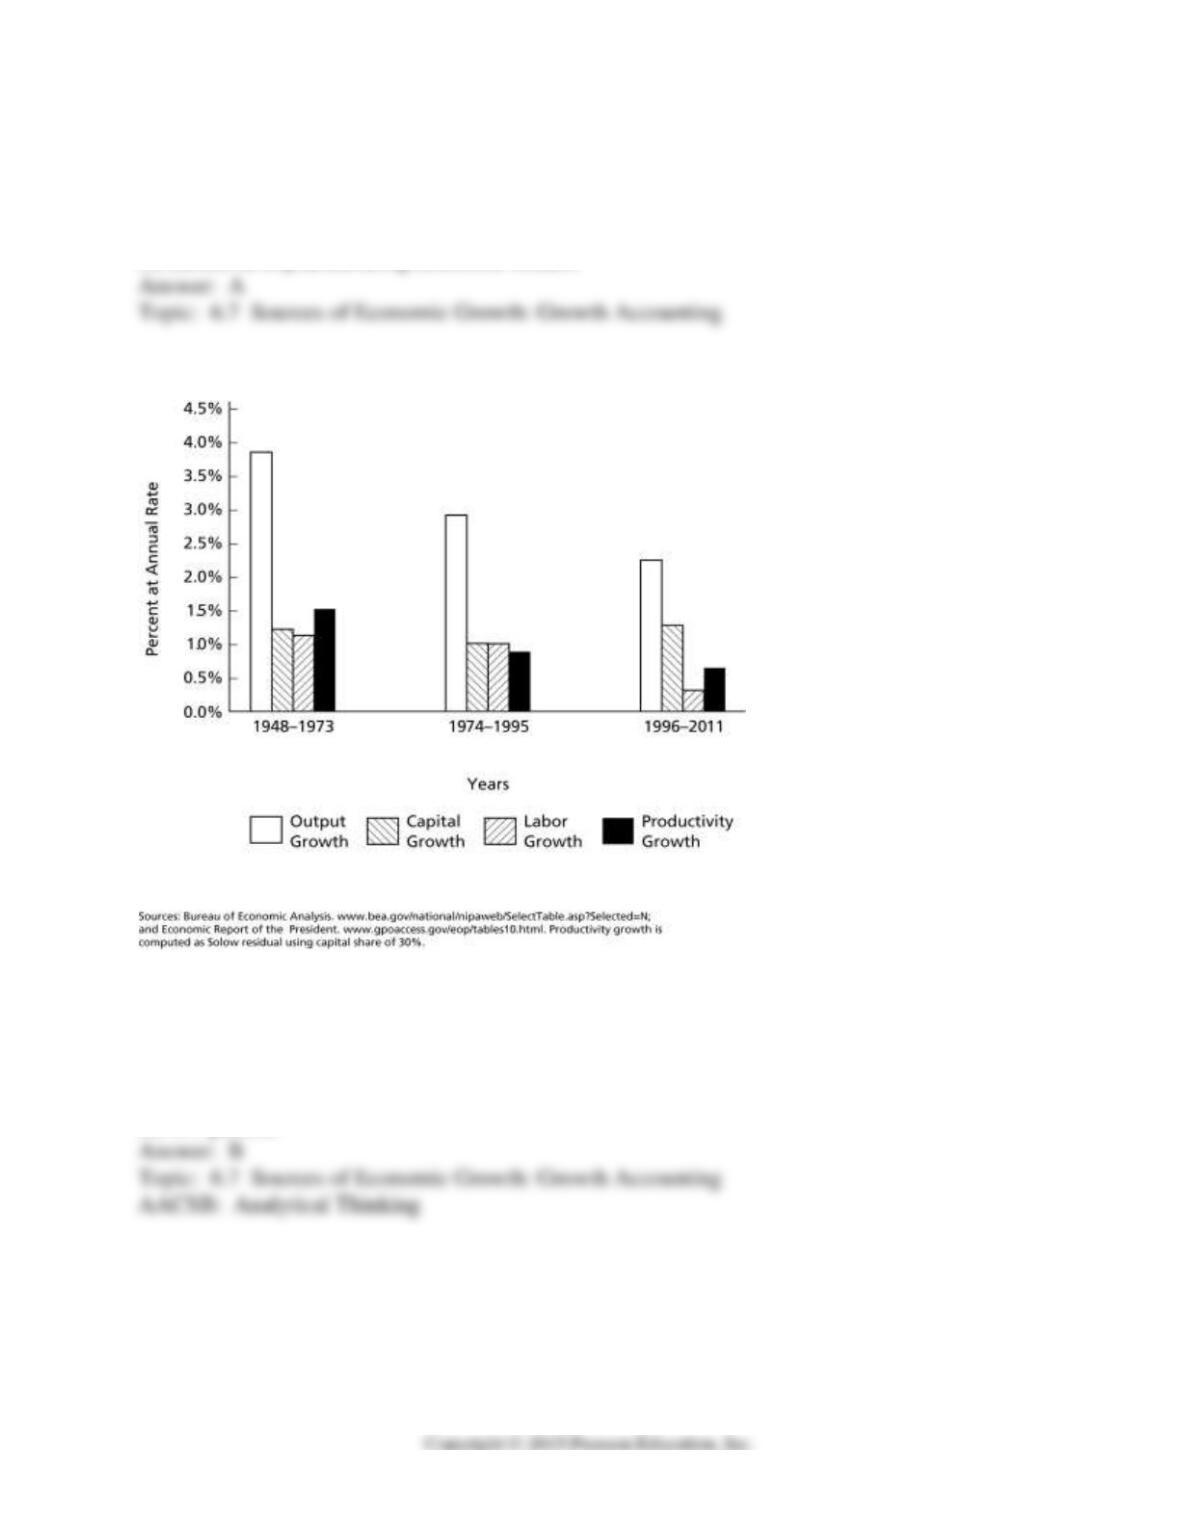
Figure 6.1
12) According to Figure 6.1, the average annual rate of growth of the U.S. economy in the period
1948-73 equalled ________.
A) 1.8 percent
B) 4.0 percent
C) 39 percent
D) 697 percent
13) According to Figure 6.1, the average annual rate of growth of the U.S. economy in the period
1996-2011 equalled ________.
A) 0.3 percent
B) 2.2 percent
C) 30 percent
D) 300 percent
14) According to Figure 6.1, in postwar U.S history ________.
A) productivity growth was always exceeded by labor growth
B) labor growth has always exceeded capital growth
C) productivity growth has always exceeded capital growth
D) output growth has always exceeded productivity growth
15) According to Figure 6.1, the period from 1974 to 1995 is particularly remarkable for the slow
growth of ________.
A) output per worker
B) labor input
C) output
D) capital input
16) According to Figure 6.1, the period from 1996 to 2011 is particularly remarkable for the
rapid growth of ________.
A) productivity
B) labor input
C) output
D) capital input
17) According to Figure 6.1, the period from 1996 to 2011 is particularly remarkable for the slow
growth of ________.
A) productivity
B) labor input
C) output
D) capital input
18) Across national economies which of the following is the most important source of variation
in growth rates?
A) labor growth
B) capital growth
C) productivity growth
D) government regulation
19) The label ‘Asian Tigers’ describes the following economies ________.
A) China, South Korea, Singapore and Taiwan
B) Hong Kong, Taiwan, South Korea and Singapore
C) Singapore, Taiwan, Hong Kong, and China
D) South Korea, Singapore, China and Hong Kong
20) The growth rate of which of the following is not a component of the growth accounting
equation?
A) the capital stock
B) labor
C) depreciation
D) available technology
21) If the contribution from capital growth equals 3 percent and the contribution from
productivity growth equals 1.6 percent, GDP will grow by ________.
A) 1.6 percent
B) 4.6 percent
C) 4.8 percent
D) an unknown value
22
22) If the contribution from capital growth equals 2 percent and the contribution from labor
growth equals 4 percent, then GDP ________.
A) will grow by 6 percent
B) will grow by 8 percent
C) will grow by 2 percent
D) will change by an unknown percentage
23) Given the production function Y = A if output grows by five percent, the capital
input grows by five percent, and the labor input grows by two percent, calculate the Solow
residual. Calculate the growth rates of output per worker and capital per worker.
24) Given the production function Y = A and fixed values for the saving rate and
depreciation, if productivity is growing at an average rate of three percent, and the labor input
grows at two percent, there is a unique growth rate of capital that is sustainable. That is, if the
growth rate of capital is either higher or lower than this steady-state value, then it must
eventually change, even if nothing else in the economy changes. Calculate this steady-state
growth rate of capital, and explain why it alone is a sustainable rate. [Hint: Use the fact that the
growth rates of output and capital per worker are 43% higher than the growth rate of
productivity.]
6.8 Cross-Country Differences in Growth Accounting Rates
1) There are no questions for this section.