121. When a tax is placed on buyers:
122. The relative tax burden borne by buyers and sellers is called the:
123. Tax incidence is:
124. Tax incidence:
125. If the demand curve is more elastic than the supply curve, then:
126. If the demand curve is less elastic than the supply curve, then:
127. If the supply curve is more inelastic than the demand curve, then:
128. If the producers bear a larger portion of tax incidence than the buyers, which of the following must be
true?
129. If the producers bear a smaller tax incidence than the buyers in a market, which of the following
must be true?
130. Policymakers who wish to discourage businesses that pollute by taxing them:
6-58
131. A subsidy:
132. A subsidy:
133.
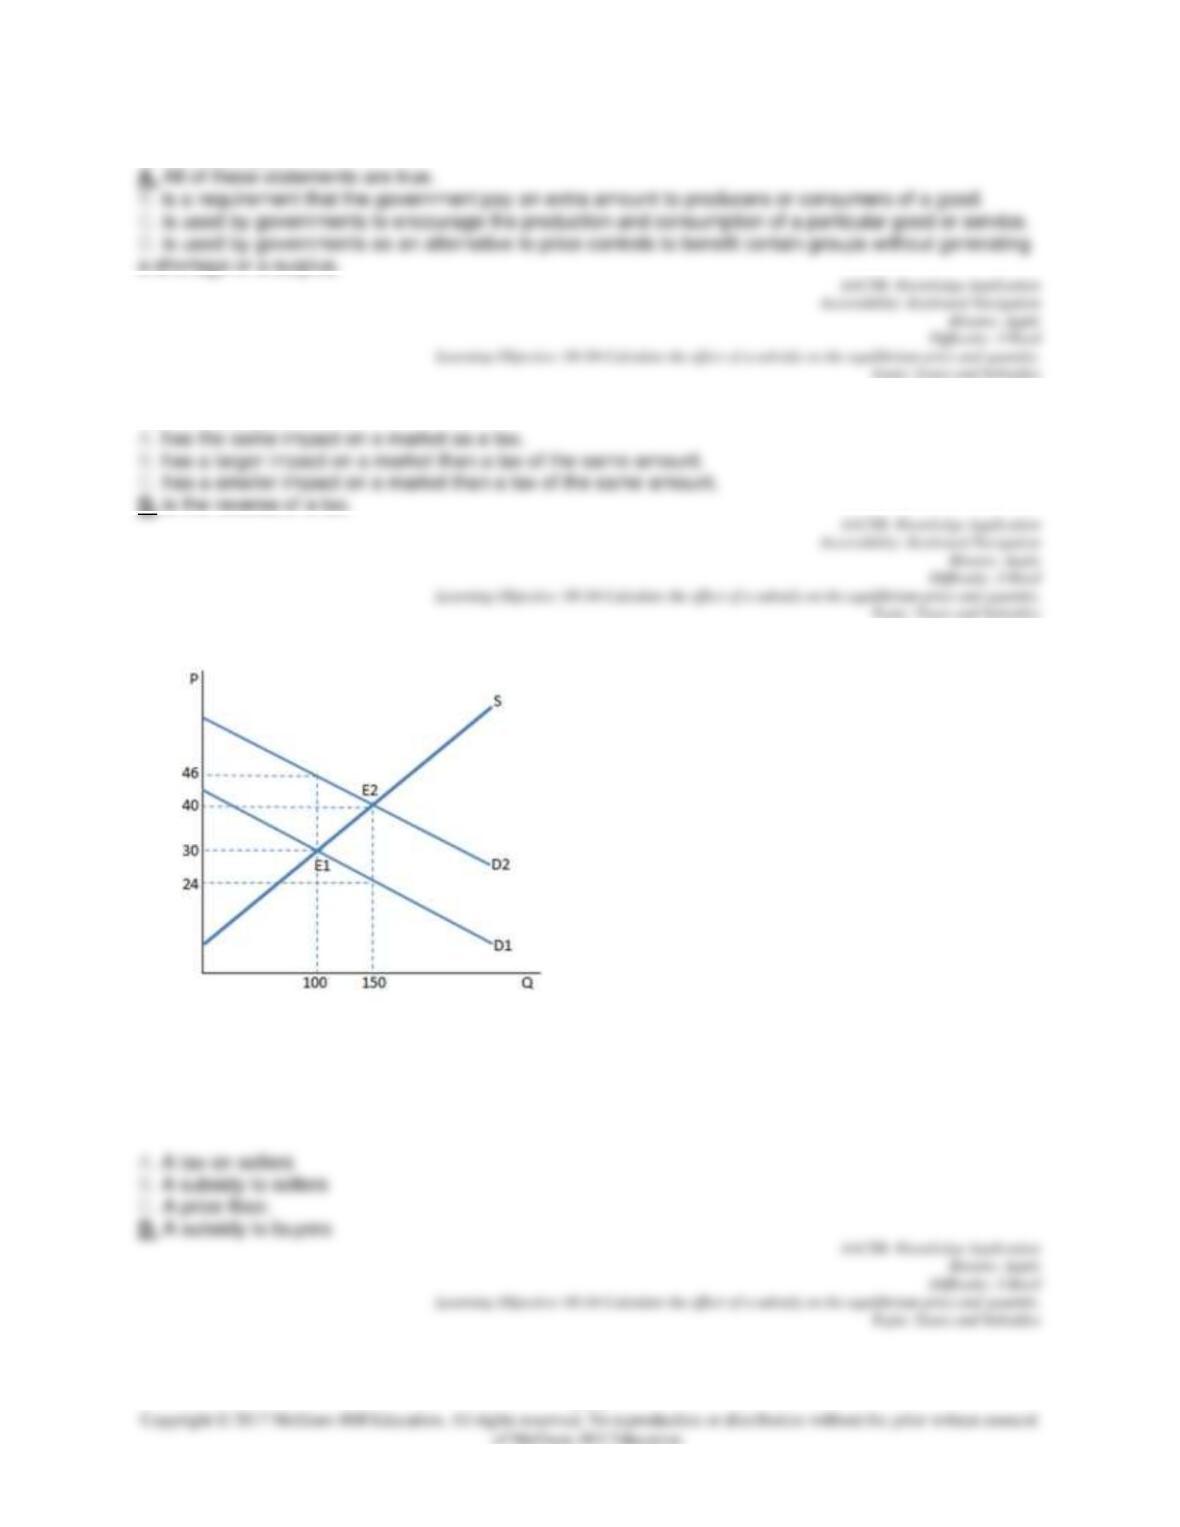
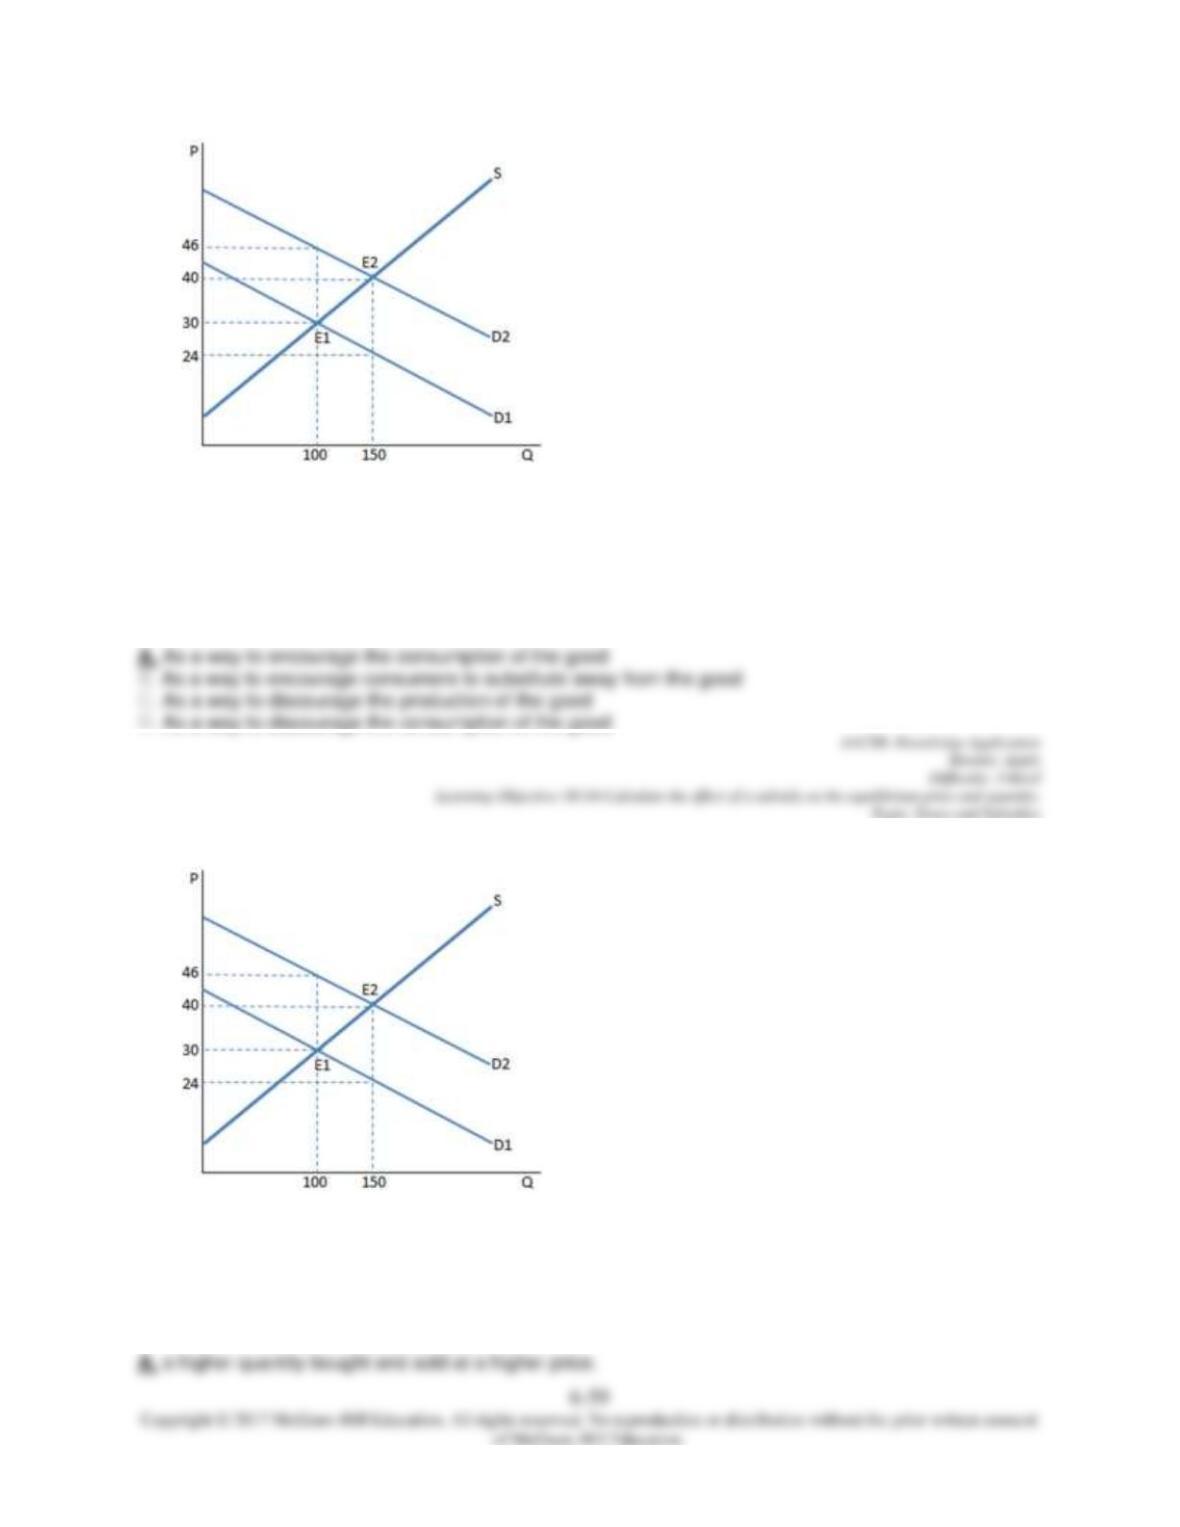
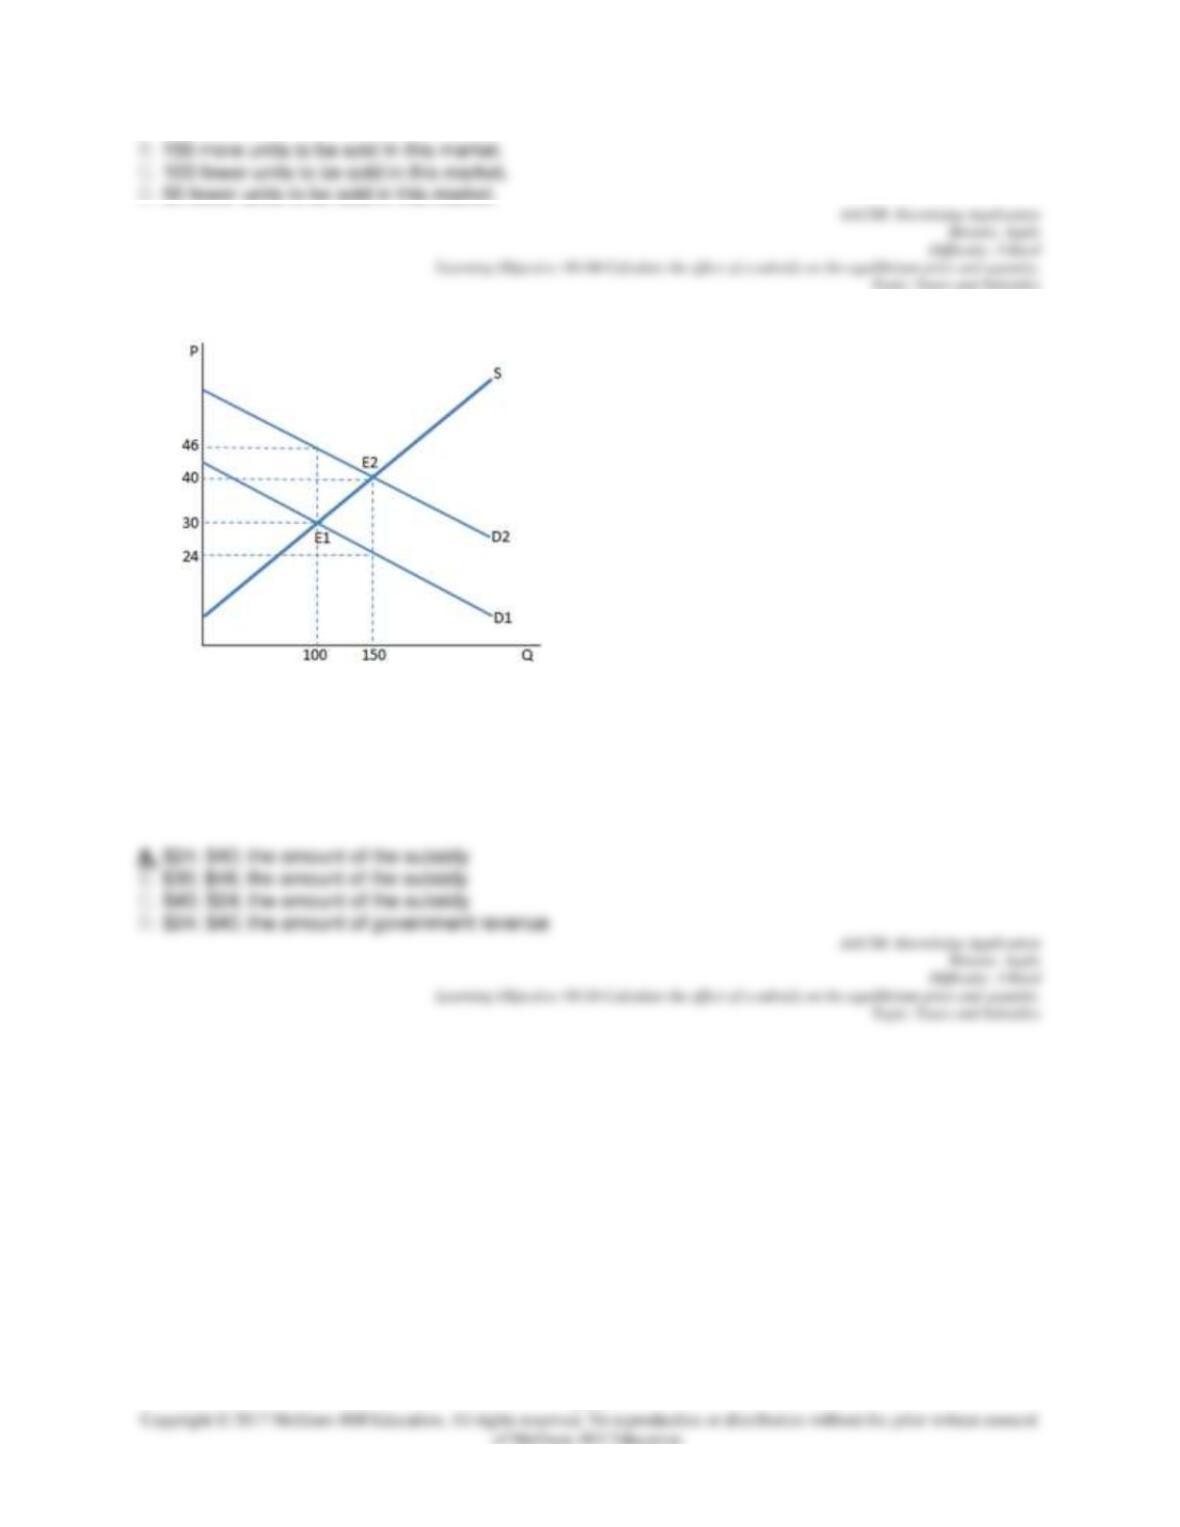
The graph shown best represents which of the following?
134.
A subsidy to buyers has been placed in the market in the graph shown. Why might the government enact
such a policy?
135.
A subsidy to buyers has been placed in the market in the graph shown. The result is:
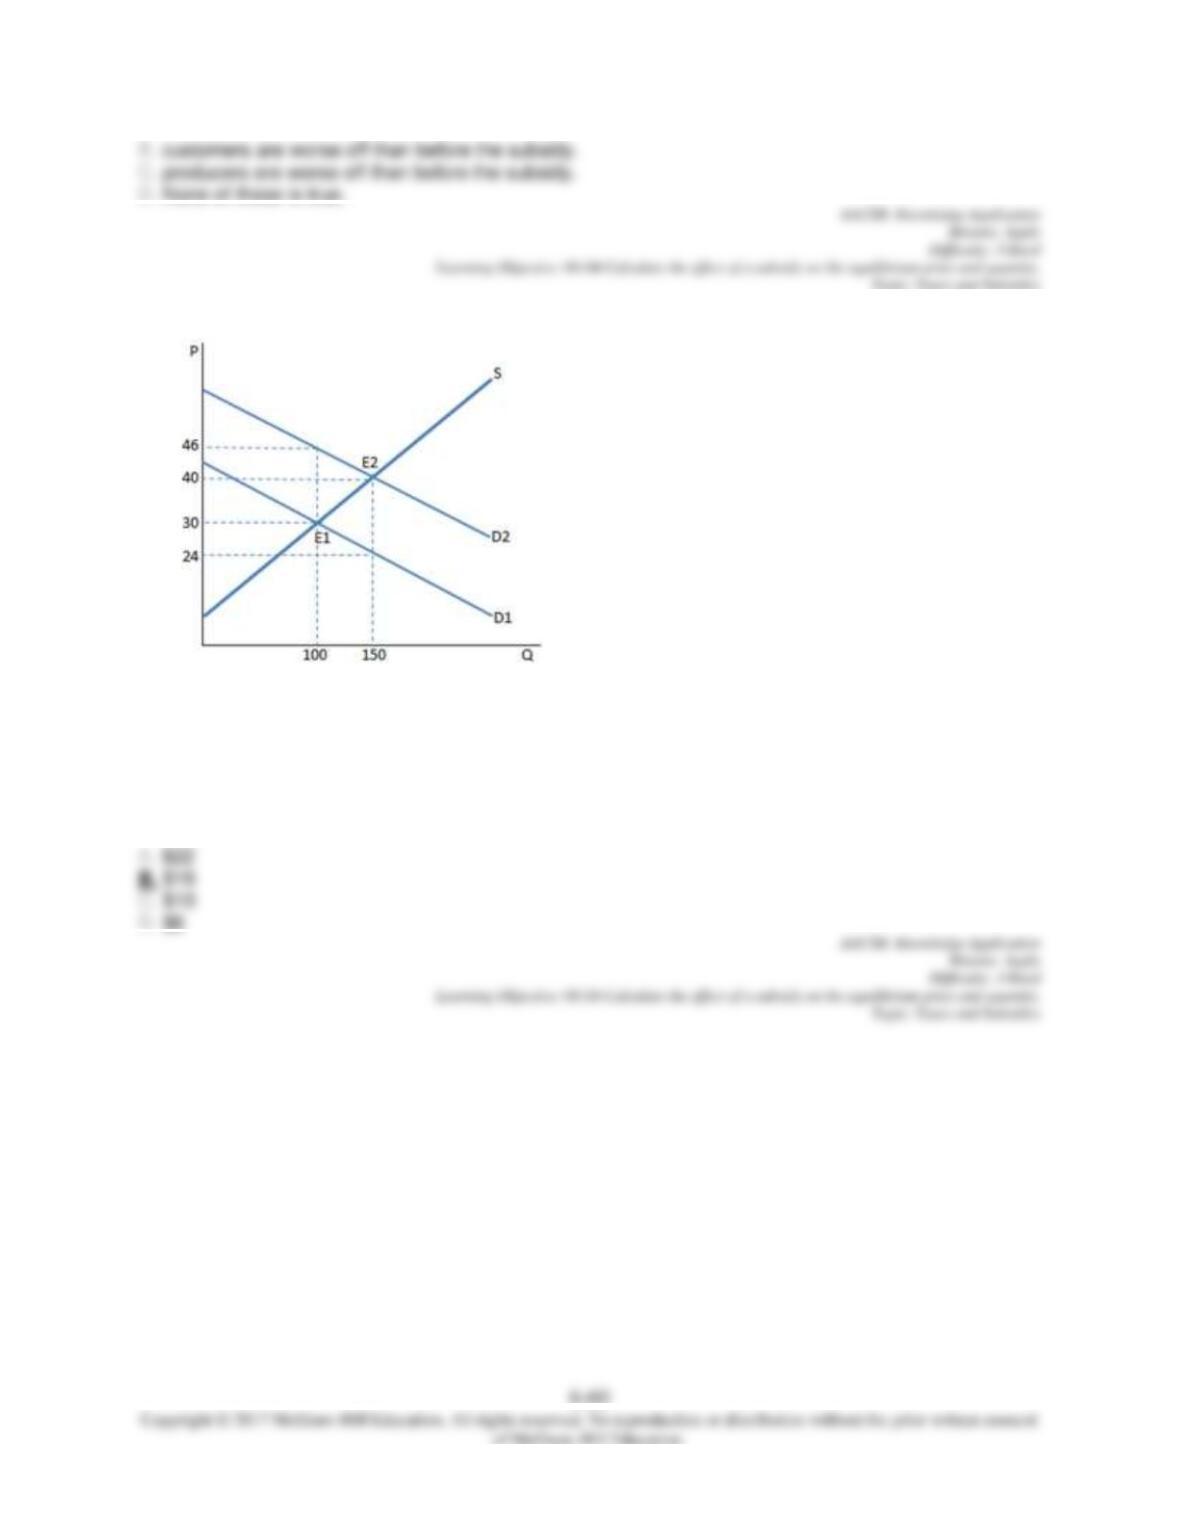
136.
A subsidy to buyers has been placed on the market in the graph shown. What is the amount of the
subsidy per unit of this good?
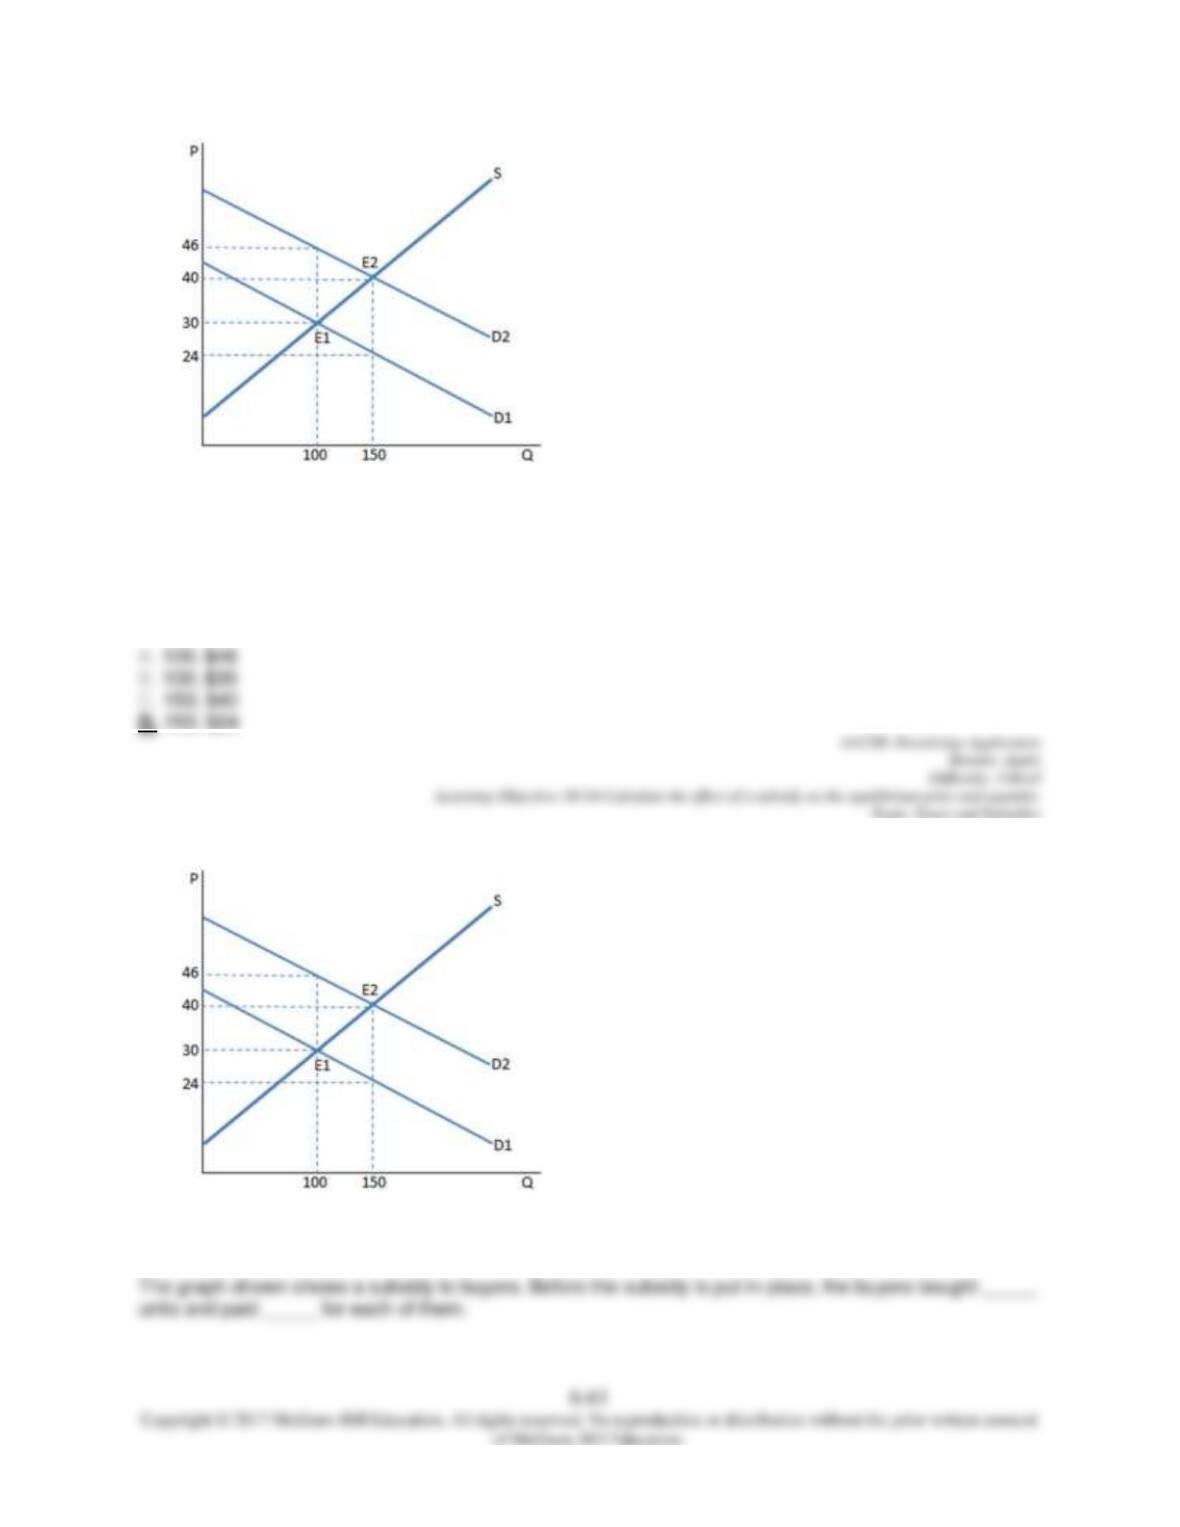
137.
Assume a subsidy to buyers has been enacted in the market in the graph shown. With the subsidy, the
buyers buy _____ units and pay _____ for each of them.
138.
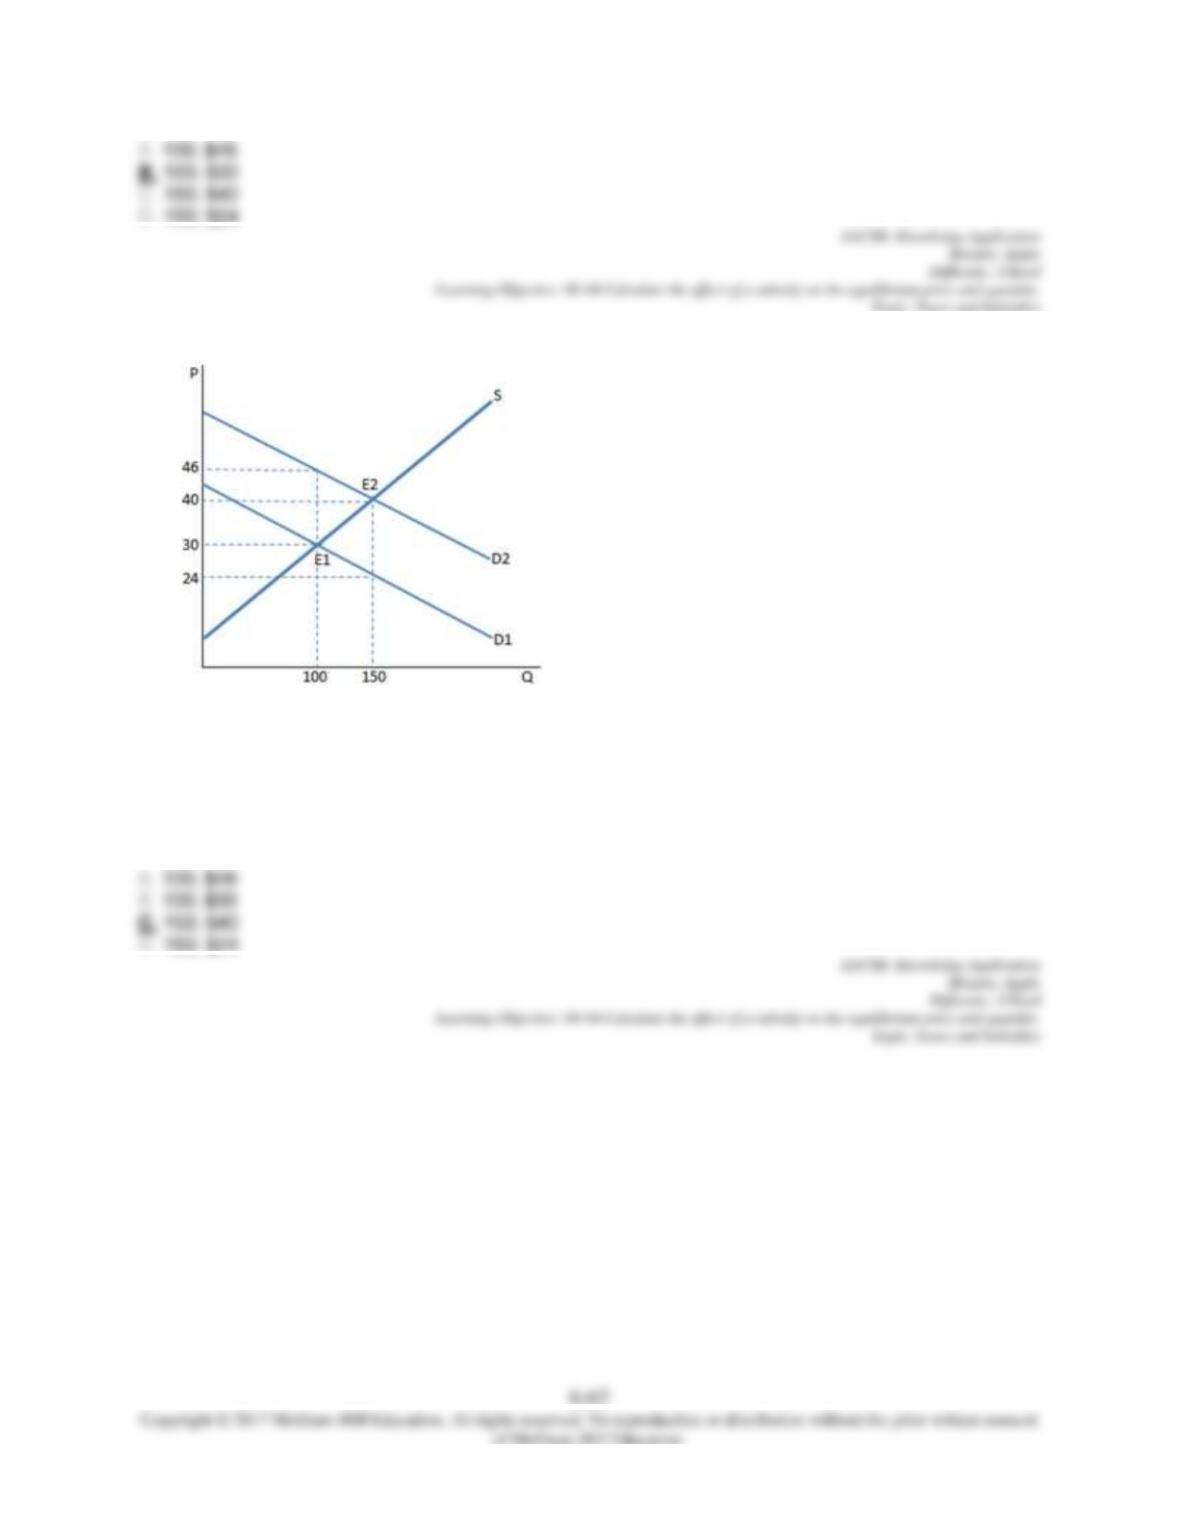
139.
Assume a subsidy to buyers has been enacted in the market in the graph shown. With the subsidy, the
producers sell _____ units and receive _____ for each of them.
6-63
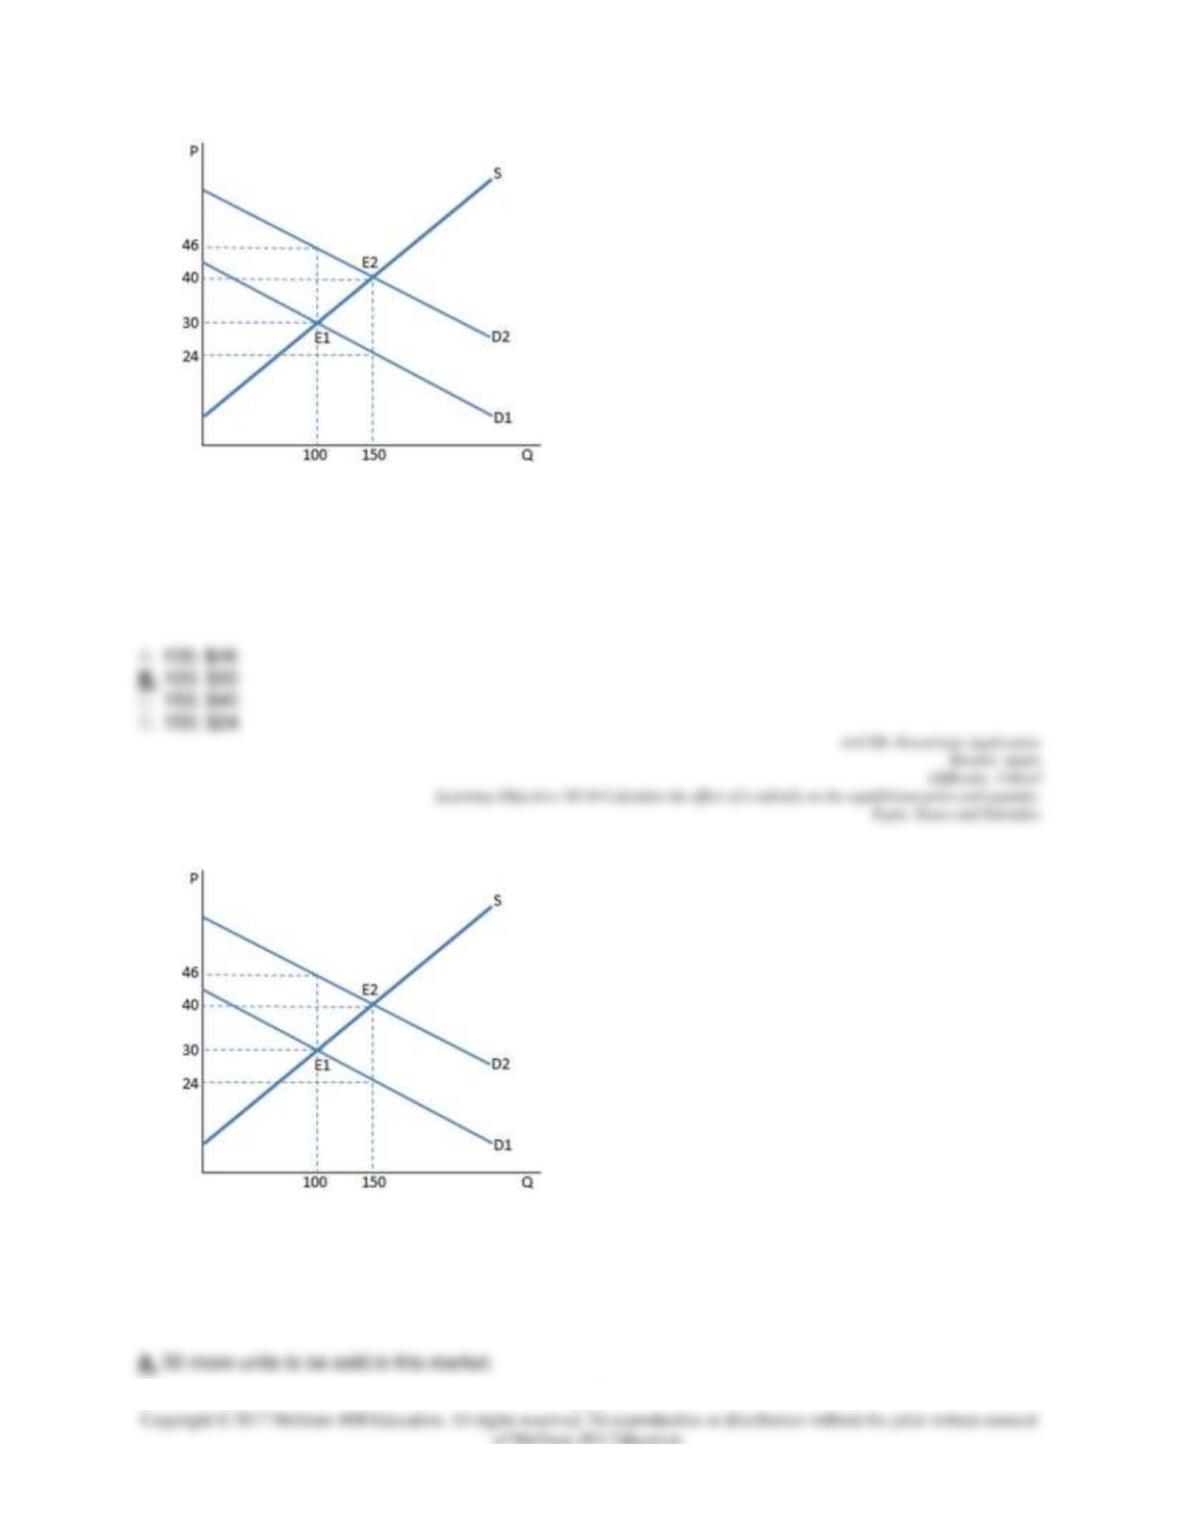
140.
The graph shown portrays a subsidy to buyers. Before the subsidy is put in place, the producers sold
_____ units and received _____ for each of them.
141.
The graph shown portrays a subsidy to buyers. The subsidy causes:
6-64
142.
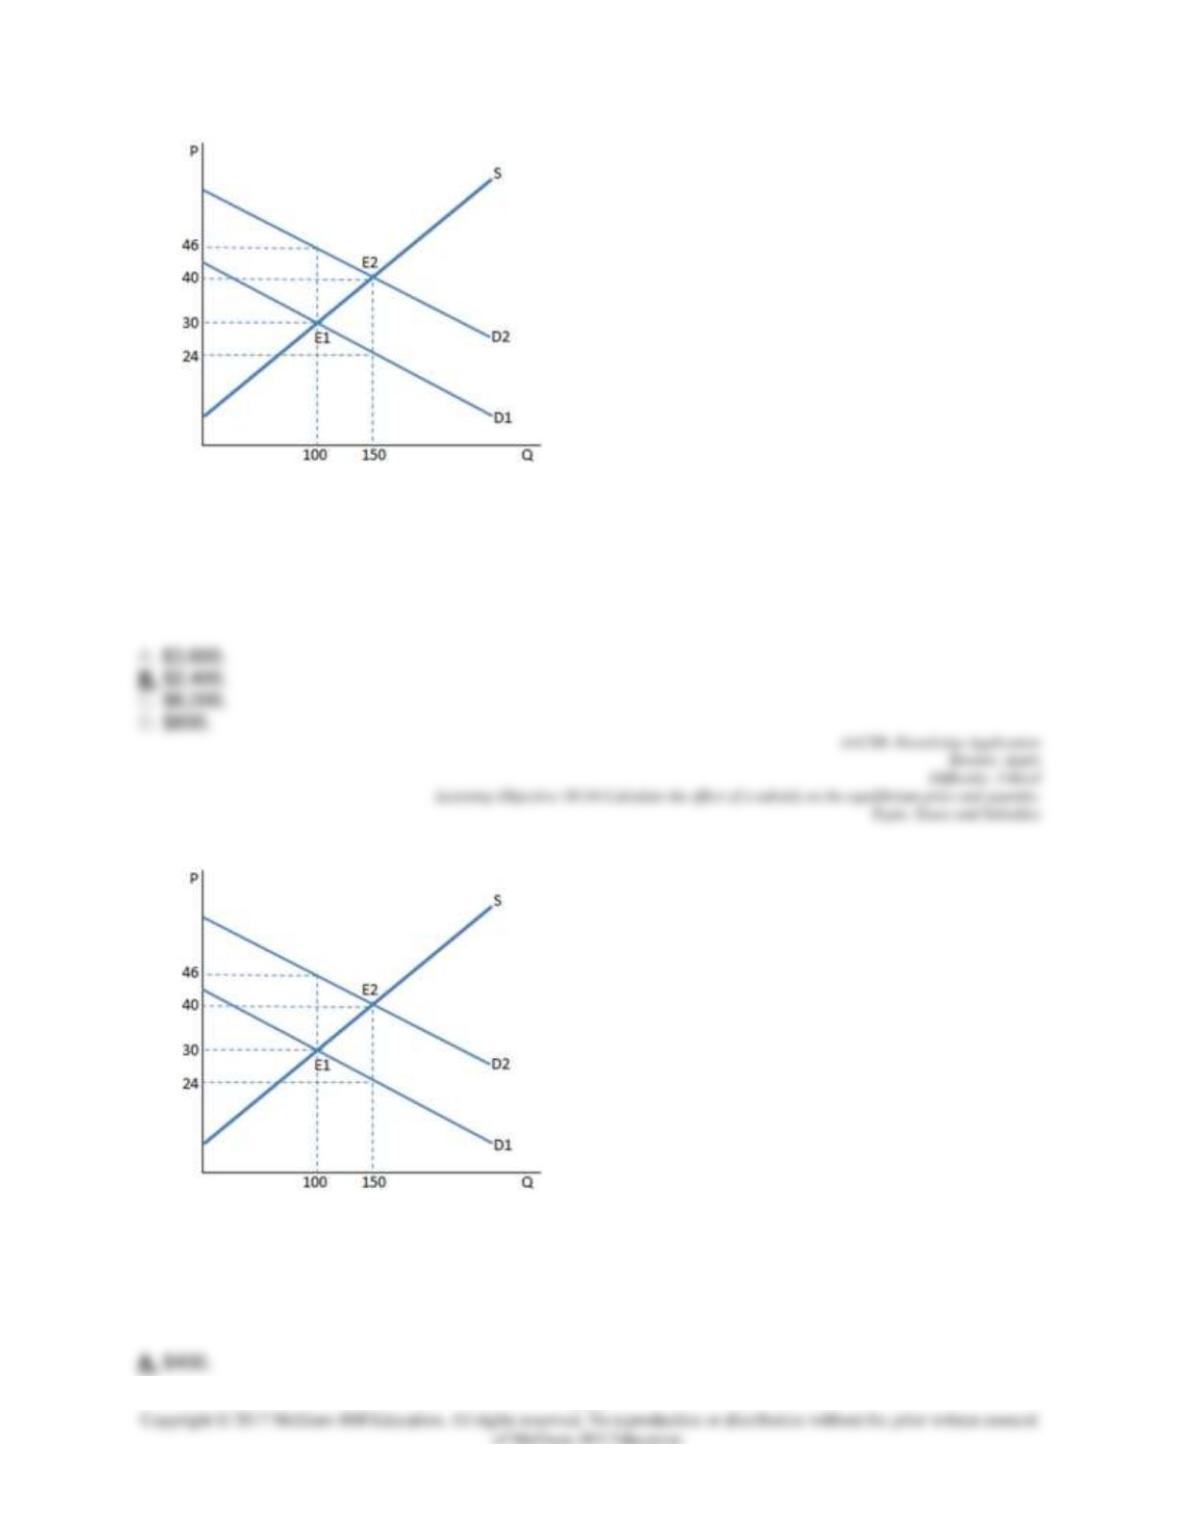
The graph shown portrays a subsidy to buyers. Once the subsidy is in place, the buyers pay _____ and
the sellers receive ________; the difference is ___________.
6-65
143.
The graph shown portrays a subsidy to buyers. The amount of money spent on this subsidy by the
government is:
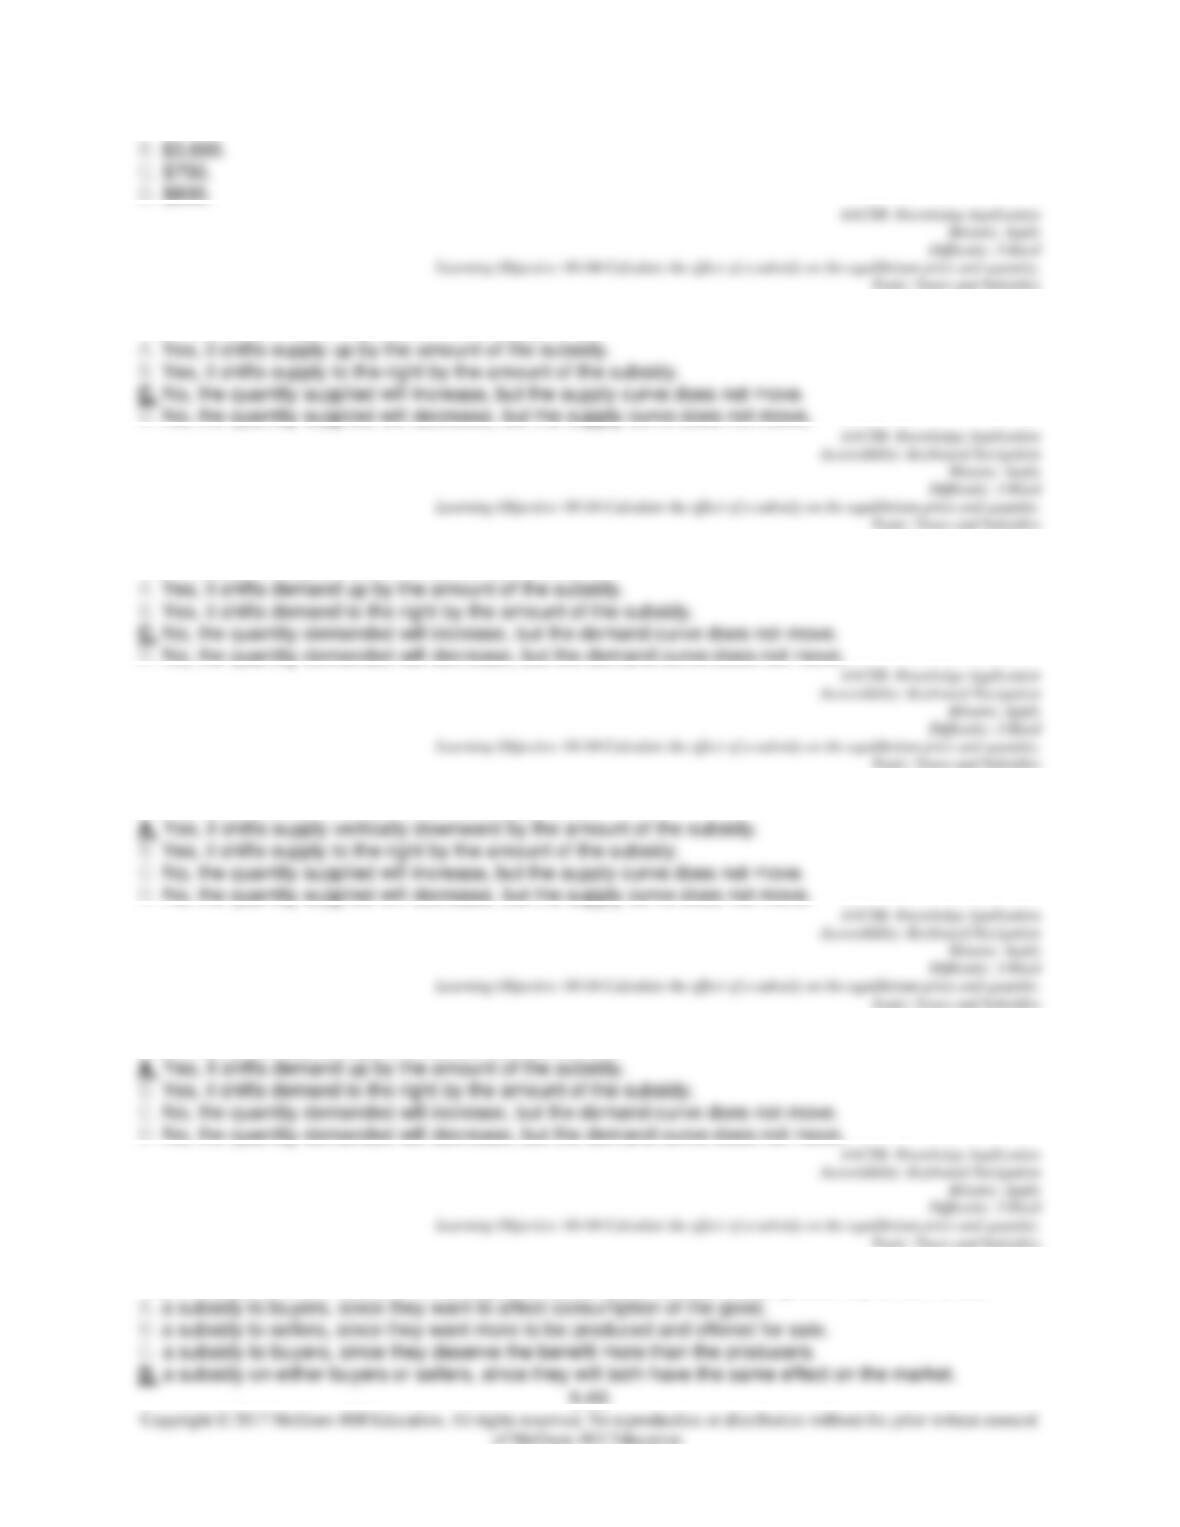
144.
The graph shown portrays a subsidy to buyers. The deadweight loss arising from the subsidy is:
145. Does a subsidy to buyers affect the supply curve?
146. Does a subsidy to sellers affect the demand curve?
147. Does a subsidy to sellers affect the supply curve?
148. Does a subsidy to buyers affect the demand curve?
149. If the government wants to encourage the consumption of a particular good, they should enact:
6-67
150. Who actually benefits from a subsidy to sellers?
151. Who benefits from a subsidy to buyers?
152. Consumers may benefit more than sellers from a subsidy to sellers if:
153. Is it possible for sellers to benefit more than consumers from a subsidy to buyers?
154. The government is deciding where to put a $1 tax-either in a market with elastic supply and demand
curves, or a market with inelastic supply and demand curves. If their aim is to raise the most revenue with
the smallest deadweight loss, where should the tax be placed?
6-68
155. Would you expect a tax on cigarettes to be more effective at discouraging consumption over the long
run or the short run?
156. In general, price controls have a:
Chapter 06 Test Bank Summary
Category
# of Question
s
AACSB: Knowledge Application
149
AACSB: Reflective Thinking
7
Accessibility: Keyboard Navigation
71
Blooms: Apply
149
Blooms: Understand
7
Difficulty: 2 Medium
7
Difficulty: 3 Hard
149
Learning Objective: 06-
01 Calculate the effect of a price ceiling on the equilibrium price and quantity.
53
Learning Objective: 06-
02 Calculate the effect of a price floor on the equilibrium price and quantity.
25
Learning Objective: 06-
03 Calculate the effect of a tax on the equilibrium price and quantity.
52
Learning Objective: 06-
04 Calculate the effect of a subsidy on the equilibrium price and quantity.
19

6-69
Learning Objective: 06-
05 Explain how elasticity and time period influence the impact of a market interventi
on.
7
Topic: Elasticity
11
Topic: Government Interventions
13
Topic: Positive and Normative Analysis
4
Topic: Price Controls
61
Topic: Taxes and Subsidies
65
Topic: Time Period Influence
2