58. The amount of money received in a particular period adjusted for changes in purchasing
power is called:
D. consumer surplus.
59. The amount of money actually received in a particular period is called:
D. consumer surplus.
60. Suppose a consumer’s nominal income is $50,000 and the cost–of-living index is 1.3. The
consumer’s real income is:
A. $50,000.
61. Constructing an accurate cost–of-living index is difficult because:
D. real and nominal income tend to move together.
62. ______ measures the percent change in the cost of a fixed consumption bundle.
D. Real income
63. ______ is a fixed-weight index that is based on a consumption bundle actually purchased
in the base year.
D. The inflation rate
64. Suppose the base year for a Lespeyres index is 2001. The value of the index is 1.3 in 2004
and 1.6 in 2006. By how much did the cost of the bundle increase between 2004 and 2006?
D. 60%
65. When prices are rising:
D. the Lespeyres index tends to understate the increase in the cost of living because of the
consumer preference bias.
66. The substitution bias refers to:
A. the failure of the Lespeyres index to capture a consumer’s tendency to purchase the same
bundle of goods as prices change.
67. The change in the cost of living over time is referred to as:
D. real income.
Essay Questions
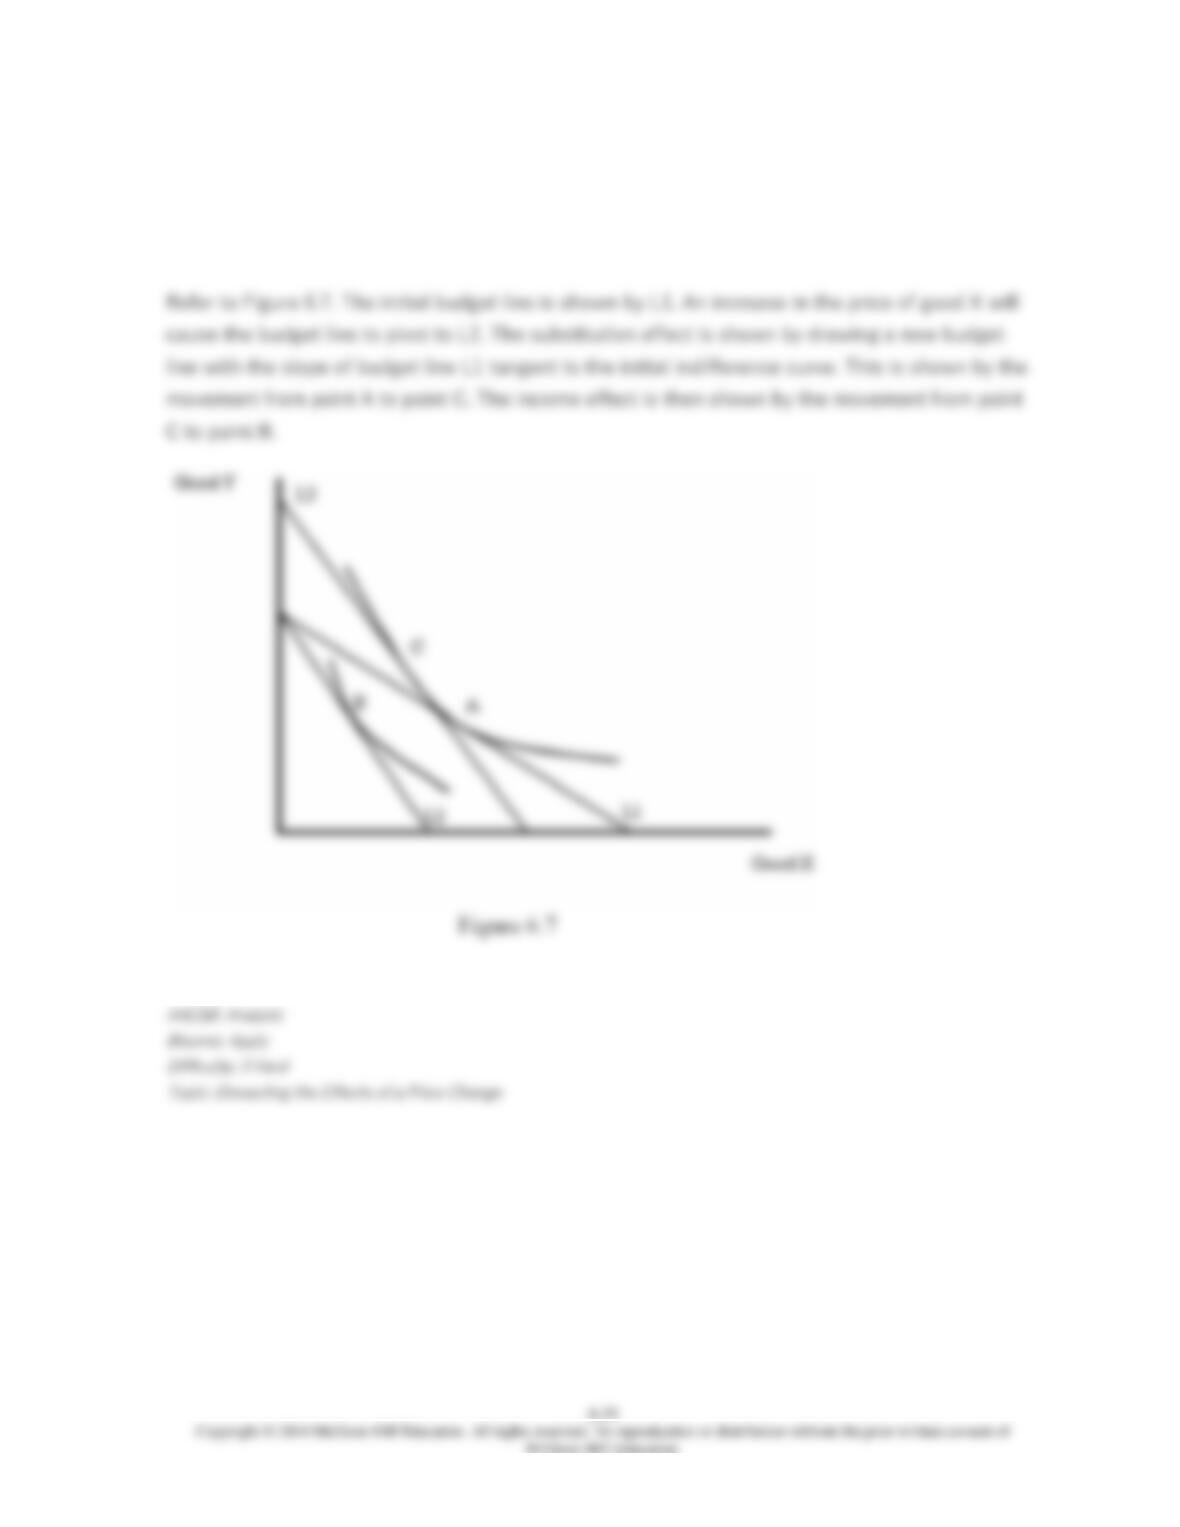
68. Using a graph, explain both the substitution effect and income effect that result from an
increase in the price of a normal good.
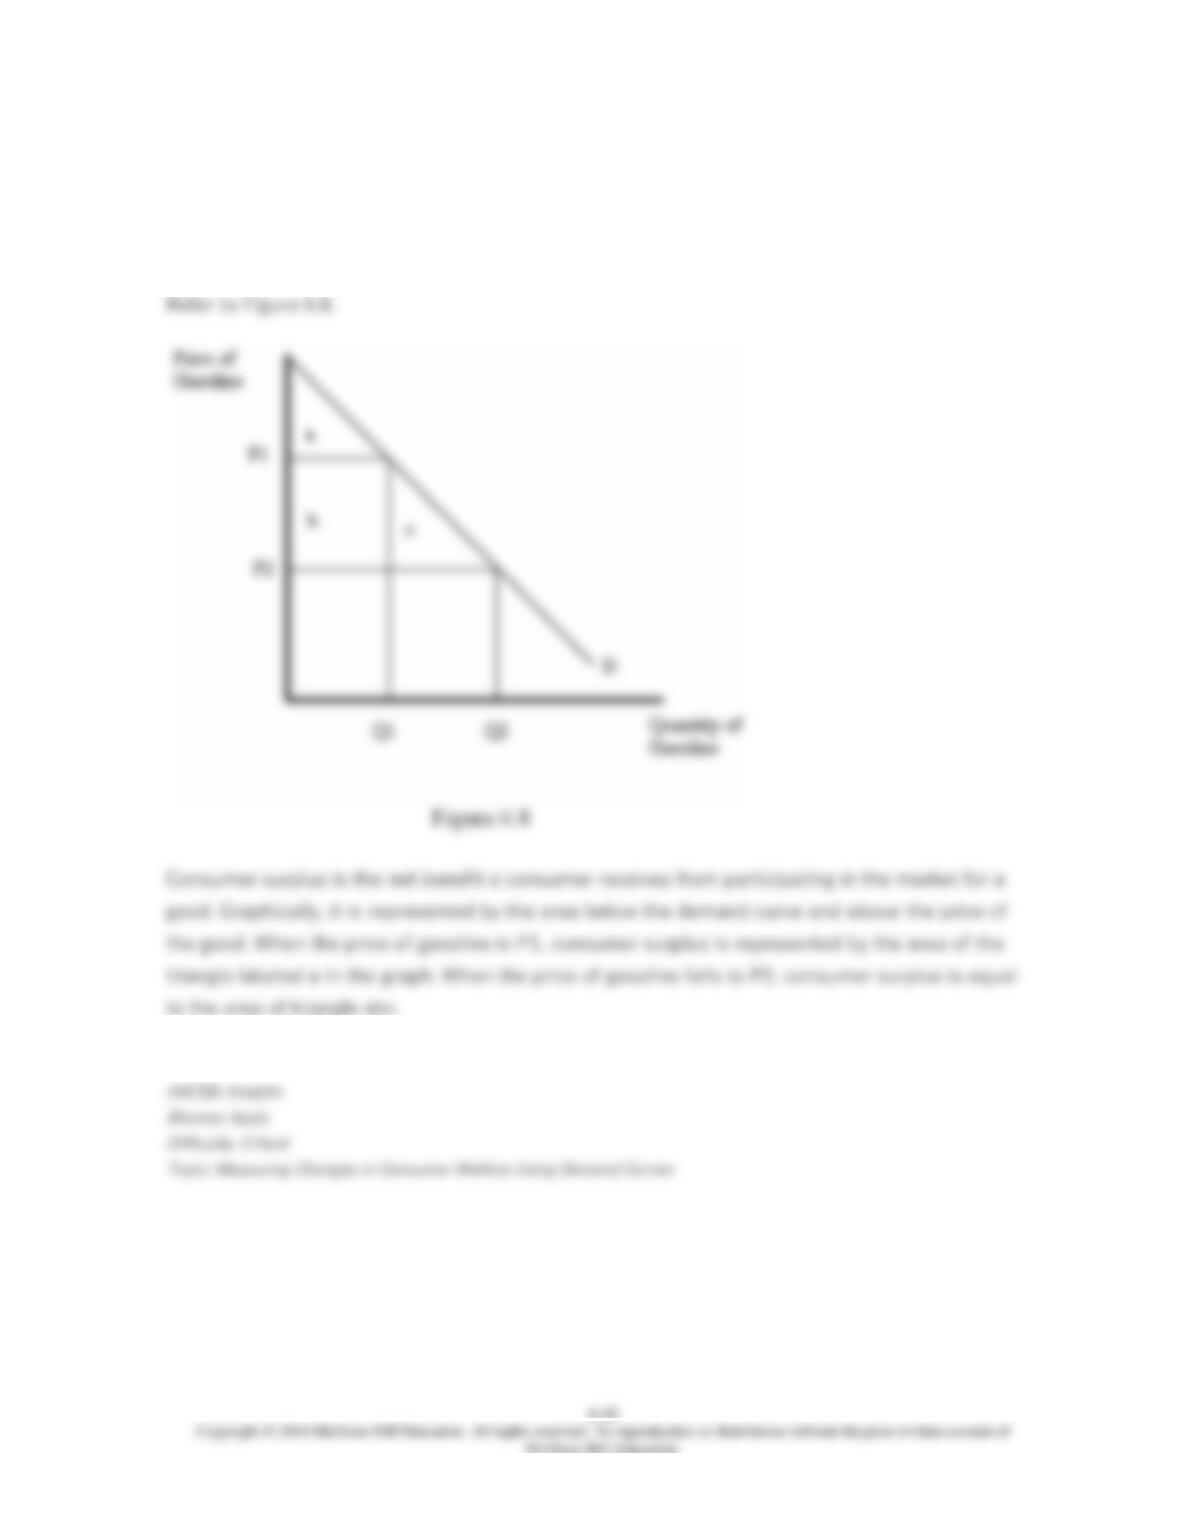
69. Define consumer surplus. Using a graph, explain the change in consumer surplus that
would result from a decrease in the price of a gasoline.
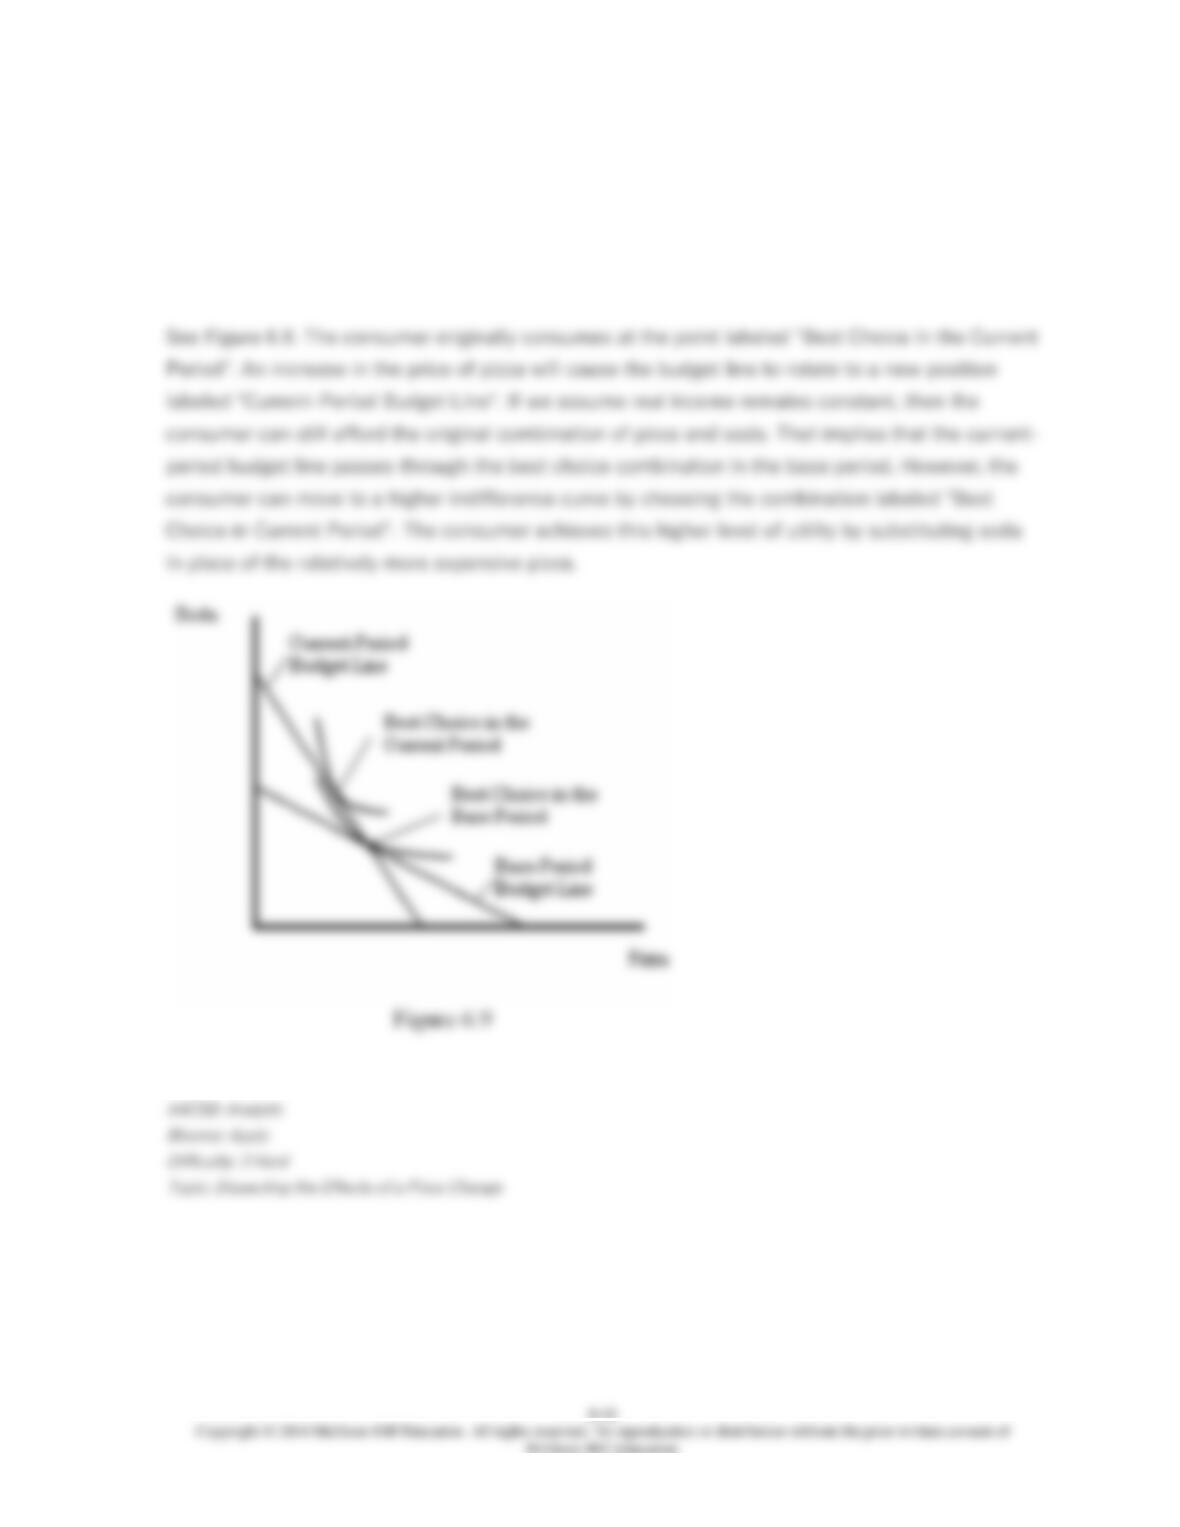
70. Suppose an individual consumes just pizza and soda. Using a graph, explain how the
substitution bias causes the Lespeyres price index to overstate the true change in the cost of
living resulting from an increase in the price of pizza.
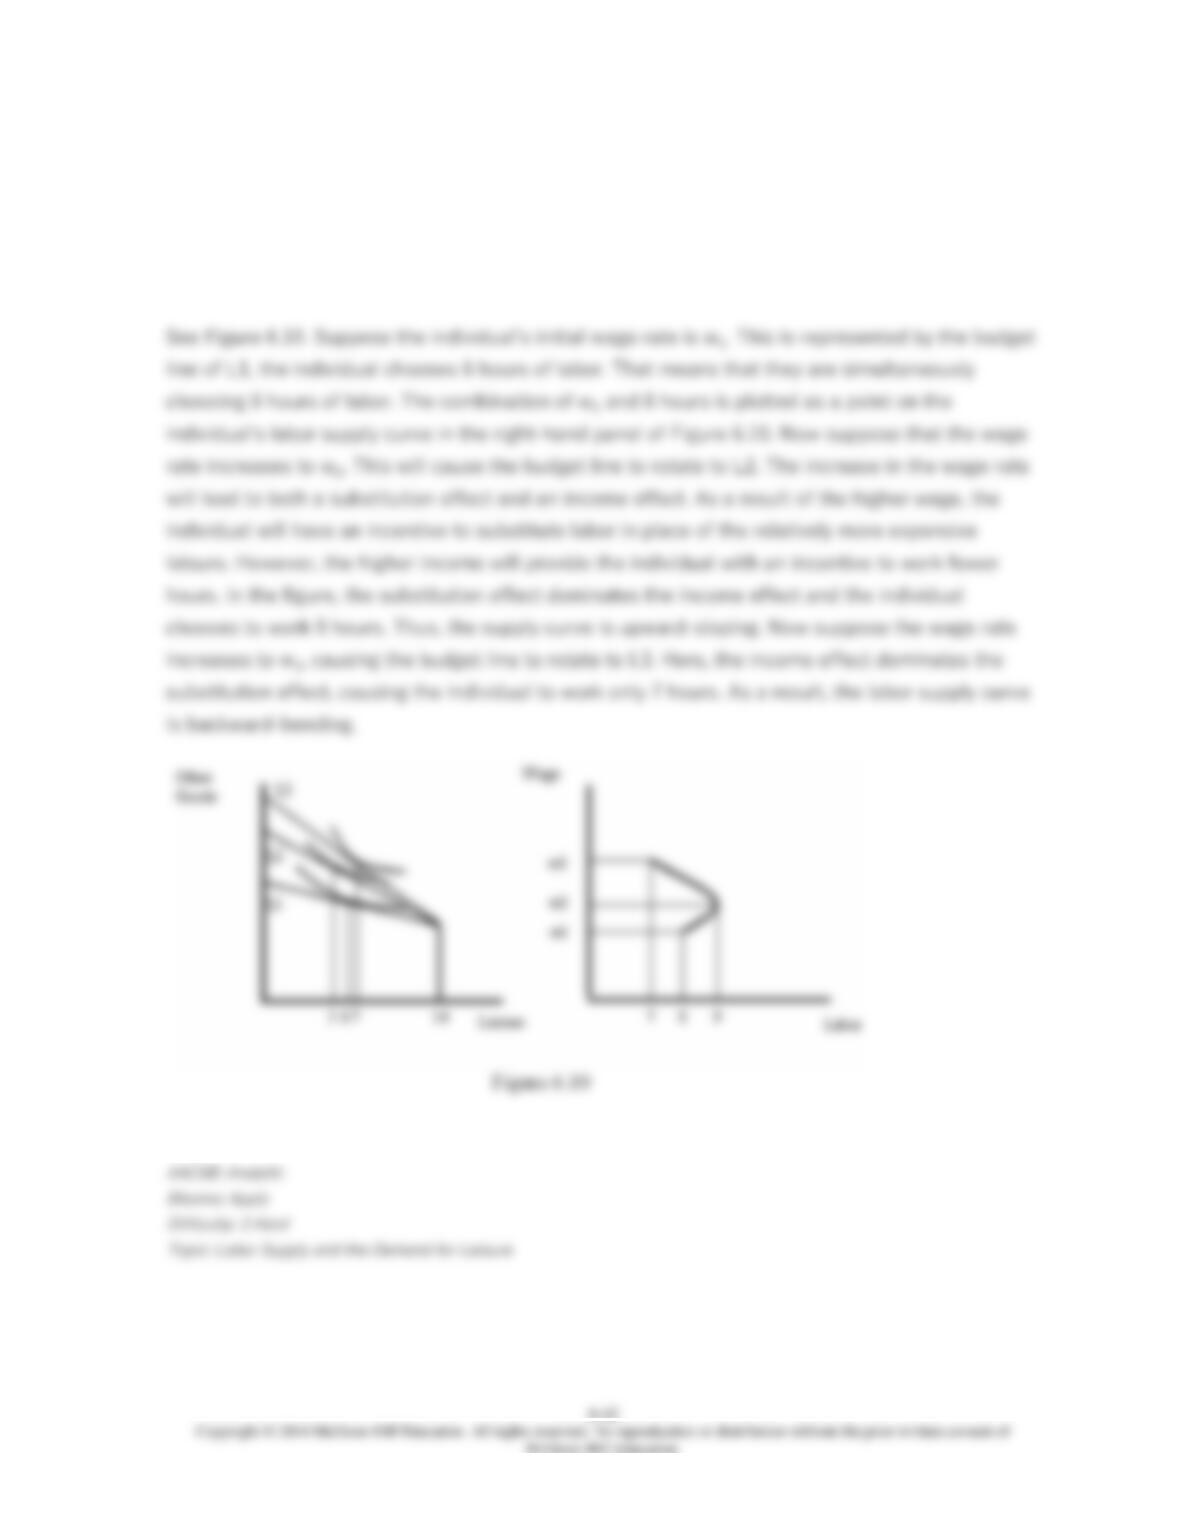
71. Assume an individual has 14 hours per day for either work or leisure. Using an indifference
curve graph, derive an individual’s labor supply curve. In your answer, explain what might cause
the individual’s labor supply curve to eventually bend backwards.
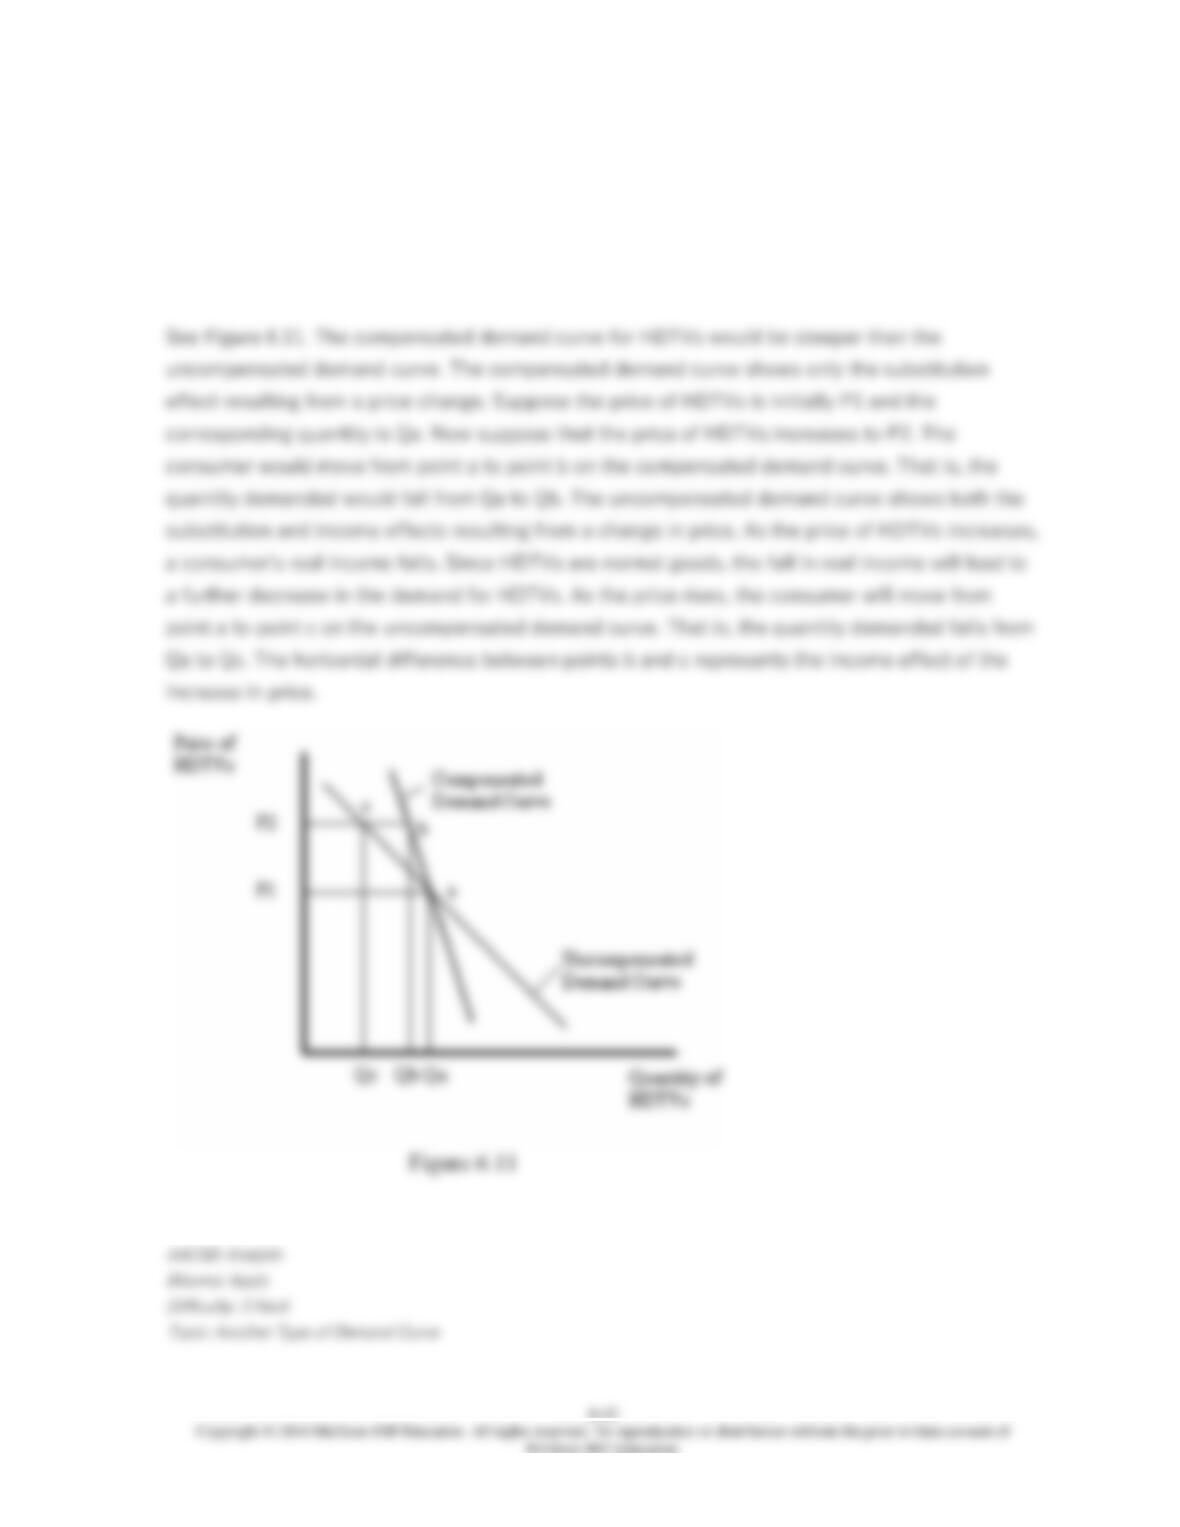
72. Suppose that high-definition television sets (HDTVs) are normal goods. Would the
compensated demand curve for HDTVs be flatter or steeper than the uncompensated demand
curve? Explain your answer using a carefully-labeled graph.
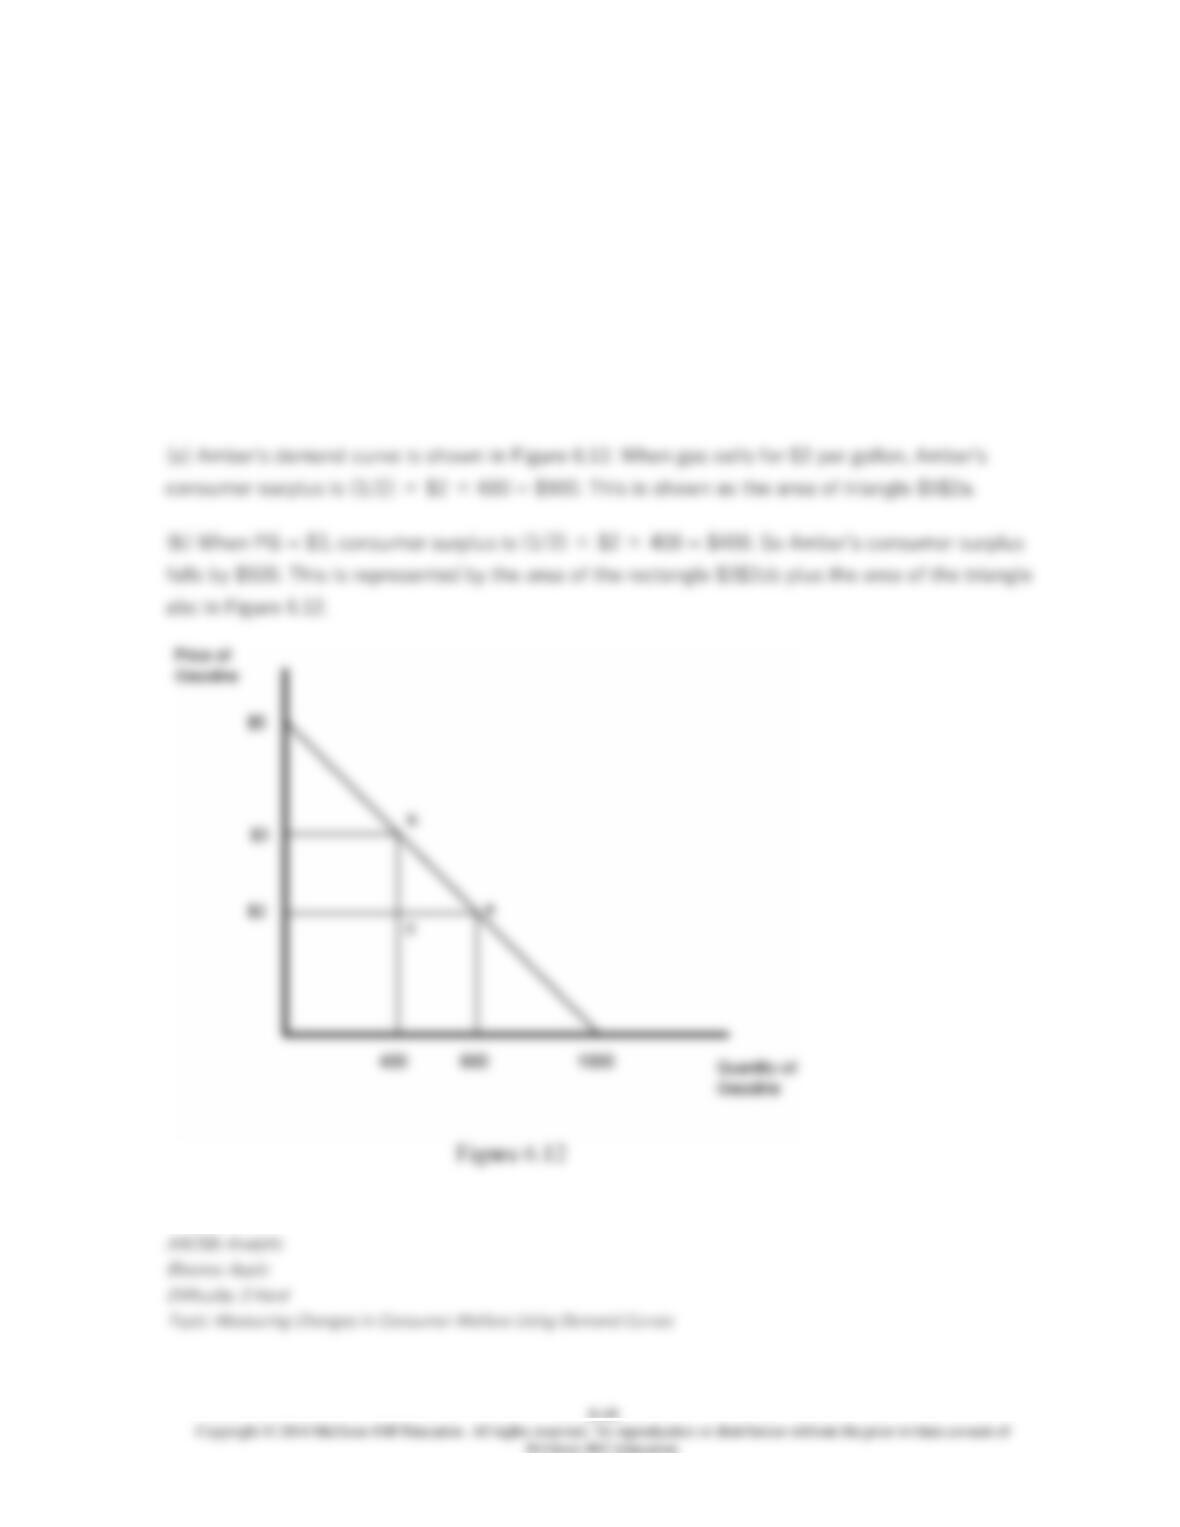
73. Suppose that Amber’s demand for gasoline is given by G = 1000 – 200PG, where G stands
for gallons of gas and PG represents the price of gas.
(a) Suppose gas sells for $2 per gallon. What is Amber’s consumer surplus? Illustrate your answer
graphically.
(b) Suppose the price of gas rises to $3 per gallon. What is the change in Amber’s consumer
surplus? Illustrate this change in your graph.
74. Madison has an income of $50, which she spends on Pizza (P) and soft drinks (S). Her
marginal rate of substitution is MRSPS = S/P. The price of pizza (PP) is $5 and the price of soft
drinks (PS) is $2.50. Finally, the formula for her indifference curves is given by
S = 2U/P
(a) Find Madison’s uncompensated demand curve for pizza.
(b) Find Madison’s compensated demand curve for pizza.