Chapter 06 – Consumer Behavior (+ Appendix)
6-16
16. A consumer has an income of $24 to spend each day. The only two goods the consumer is interested in
purchasing are goods A and B. The marginal-utility schedules for these two goods are shown in the table
below. The price of B does not change and is $2. The marginal utility per dollar from B is also shown in
the table. But the price of A varies as shown in the table. The marginal utility per dollar from A when the
price of A is $8 and $4 is shown in the following table.
Good A Good B
Quantity MU MU/$8 MU/$4 MU MU/$2
1 48 6 12 24 12
2 32 4 8 15 8
3 24 3 6 12 6
4 16 2 4 8 4
5 8 1 2 6 3
6 4 0.5 1 4 2
Complete the table below to show how much of A the consumer will buy each week at each of the two
possible prices of A. Also, show how much B will be demanded when the price of A changes.
Price of A Quantity of A demanded Price of B Quantity of B demanded
$8.00 _____ $2.00 _____
4.00 _____ 2.00 _____
17. Explain the income and substitution effects and use the concepts to describe what happens when the price
of a product decreases.
Chapter 06 – Consumer Behavior (+ Appendix)
6-17
18. What are two related effects that combine to make a consumer able and willing to buy more of a specific
product at a lower price than a higher price? Explain the logic of both effects.
19. A student asserts in class that the income and substitution effects lead to a decrease in the consumption of a
normal good when the price decreases. Do you agree with the statement? Explain using an example.
20. Assume that a person only purchases two goods, food and clothing, and has a fixed budget constraint. Both
goods are normal goods. If the price of food decreases, what will happen to the consumption of clothing
based on the income effect?
21. In a typical month, a family buys six bags of candy bars as snacks when the price of a bag costs $4.00.
When the price of the candy bars falls to $3.00 a bag, the family buys seven bags of candy bars a month.
When the price of a bag of candy bars rises to $6.00, the family buys three bags a month. Answer these
questions: (a) How did the fall in the price affect real income in terms of bags of candy bars? (b) How did
the rise in the price affect real income in terms of bags of candy bars? [Hint: How many bags of candy bars
could the family buy in situation (a) and in situation (b) without changing the amount they spend on candy
Chapter 06 – Consumer Behavior (+ Appendix)
22. How can the utility-maximizing rule be used to explain the substitution and income effect?
23. A vice president of a company argues that the president of the company should raise workers’ wages if the
president wants less absenteeism. The president says that wages probably should be cut so that the workers
could not afford to miss so much work. Evaluate the two views using the income and substitution effects in
your analysis.
24. Use marginal-utility analysis to explain why the growing popularity of iPods over portable digital CD
player.
25. Why would an ounce of gold be priced higher than an ounce of coffee beans, even though coffee is
generally considered more essential than gold? Explain the paradox in terms of marginal and total utility.
Chapter 06 – Consumer Behavior (+ Appendix)
26. Is the following quotation consistent with the theory of consumer behavior? “The yield on time spent
125]
27. A person has a basic choice between eating meals at home and eating meals in a restaurant. The cost of the
food that is eaten at home is $10 per meal. The cost of a restaurant meal is $20. It takes two hours to eat a
meal at home (including preparation time and cleanup time). It takes one hour of time to eat a meal in a
restaurant. The marginal utilities of the home meal and the restaurant meal are the same. The person
values time at $12 per hour. What does the theory of consumer behavior suggest the rational consumer will
28. How does the pricing of medical care in the United States affect the quantity consumed?
29. Meaning well, your grandmother gives you a new wool sweater for your birthday that she knitted herself.
You, however, hate wearing wool. What is the utility problem that you face? What can you do to remedy
the problem?
Chapter 06 – Consumer Behavior (+ Appendix)
30. What are the basic differences between behavior economics and traditional economic theory about
consumer behavior?
31. What three facts about people form the basis for prospect theory?
32. Use prospect theory to explain why a cereal maker faced with a cost increase would prefer to reduce the
size of the box of cereal rather than increase its price to offset the cost increase.
33. How do framing effects affect perceptions of gains or losses? Give an example based on a wage increase
34. Explain the phenomenon of “anchoring” and give an example of it based on a student receiving a good
grade on a test and a resulting consumer purchase.
35. Provide an explanation from behavior economics for why people tend to buy overpriced warranties for
large consumer purchases such as a large-screen TVs.
Chapter 06 – Consumer Behavior (+ Appendix)
6-21
36. A college student paid $50 at the bookstore for a textbook that she uses for a semester. She could sell it
back to the bookstore for $40 but decides to keep it. Another student sees the textbook and asks if he could
37. (Last Word) Describe, using behavioral economic theory, how recent legislation has increased employees’
retirement contributions.
C. Appendix Questions
38. Explain the difference between cardinal and ordinal utility. Which is better to use when modeling
consumer behavior and why?
39. What is shown by the budget line in a two-product (A and B) case? Describe what happens when there is a
change in income or the price of a product.
40. What is the significance of the slope on a two-product budget line? What effect does a change in income
have on the slope? A change in product price?
41. Suppose a consumer has a daily income of $100 and purchases just two goods A and B. The price of good
A is $5 and the price of good B is $4.
(a) What is the slope of the budget line?
(b) Suppose the consumer’s income decreases to $80. What is the new slope?
(c) Suppose the price of product B decreases to $2. What is the new slope?
42. How will an increase in income affect the budget line for two goods, all other things equal? How does an
increase in the price of one good affect the budget line for two goods, all other things equal?
43. Suppose a consumer has a daily income of $48 and purchases just two goods, A and B. The price of A is
$8 and the price of B is $6. In the graph below, draw the budget line for the consumer. Indicate the area of
the below graph that is attainable given the income and the area that is unattainable.
Chapter 06 – Consumer Behavior (+ Appendix)
6-22
44. Why are indifference curves downsloping?
45. What is the rationale for the slope of an indifference curve in a two-product (A and B) case?
46. Explain two important characteristics of indifference curves for two goods.
47. Explain the meaning of the “marginal rate of substitution.”
48. Why can’t indifference curves intersect?
49. What is shown by the indifference map for two goods? Which indifference curve would a consumer want
to be on?
50. What are the conditions for equilibrium in indifference curve analysis?
51. A consumer has a daily income of $120 and purchases two products, X and Y. The price of X is $3 and the
price of Y is $4. The following six pairs of points for X and Y define an indifference schedule: (7,40),
(10,30), (15,20), (20,15), (30,10), and (40,8). In the graph below, draw the budget line and the indifference
curve. What amounts of X and Y will allow the consumer to achieve equilibrium?
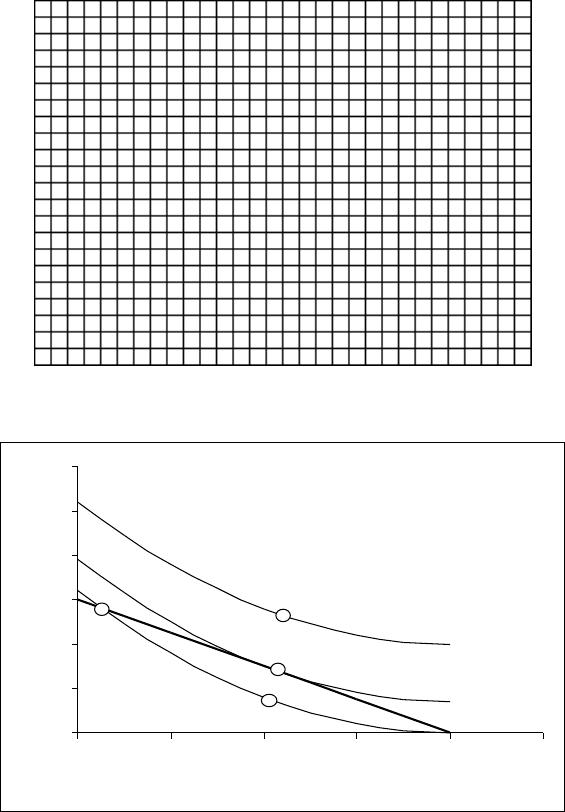
52. The graph below depicts a Bob’s budget line for 2 goods and three indifference curves depicting his
preferences. Use this graph to answer the following questions.
0
10
20
30
40
50
60
010 20 30 40 50
Quantity of A
Quantity of B
B
A
C
D
Chapter 06 – Consumer Behavior (+ Appendix)
6-23
(a) Bob’s friend Martha argues that B represents the least pleasurable bundle for Bob. Do you agree?
(b) Bob’s friend Michael argues that Bob should choose to consume bundle D since it offers him the
highest utility. Do you agree?
(c) If you were a friend of Bob’s, which bundle would you advise him to take?
53. When does the marginal rate of substitution (MRS) in an indifference curve equal the ratio of marginal
utilities in marginal-utility analysis? Explain.
54. What happens to the budget line when the price of a product falls? Use indifference curve analysis to
explain how this change affects consumption of the product.
55. (Consider This) How is an indifference map like a topographic map?
Chapter 06 – Consumer Behavior (+ Appendix)
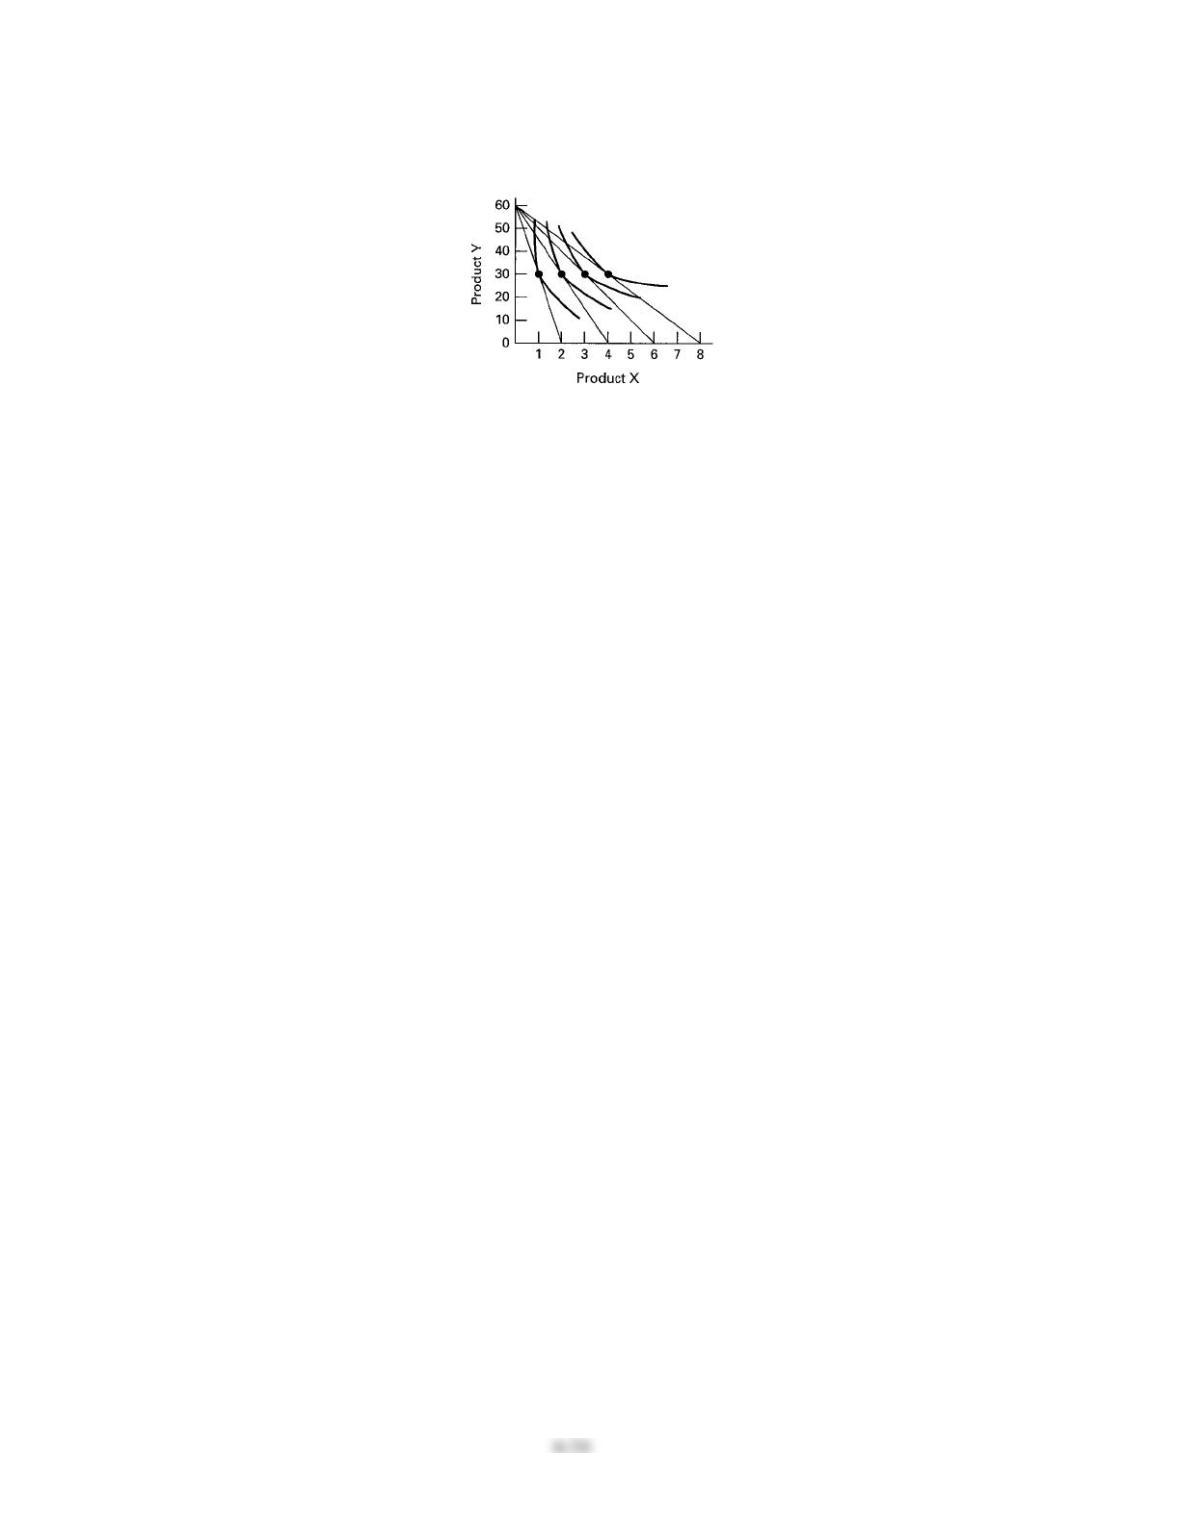
56. Using the below indifference curve graph, determine the demand curve for product X across four different
prices when the income is $60 and price of Y is $1.
Chapter 06 – Consumer Behavior (+ Appendix)
6-25
D. Answers to Appendix Questions
38. Explain the difference between cardinal and ordinal utility. Which is better to use when modeling
consumer behavior and why?
39. What is shown by the budget line in a two-product (A and B) case? Describe what happens when there is a
change in income or the price of a product.
40. What is the significance of the slope on a two-product budget line? What effect does a change in income
have on the slope? A change in product price?
41. Suppose a consumer has a daily income of $100 and purchases just two goods A and B. The price of good
A is $5 and the price of good B is $4.
(a) What is the slope of the budget line?
(b) Suppose the consumer’s income decreases to $80. What is the new slope?
(c) Suppose the price of product B decreases to $2. What is the new slope?
Chapter 06 – Consumer Behavior (+ Appendix)
6-26
42. How will an increase in income affect the budget line for two goods, all other things equal? How does an
increase in the price of one good affect the budget line for two goods, all other things equal?
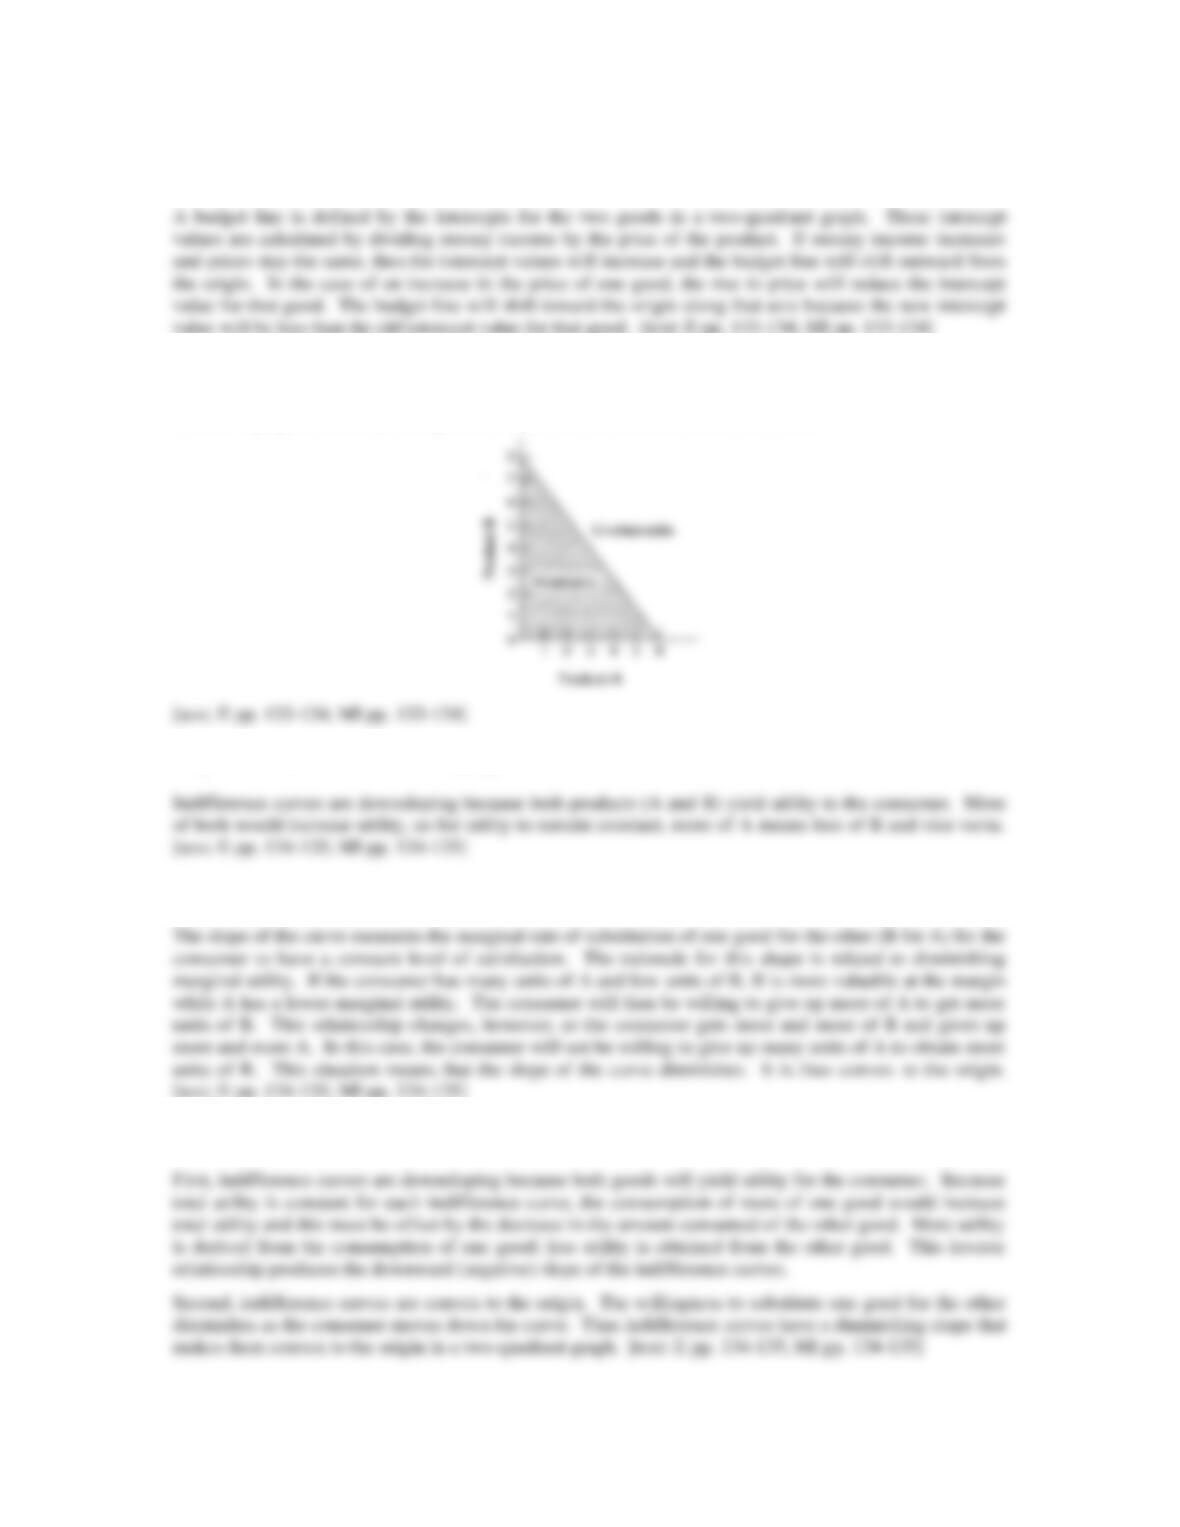
43. Suppose a consumer has a daily income of $48 and purchases just two goods, A and B. The price of A is
$8 and the price of B is $6. In the graph below, draw the budget line for the consumer. Indicate the area of
the below graph that is attainable given the income and the area that is unattainable.
44. Why are indifference curves downsloping?
45. What is the rationale for the slope of an indifference curve in a two-product (A and B) case?
46. Explain two important characteristics of indifference curves for two goods.
Chapter 06 – Consumer Behavior (+ Appendix)
47. Explain the meaning of the “marginal rate of substitution.”
48. Why can’t indifference curves intersect?
49. What is shown by the indifference map for two goods? Which indifference curve would a consumer want
to be on?
50. What are the conditions for equilibrium in indifference curve analysis?
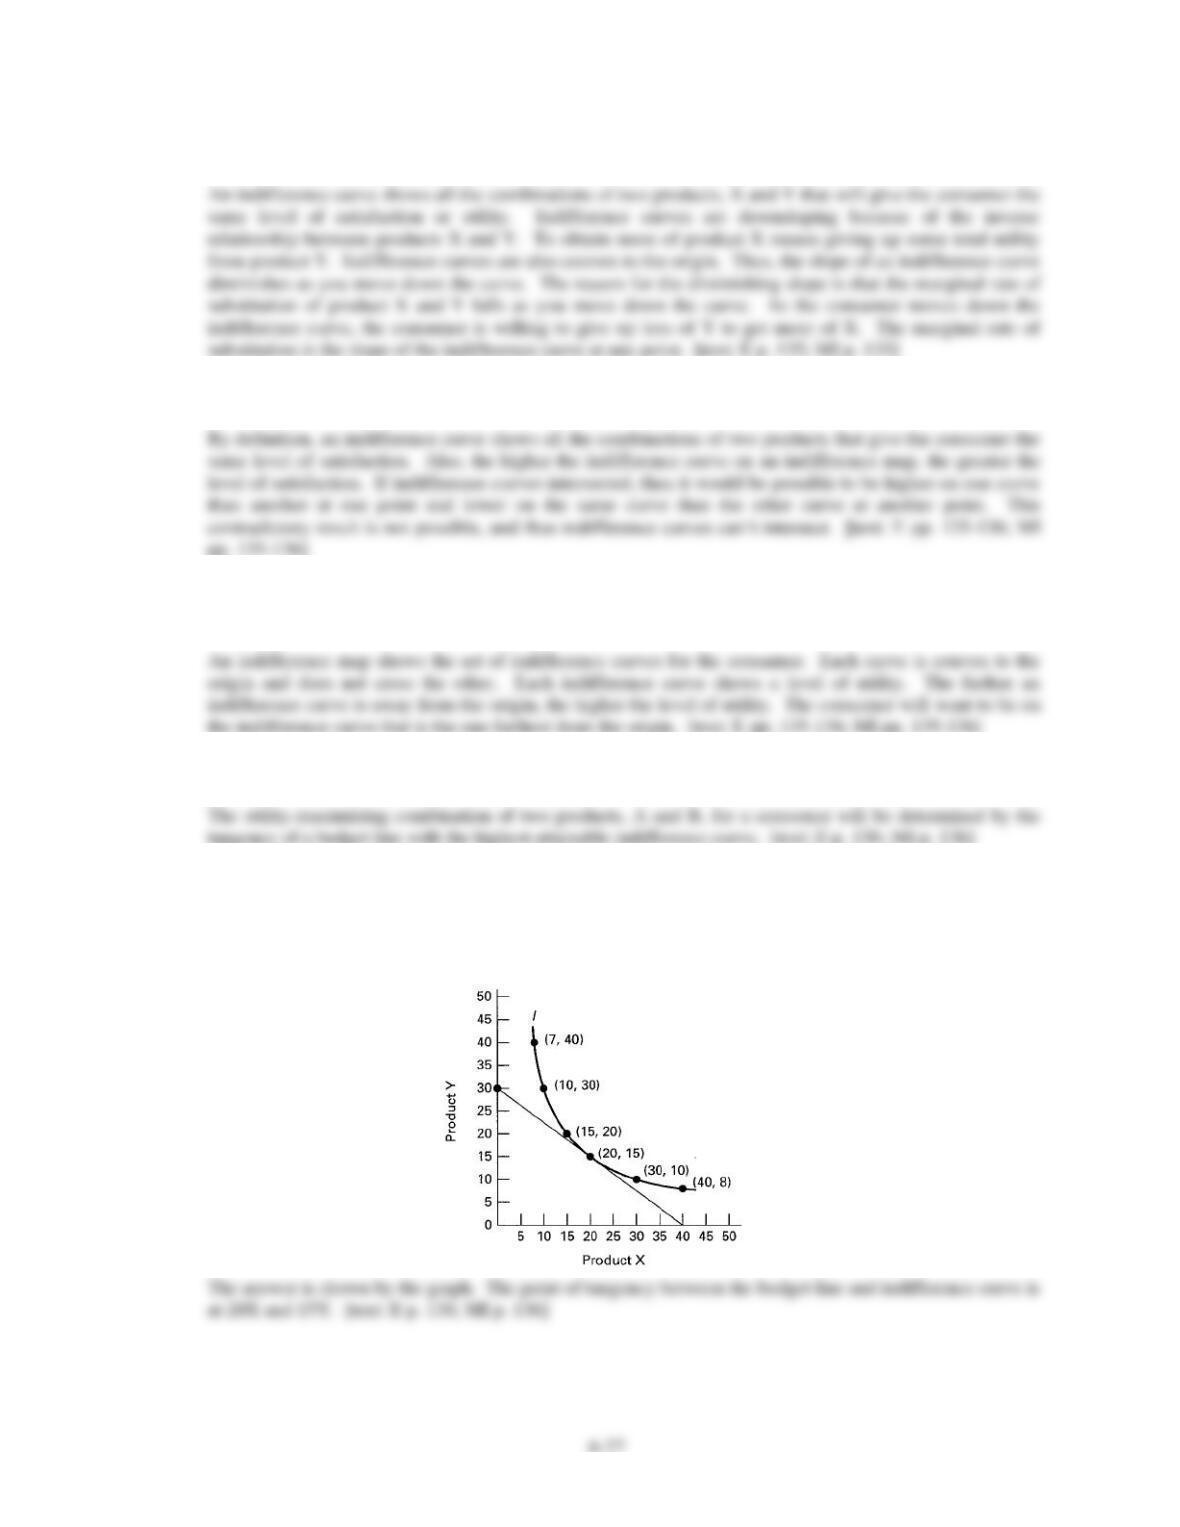
51. A consumer has a daily income of $120 and purchases two products, X and Y. The price of X is $3 and the
price of Y is $4. The following six pairs of points for X and Y define an indifference schedule: (7,40),
(10,30), (15,20), (20,15), (30,10), and (40,8). In the graph below, draw the budget line and the indifference
curve. What amounts of X and Y will allow the consumer to achieve equilibrium?
Chapter 06 – Consumer Behavior (+ Appendix)
6-28
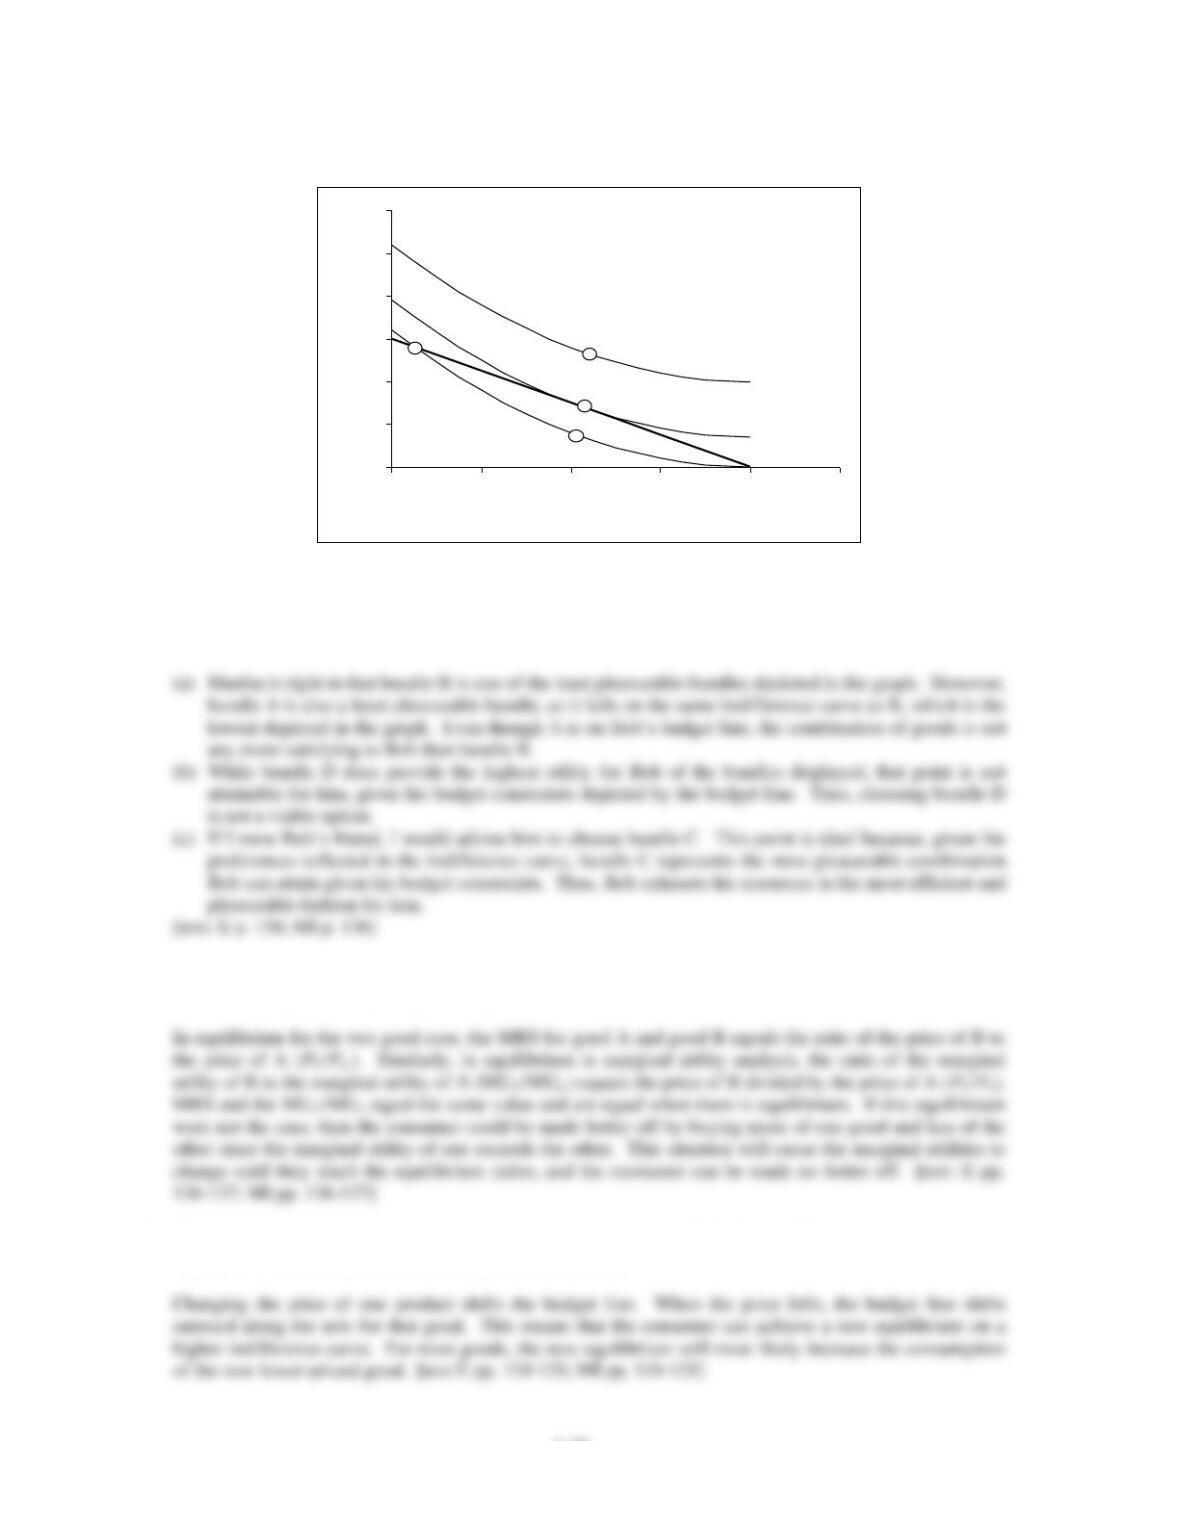
52. The graph below depicts a Bob’s budget line for 2 goods and three indifference curves depicting his
preferences. Use this graph to answer the following questions.
(a) Bob’s friend Martha argues that B represents the least pleasurable bundle for Bob. Do you agree?
(b) Bob’s friend Michael argues that Bob should choose to consume bundle D since it offers him the
highest utility. Do you agree?
(c) If you were a friend of Bob’s, which bundle would you advise him to take?
53. When does the marginal rate of substitution (MRS) in an indifference curve equal the ratio of marginal
utilities in marginal-utility analysis? Explain.
54. What happens to the budget line when the price of a product falls? Use indifference curve analysis to
explain how this change affects consumption of the product.
0
10
20
30
40
50
60
010 20 30 40 50
Quantity of A
Quantity of B
B
A
C
D
Chapter 06 – Consumer Behavior (+ Appendix)
55. (Consider This) How is an indifference map like a topographic map?
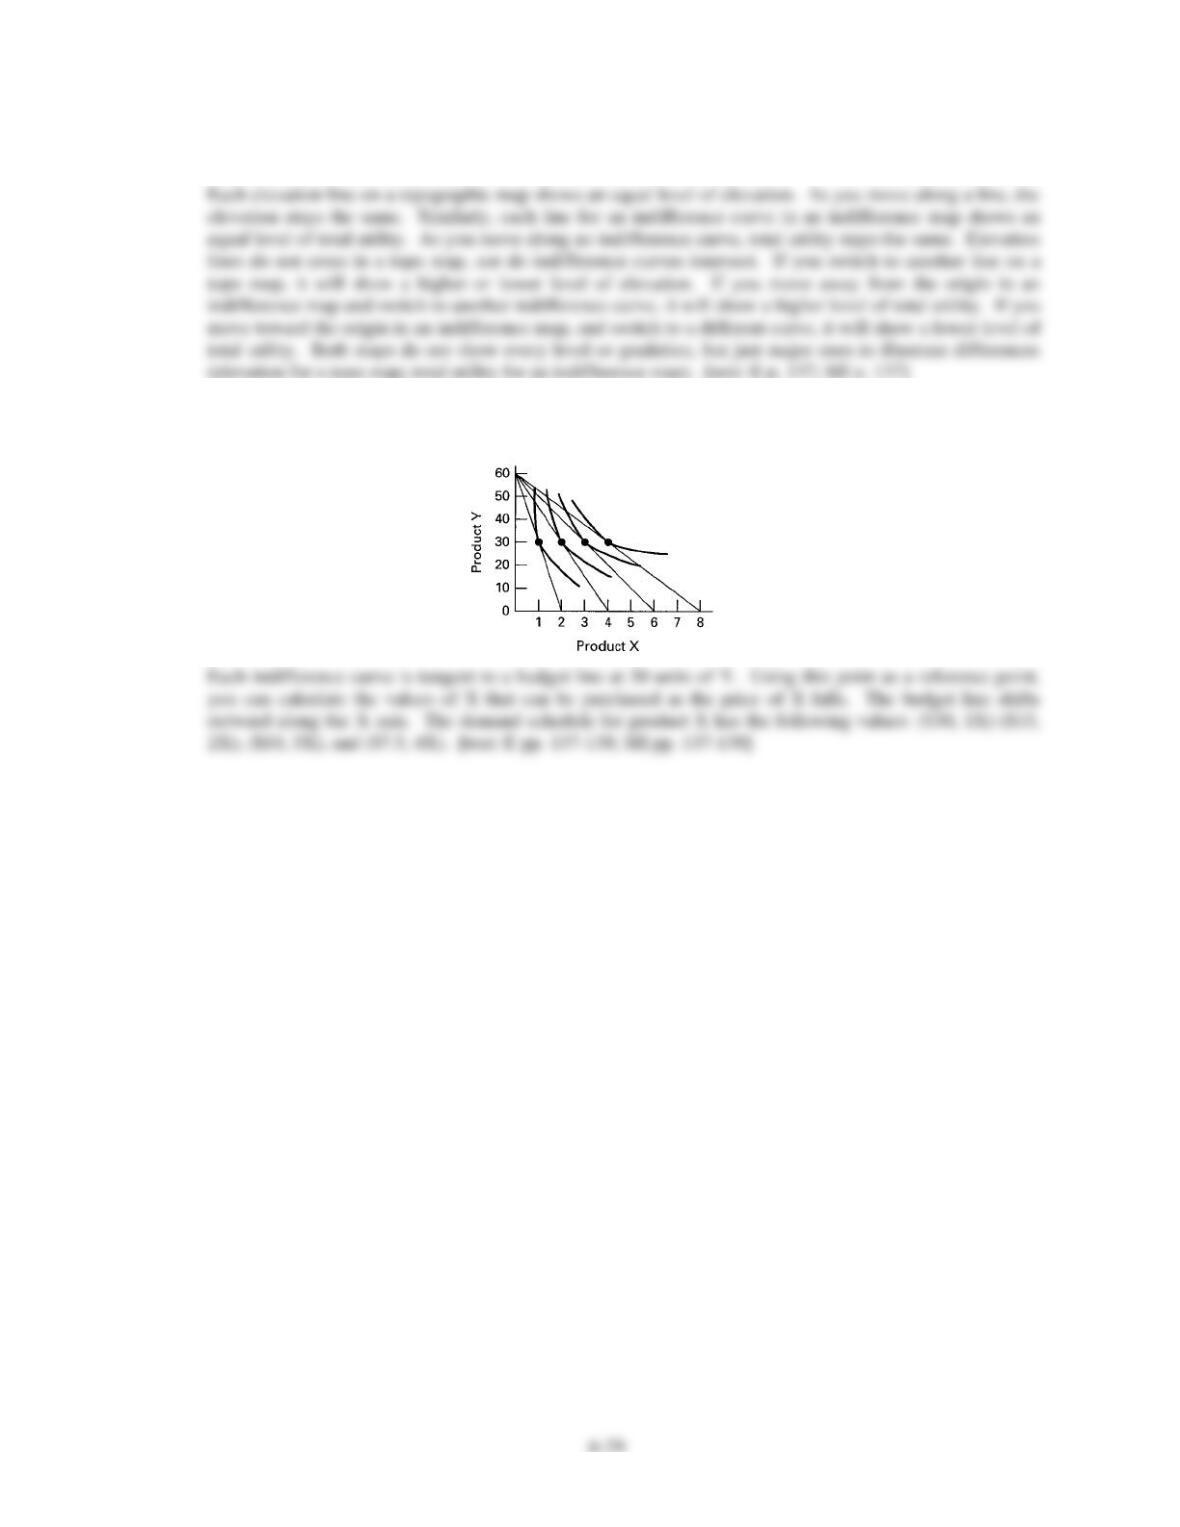
56. Using the below indifference curve graph, determine the demand curve for product X across four different
prices when the income is $60 and price of Y is $1.