6-21
52. A prominent argument against the use of price ceilings is:
53. An unintended consequence of price ceilings is:
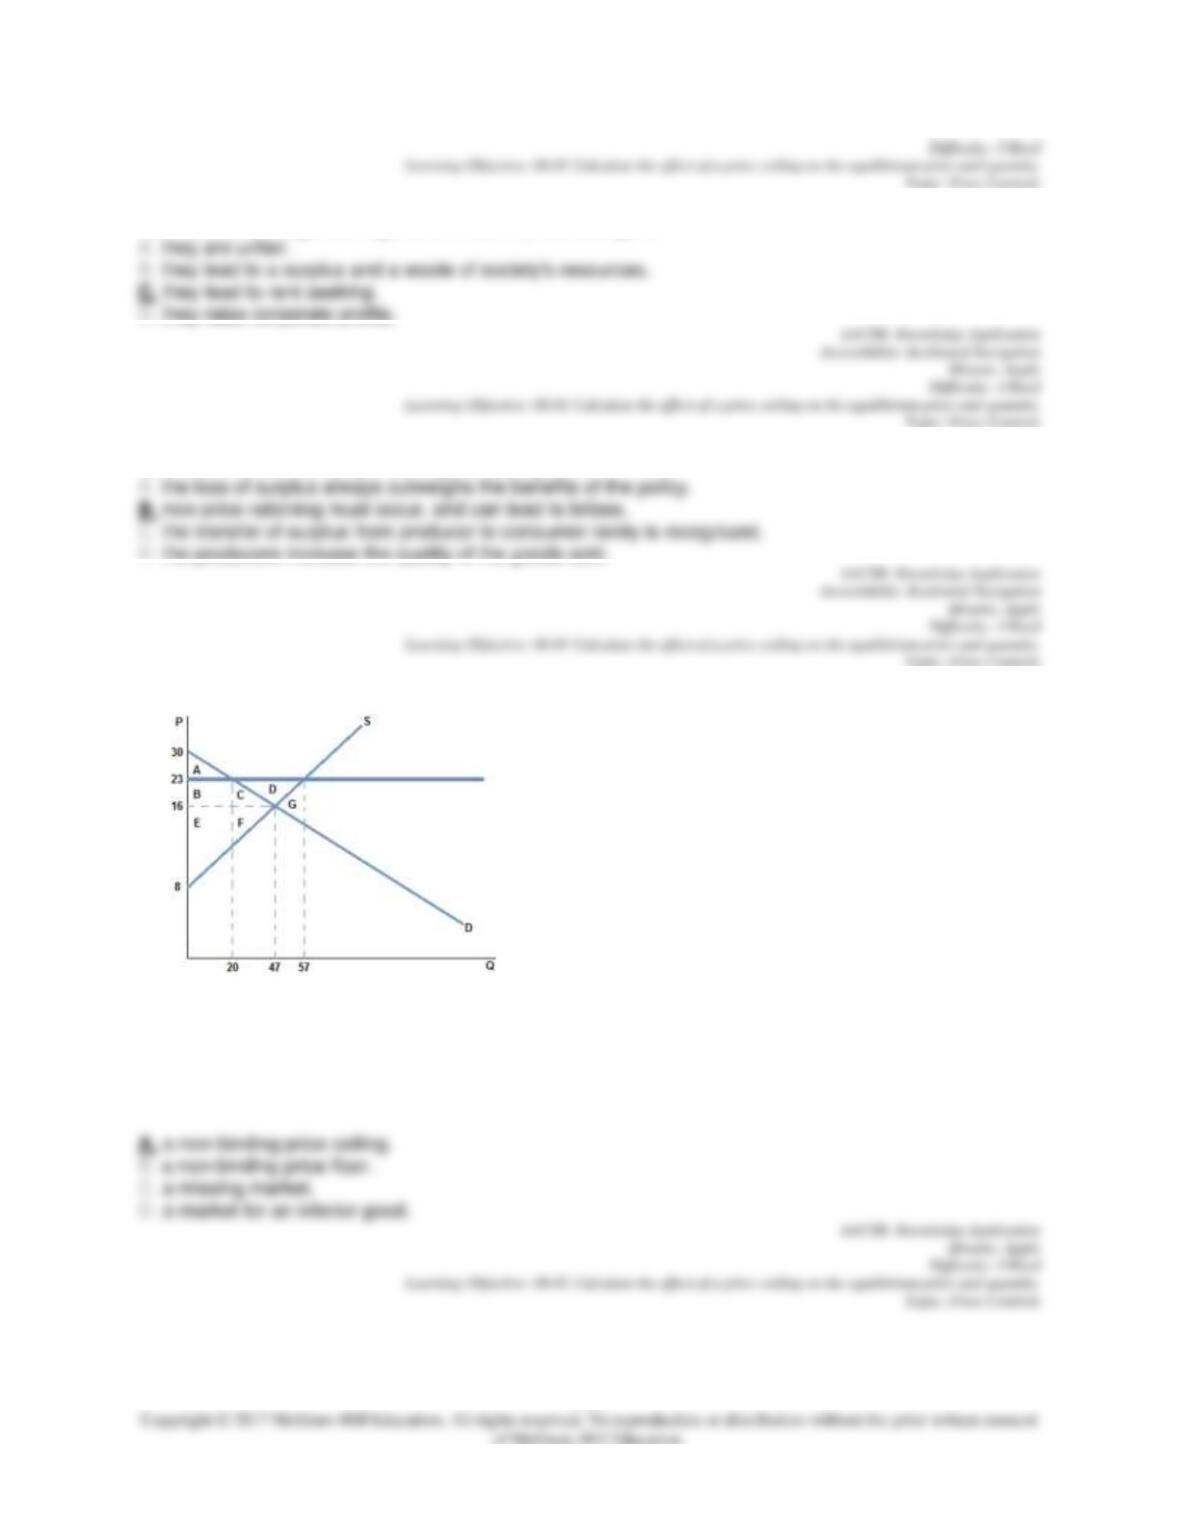
54.
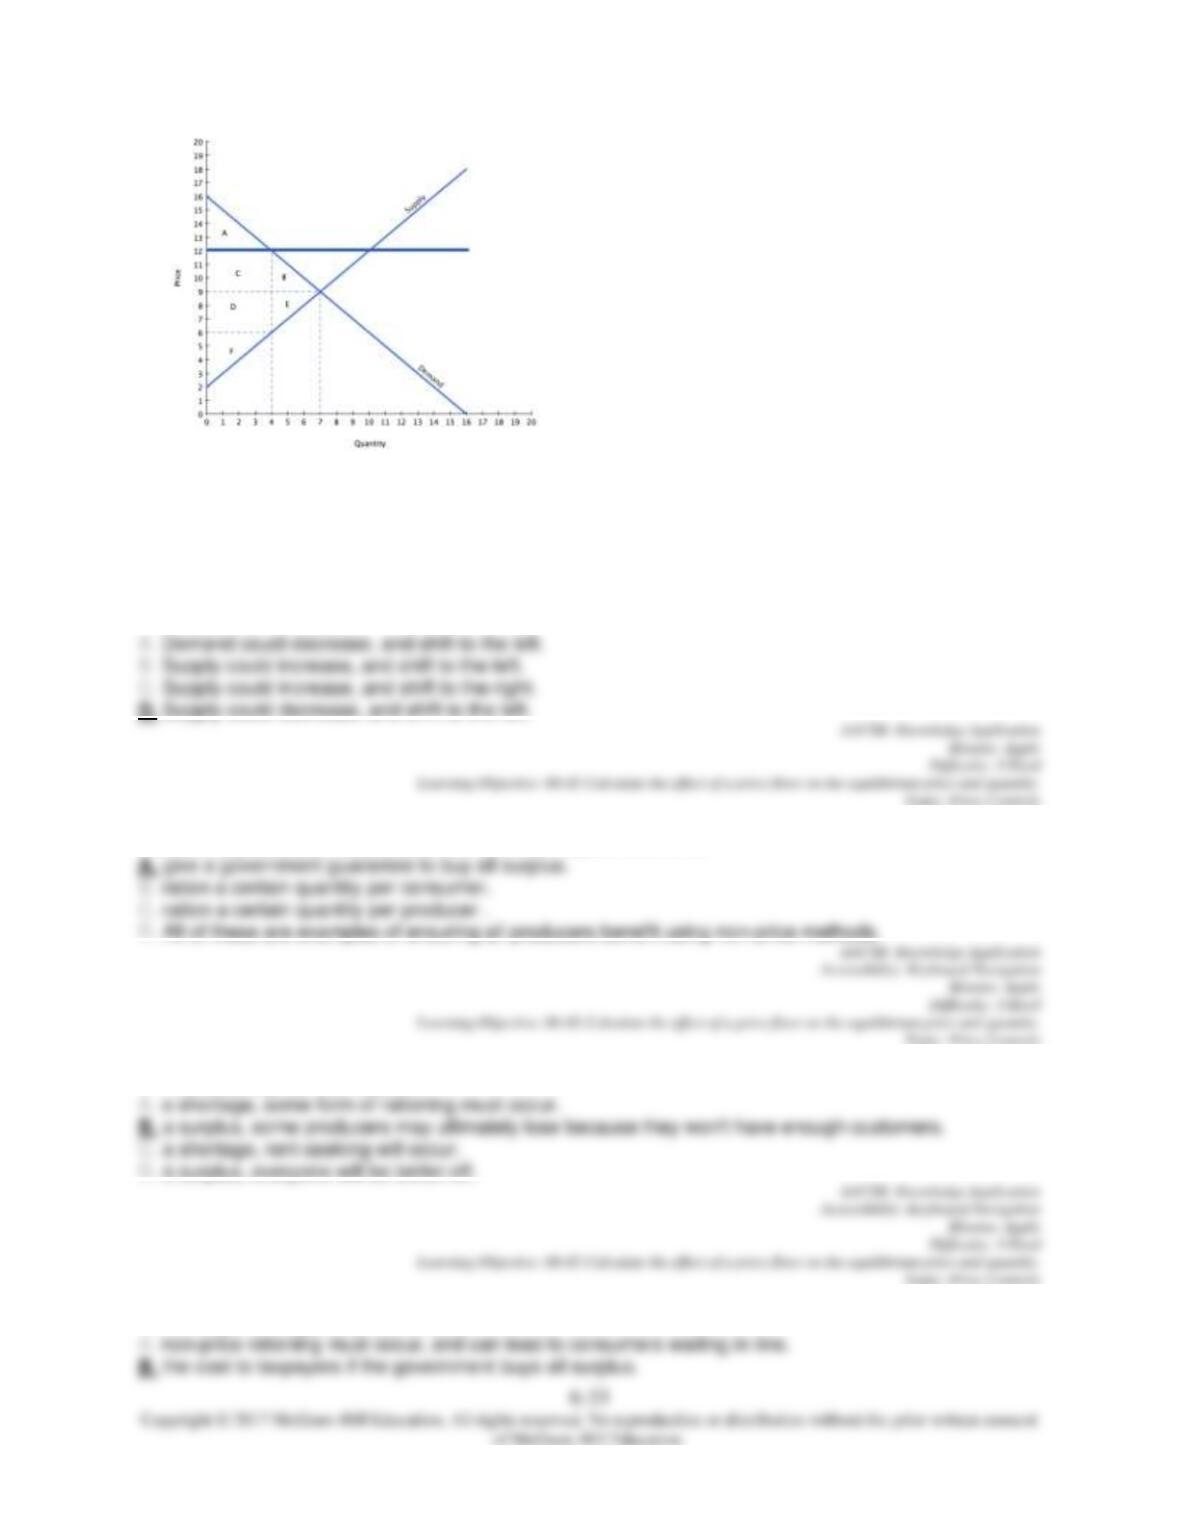
The graph shown best represents:
6-22
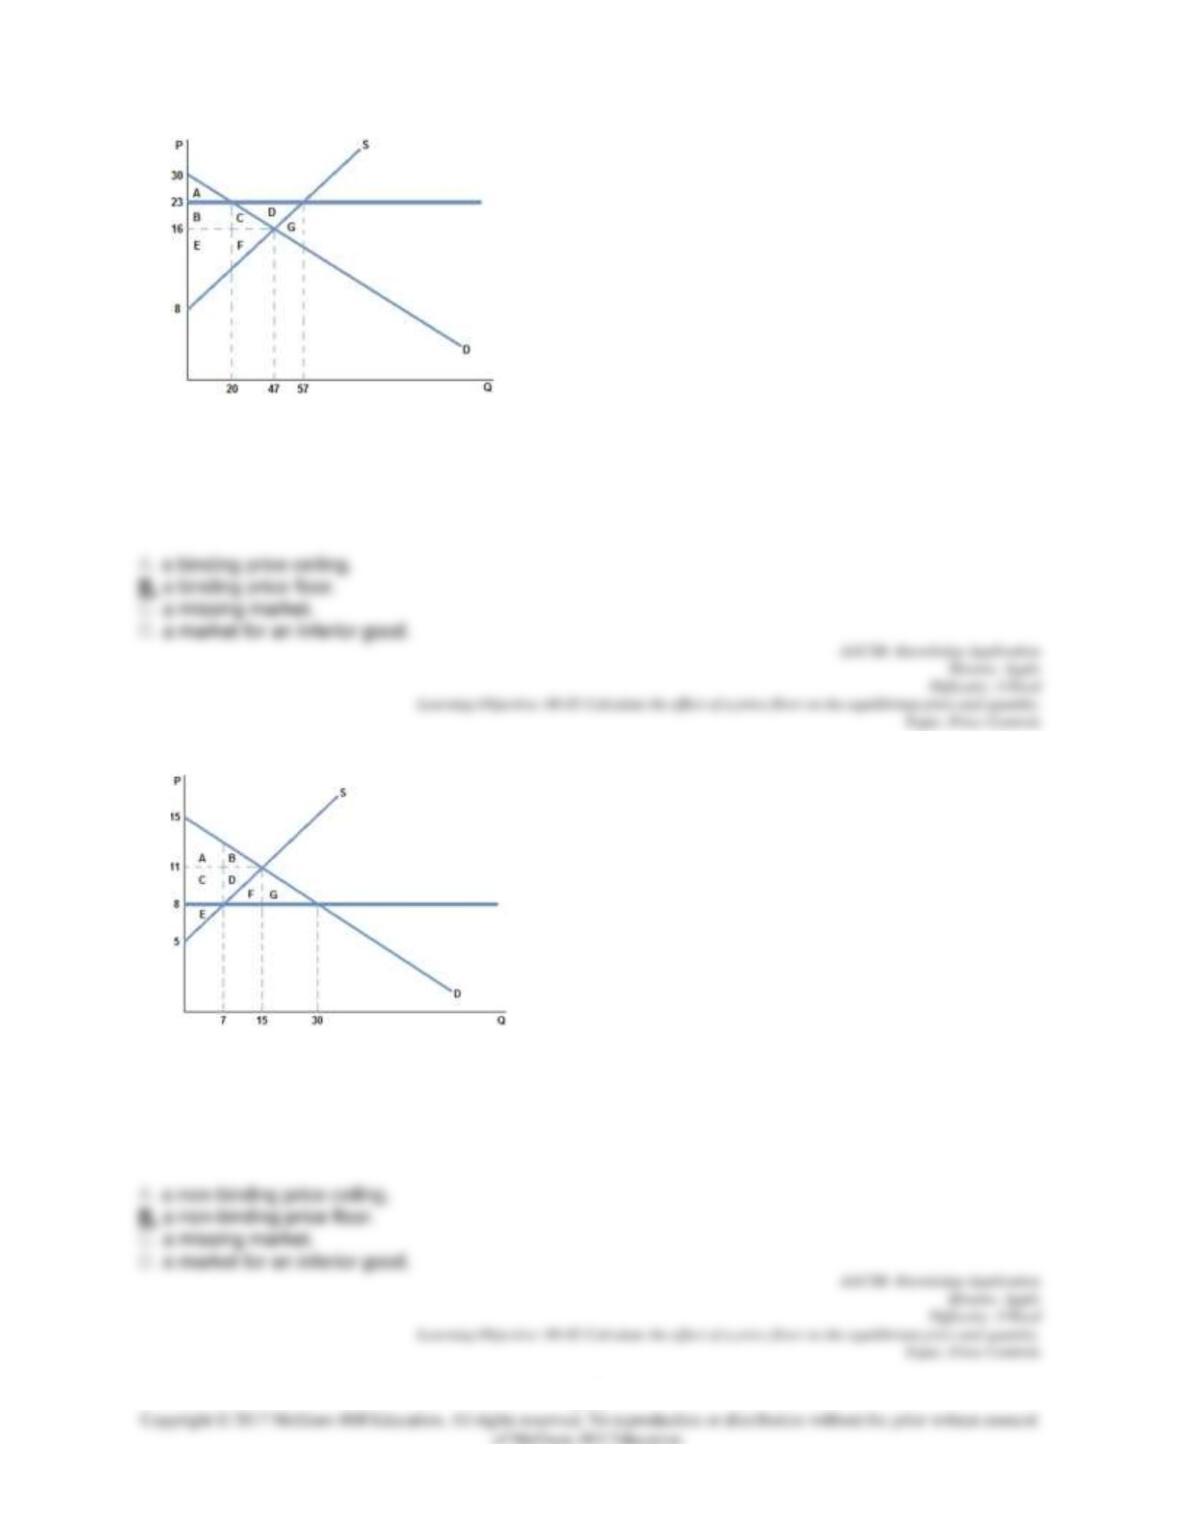
55.
The graph shown best represents:
56.
The graph shown best represents:
57.
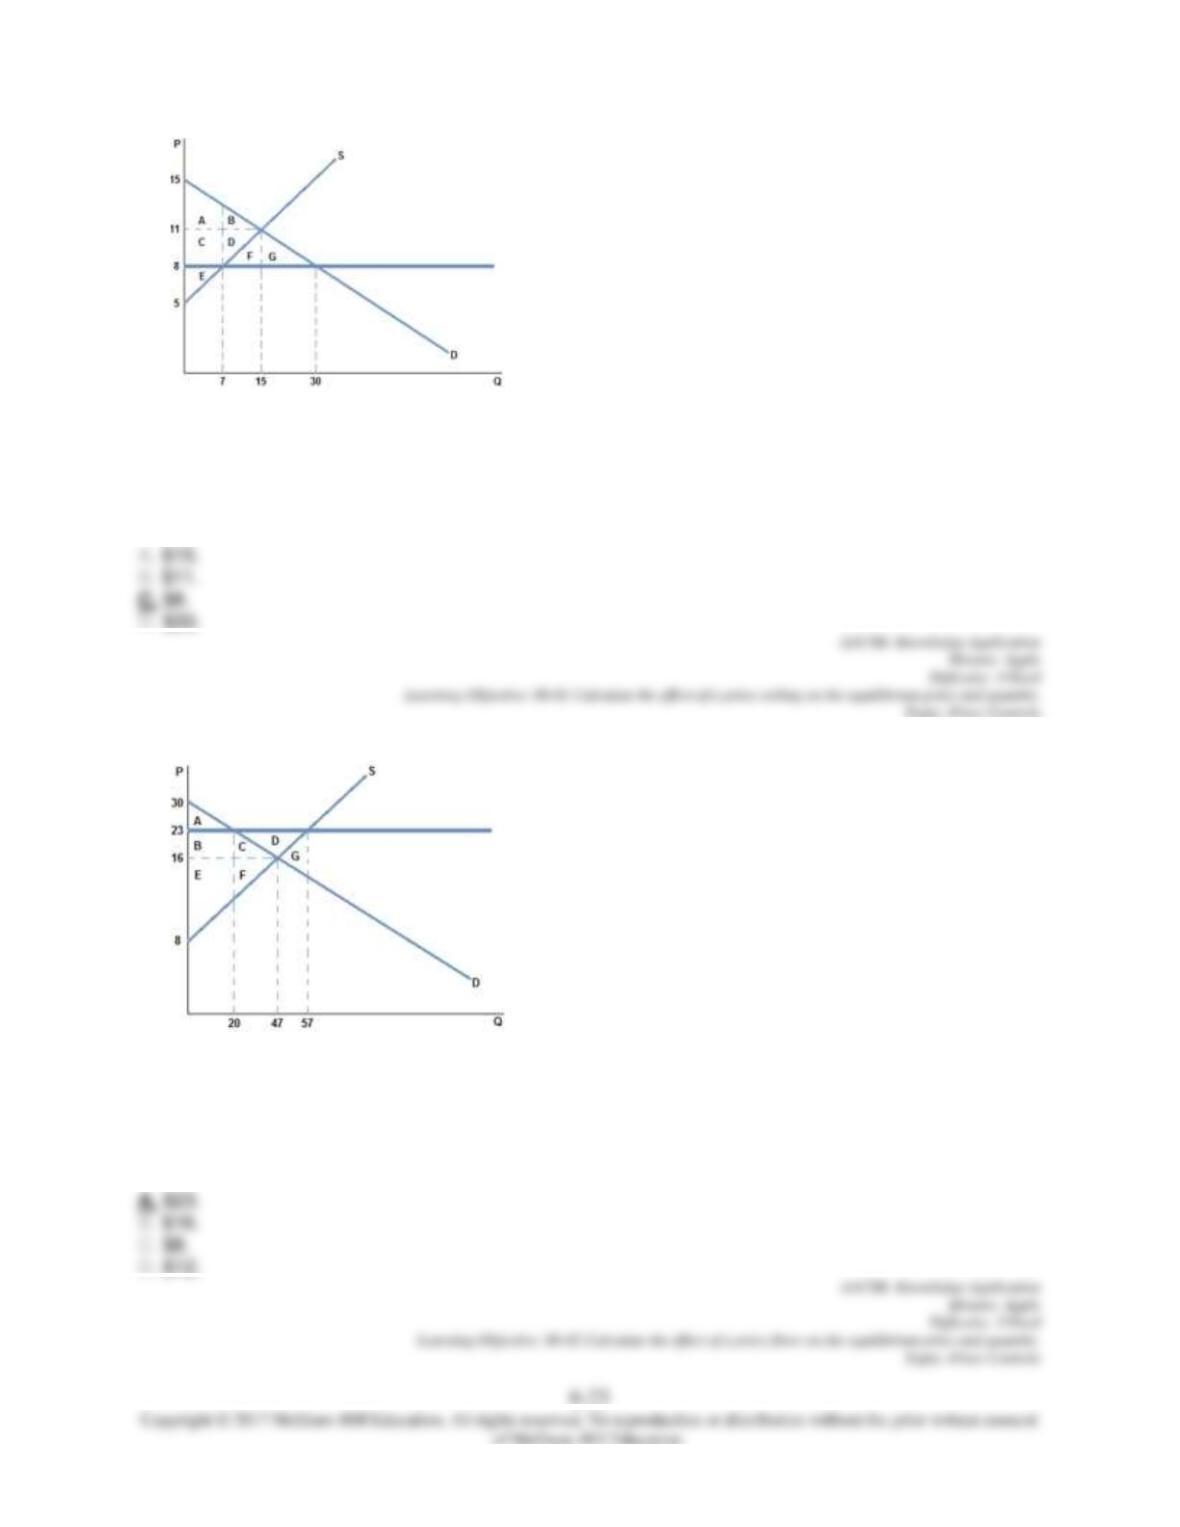
A binding price ceiling that could be set in the market in the graph shown would be:
58.
A binding price floor that could be set in the market in the graph shown would be:
59.
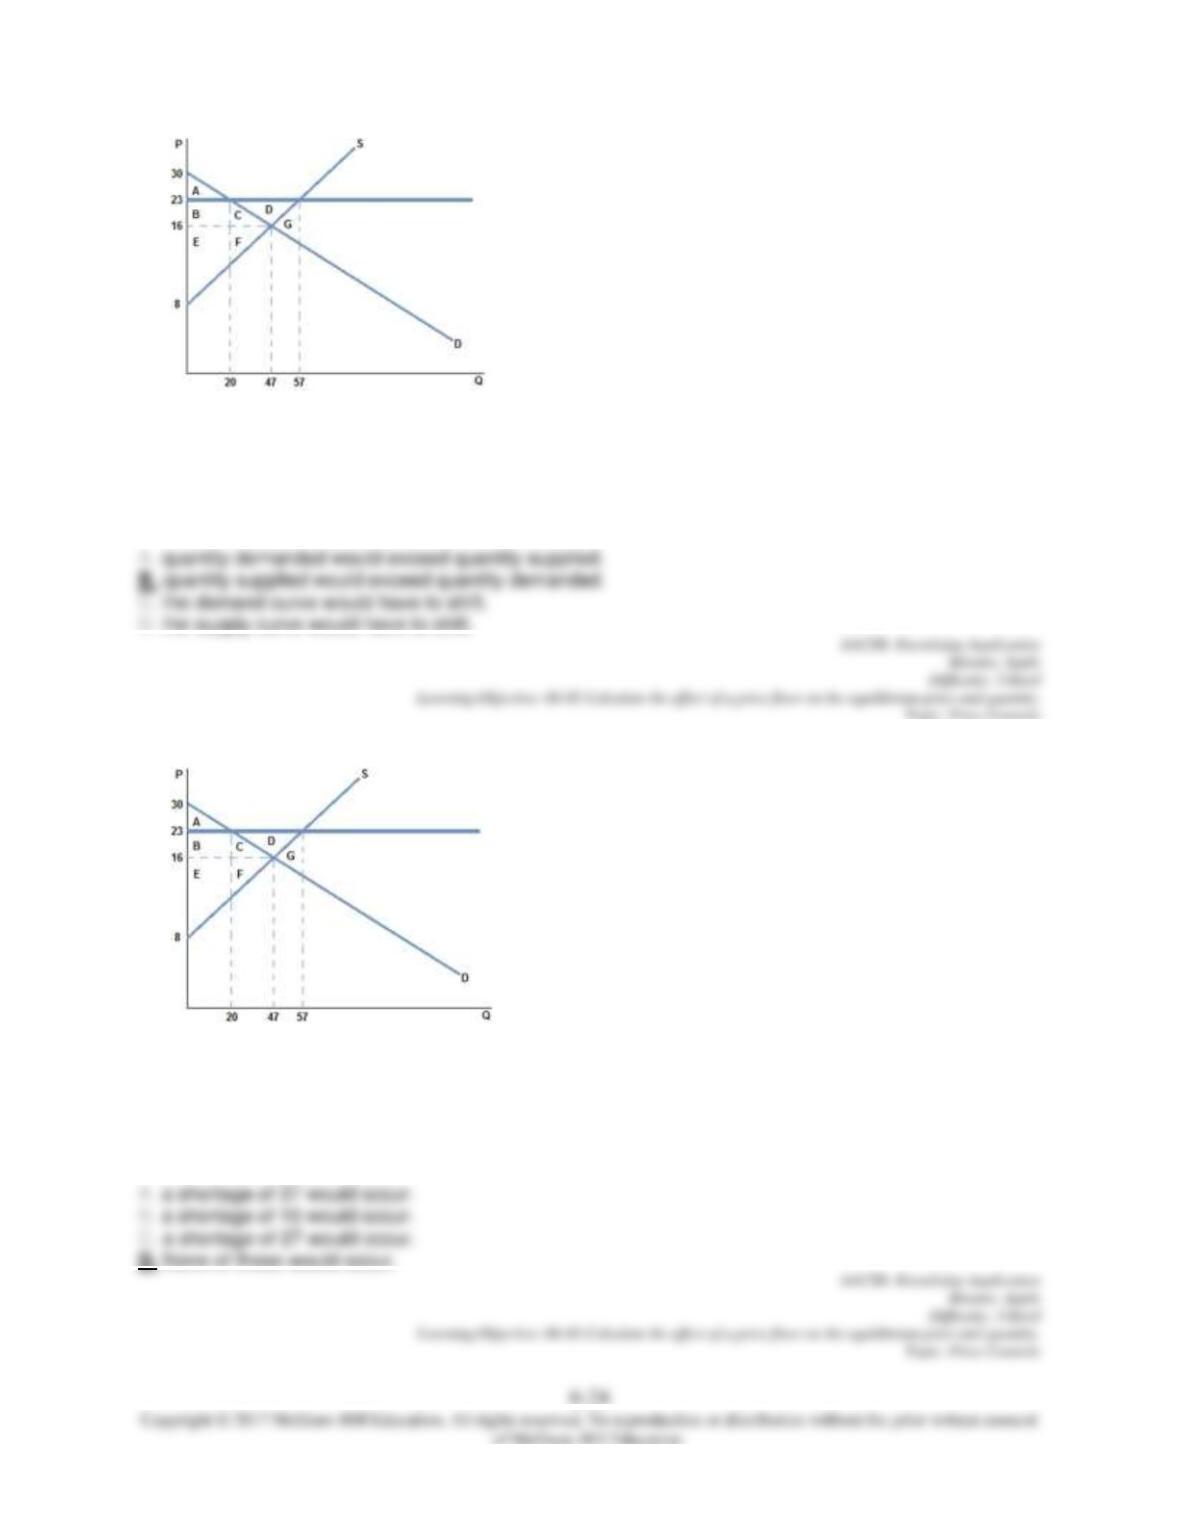
If a binding price floor were placed in the market in the graph shown:
60.
If a price floor of $23 were placed in the market in the graph shown:
61.
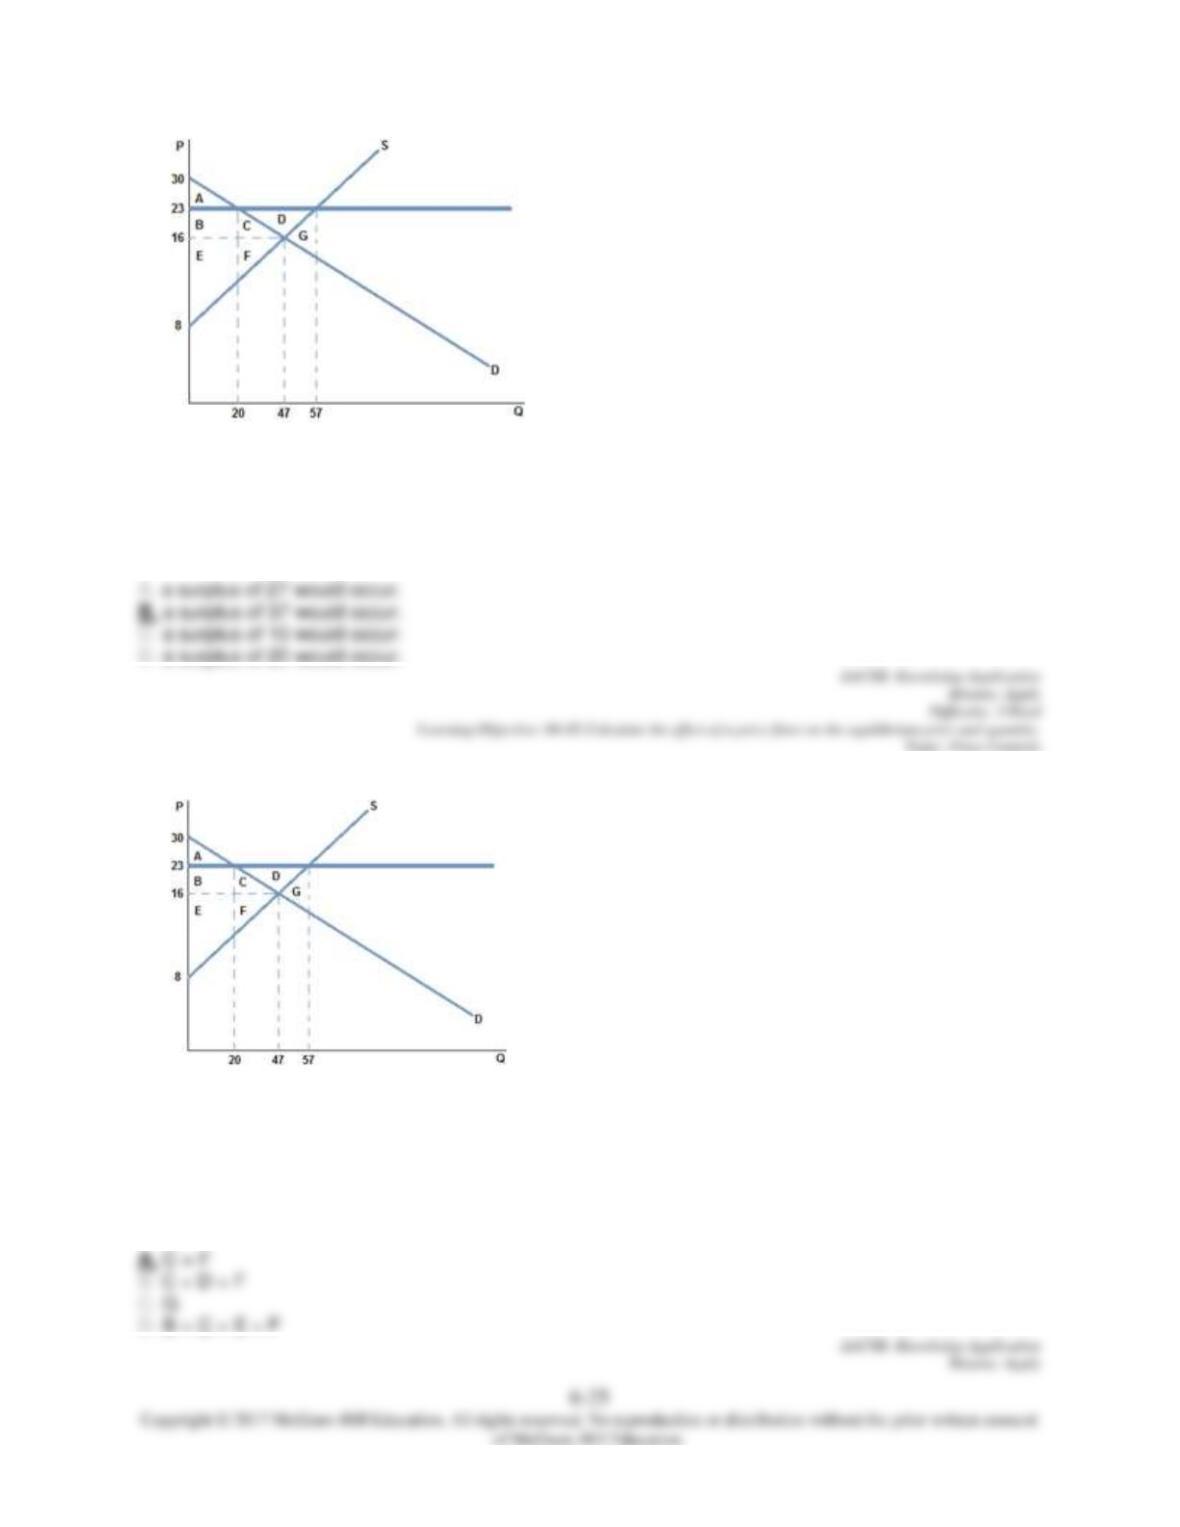
If a price floor of $23 were placed in the market in the graph shown:
62.
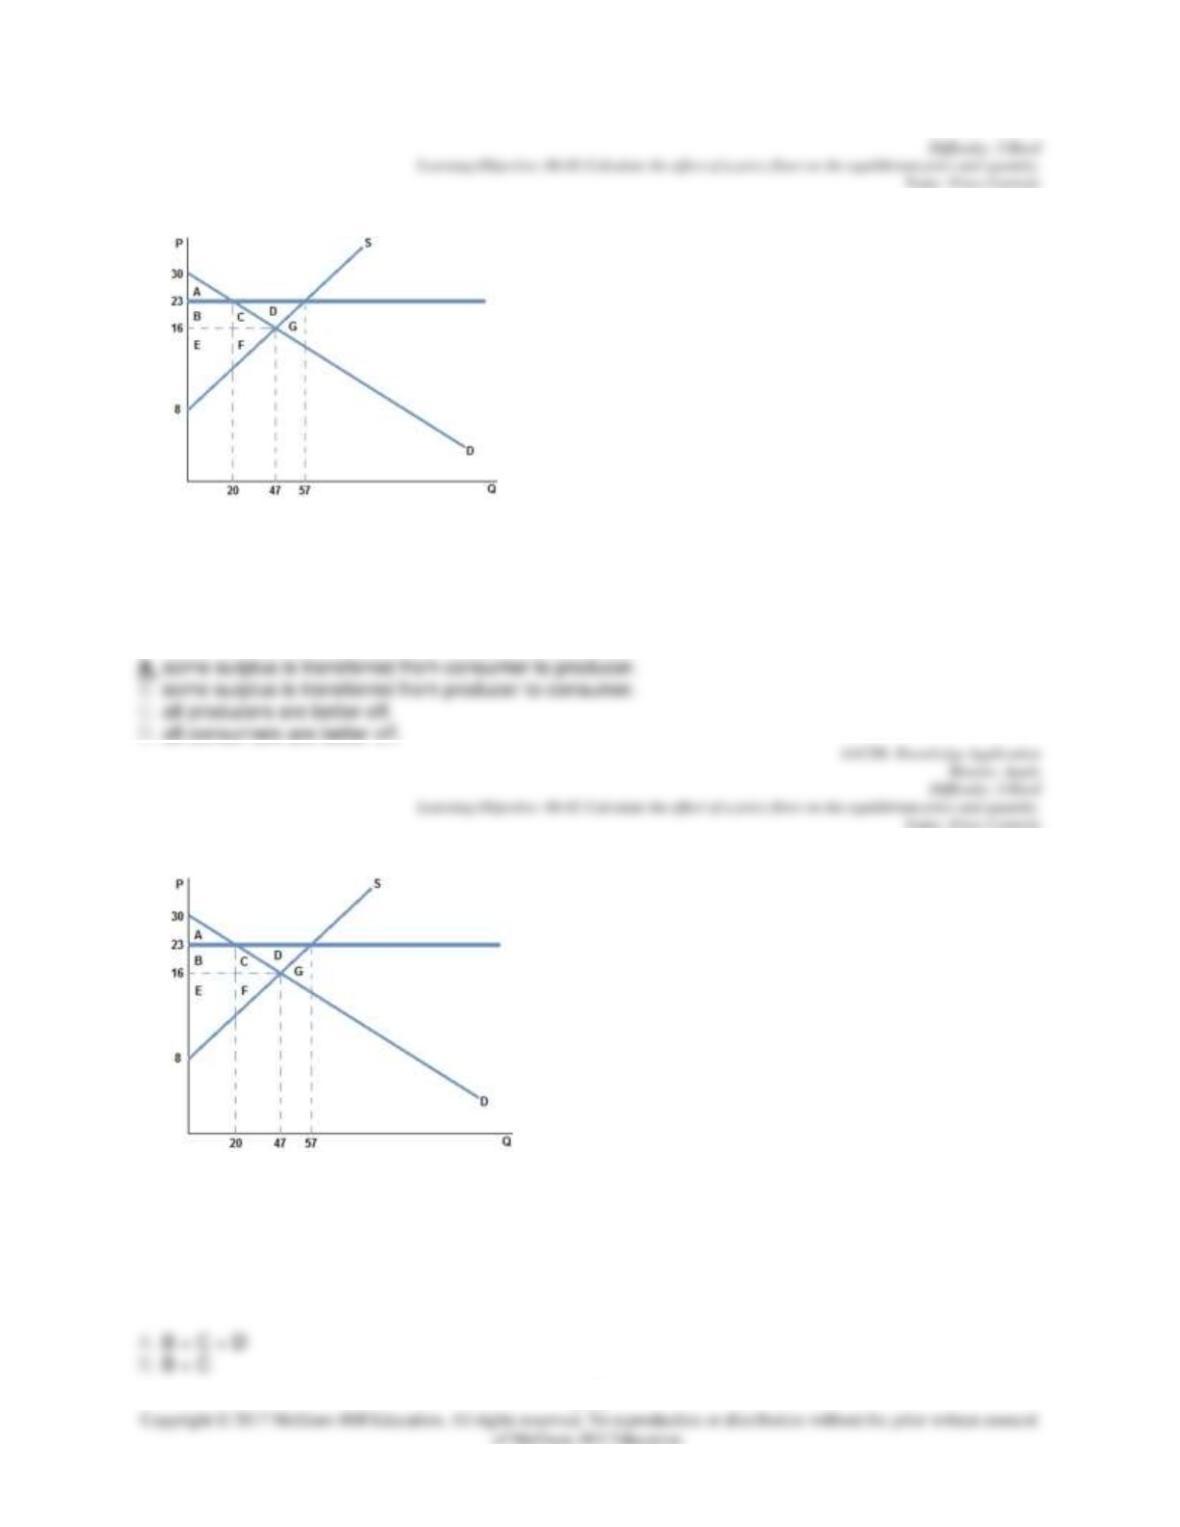
If a price floor of $23 were placed in the market in the graph shown, which area represents deadweight
loss?
6-26
63.
If a price floor of $23 were placed in the market in the graph shown:
64.
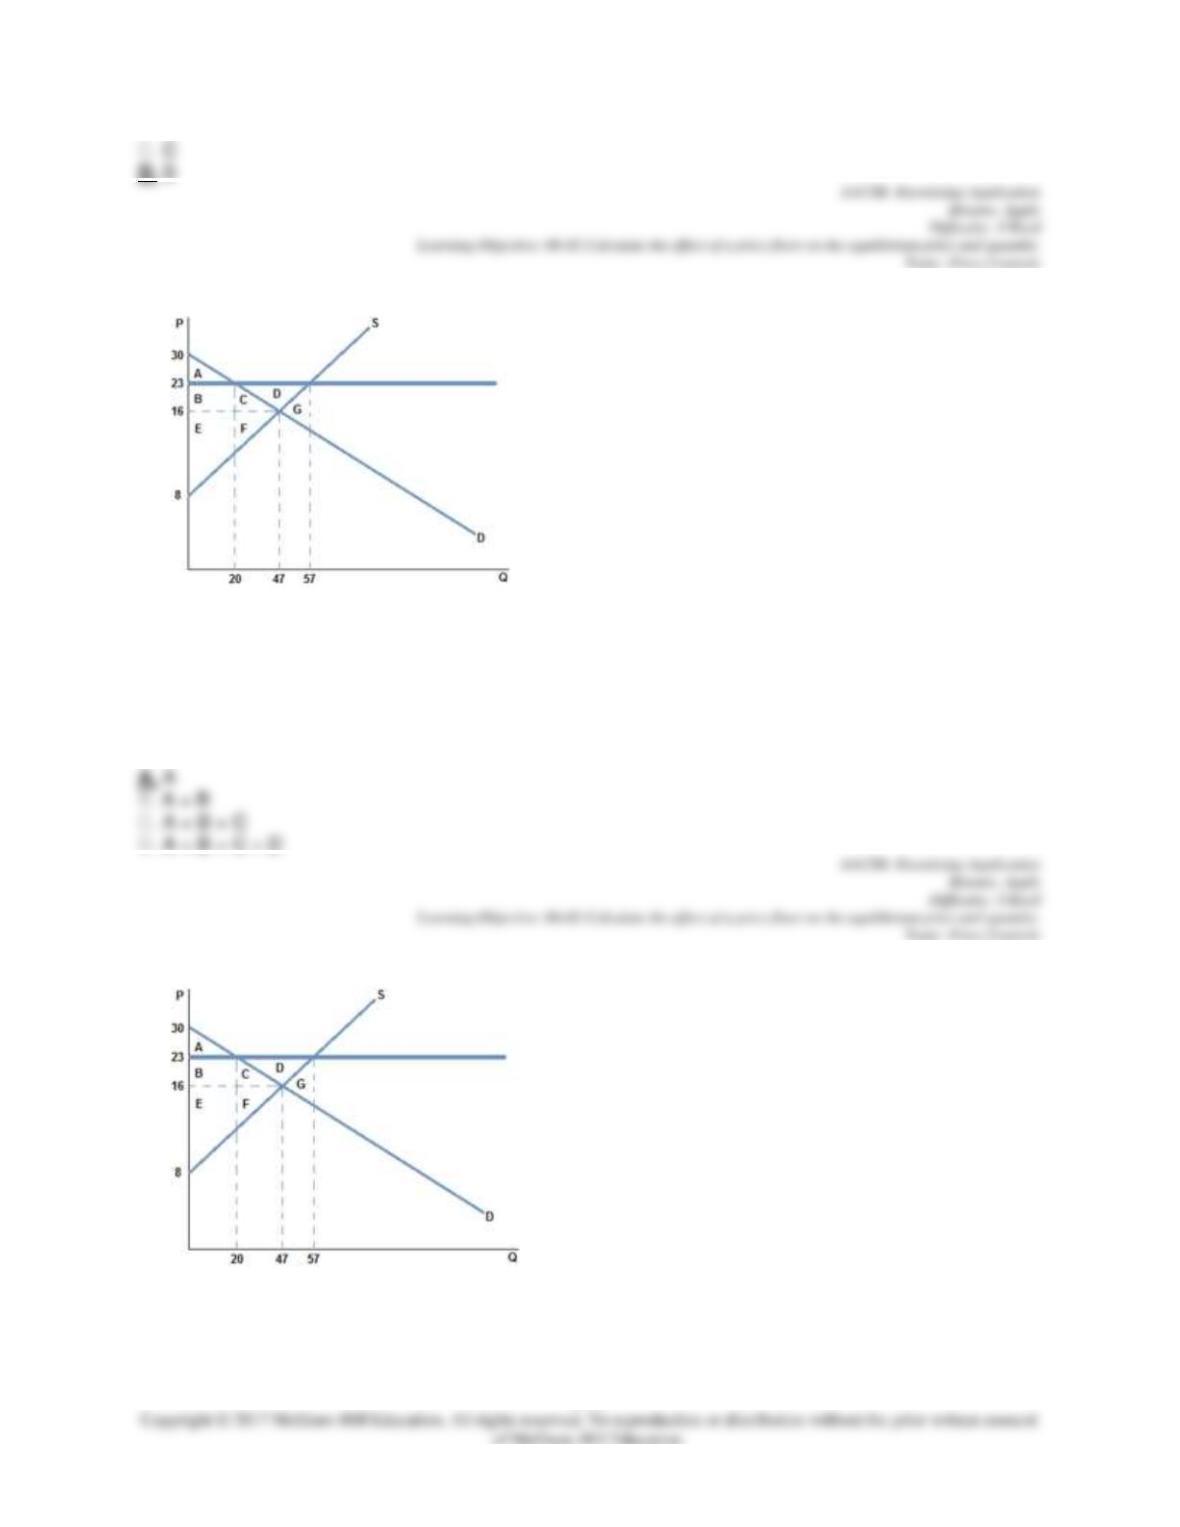
If a price floor of $23 were placed on the market in the graph shown, which area represents the surplus
that is transferred?
6-27
65.
After a price floor of $23 is placed on the market in the graph shown, which area represents consumer
surplus?
66.
6-28
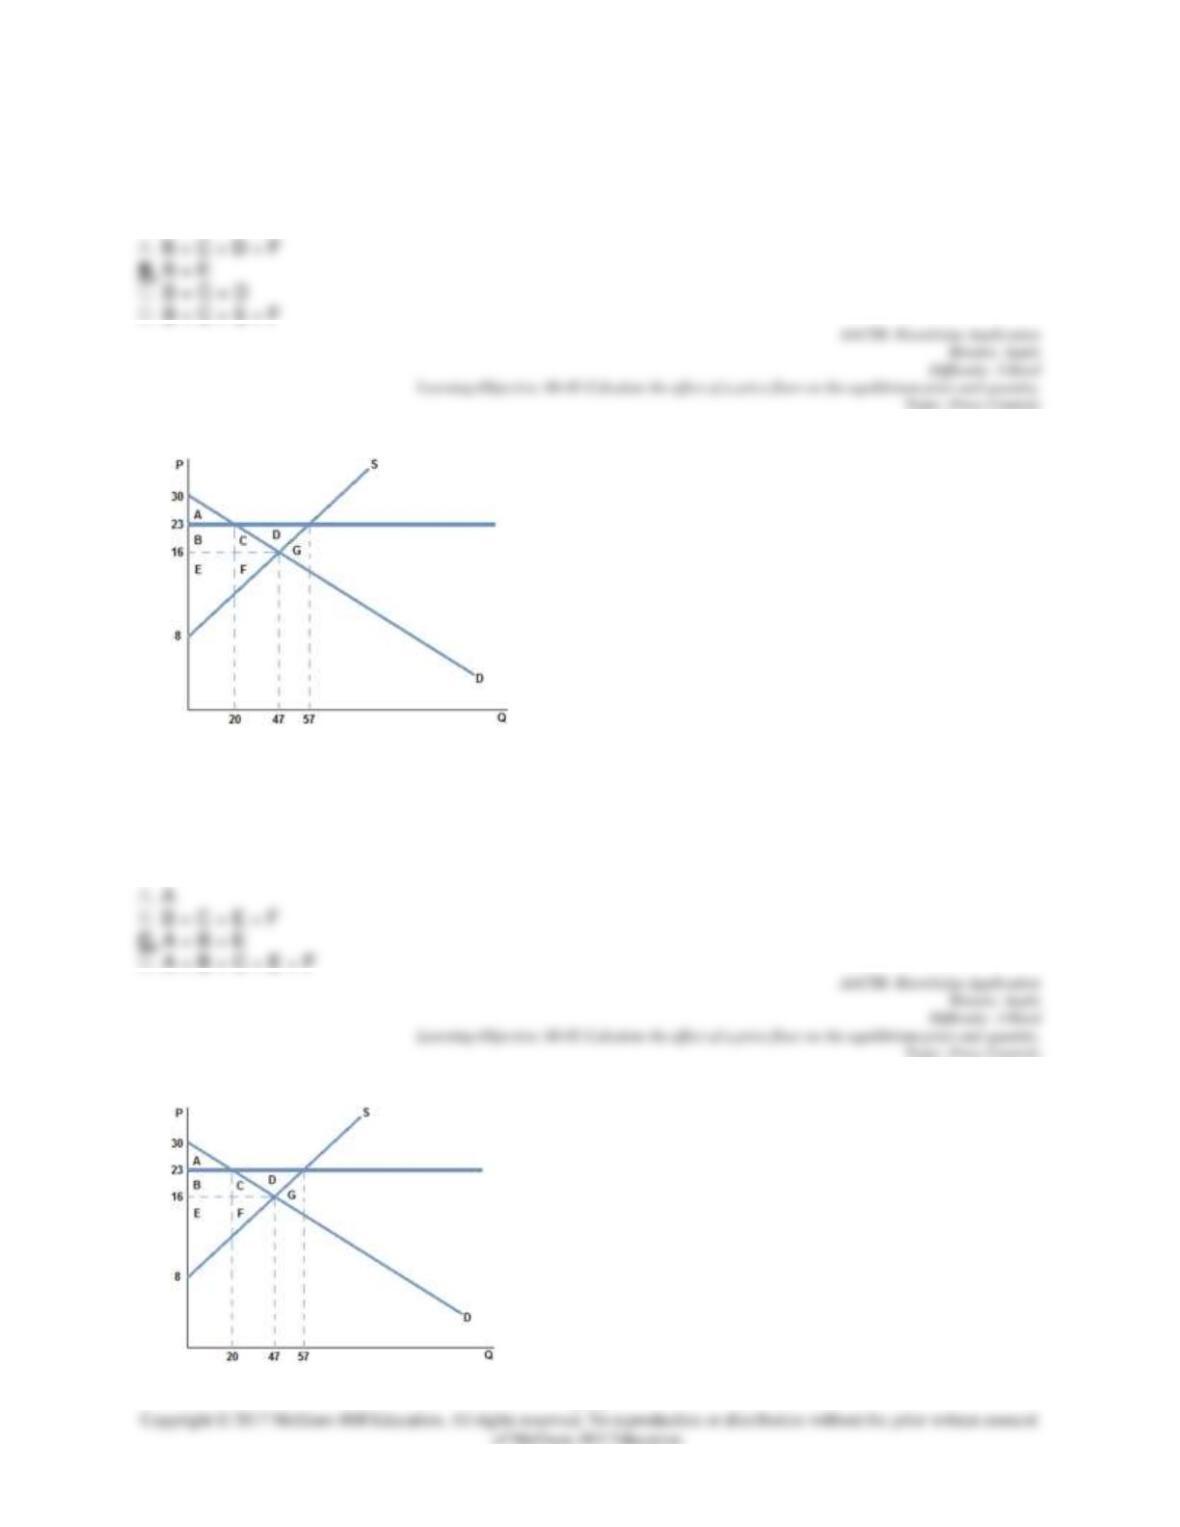
After a price floor of $23 is placed on the market in the graph shown, which area represents producer
surplus?
67.
After a price floor of $23 is placed on the market in the graph shown, which area represents total surplus?
68.
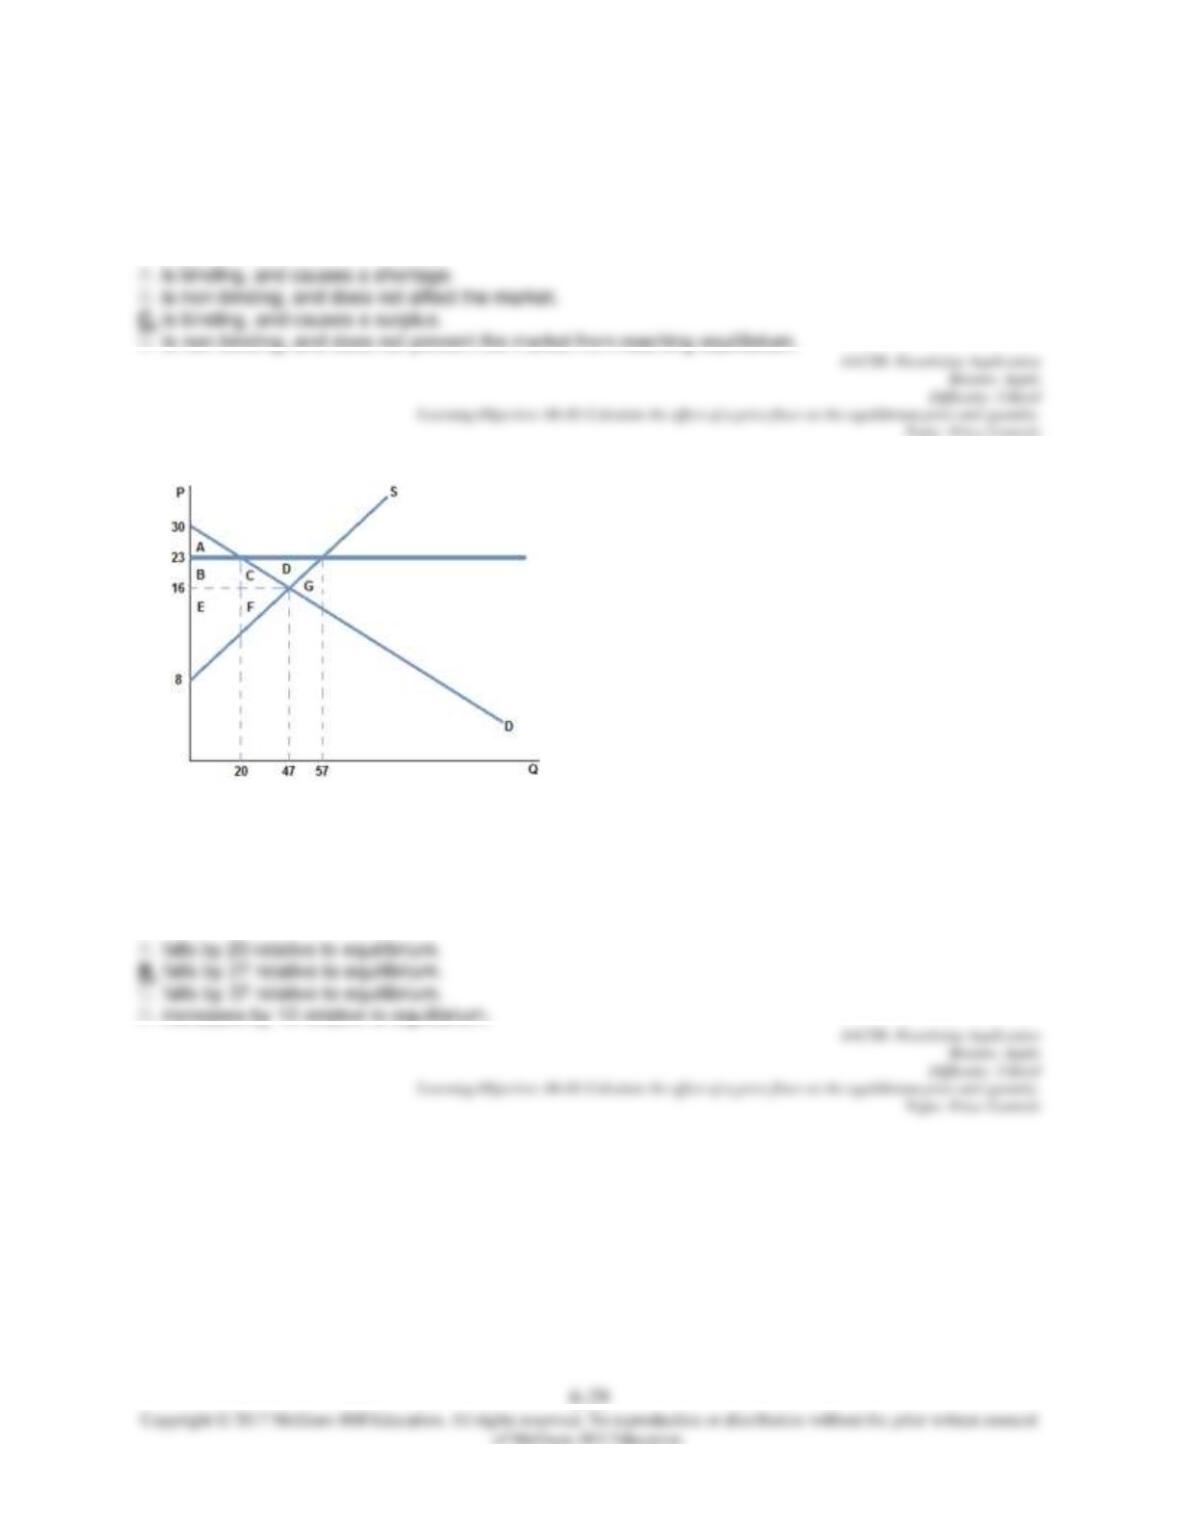
A price floor of $23 placed on the market in the graph shown:
69.
After a price floor of $23 is placed on the market in the graph shown, the total number of units traded:
70.
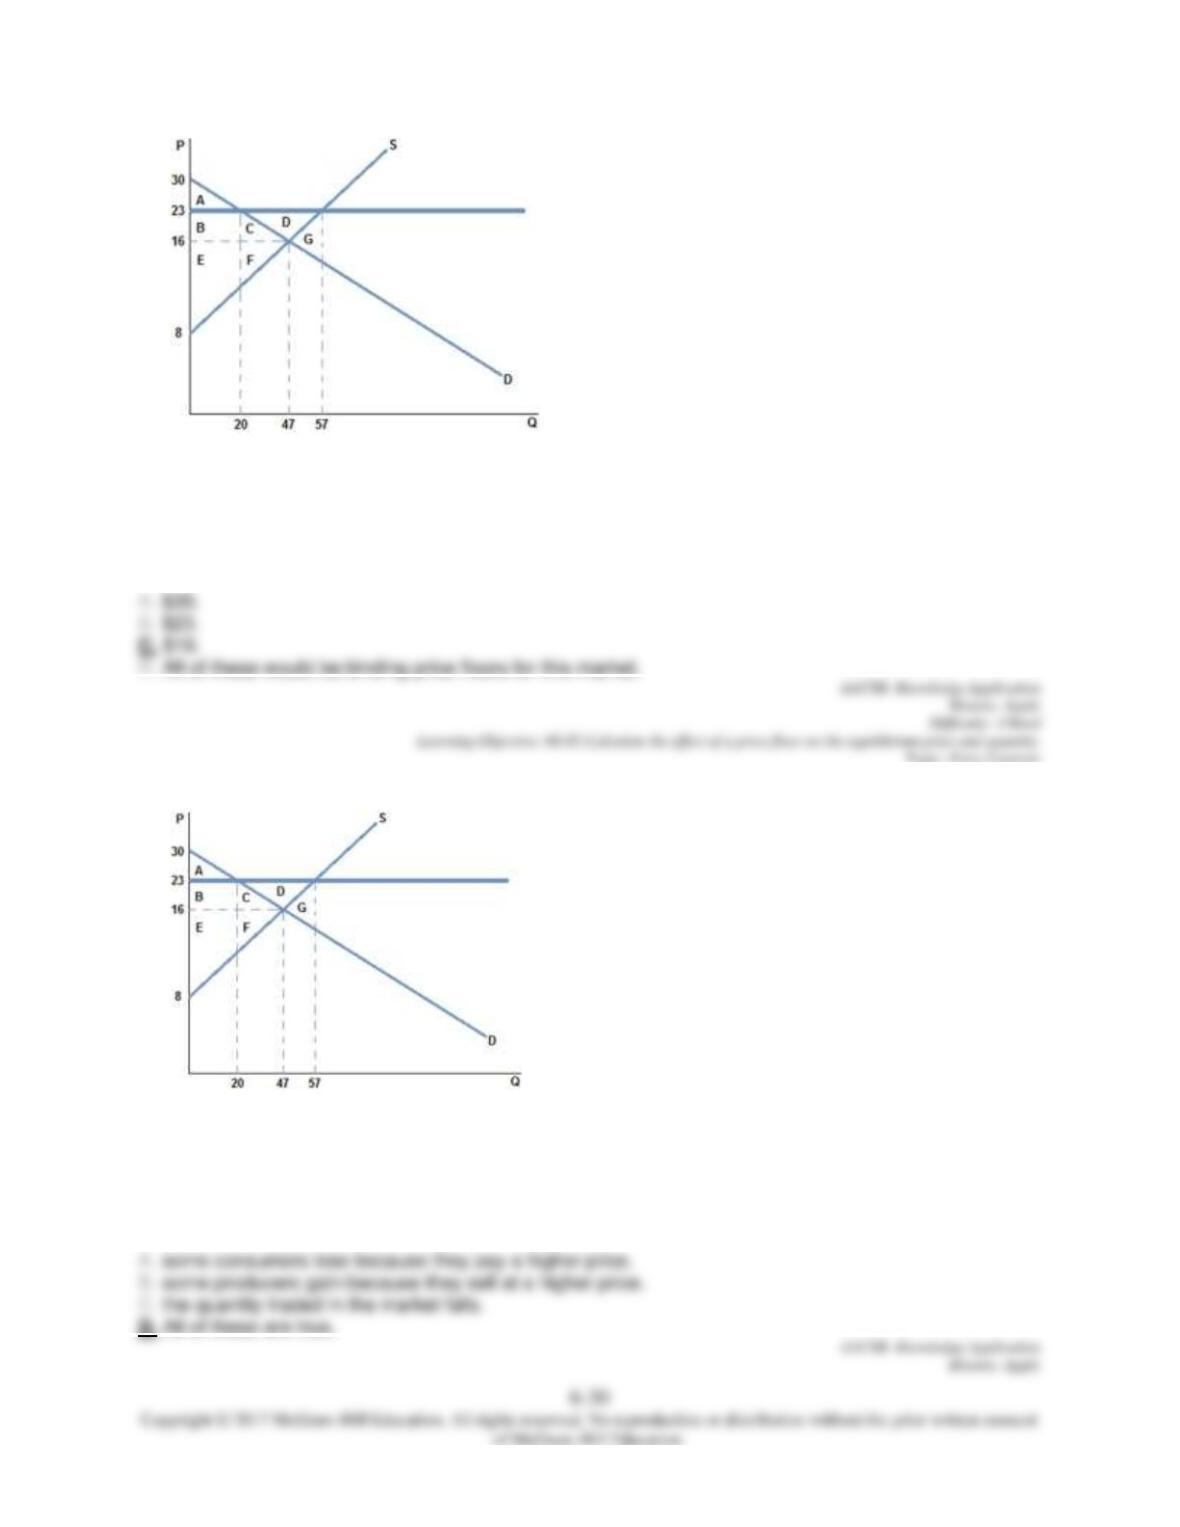
If a non-binding price floor were to be set in the market in the graph shown, it could be set at:
71.
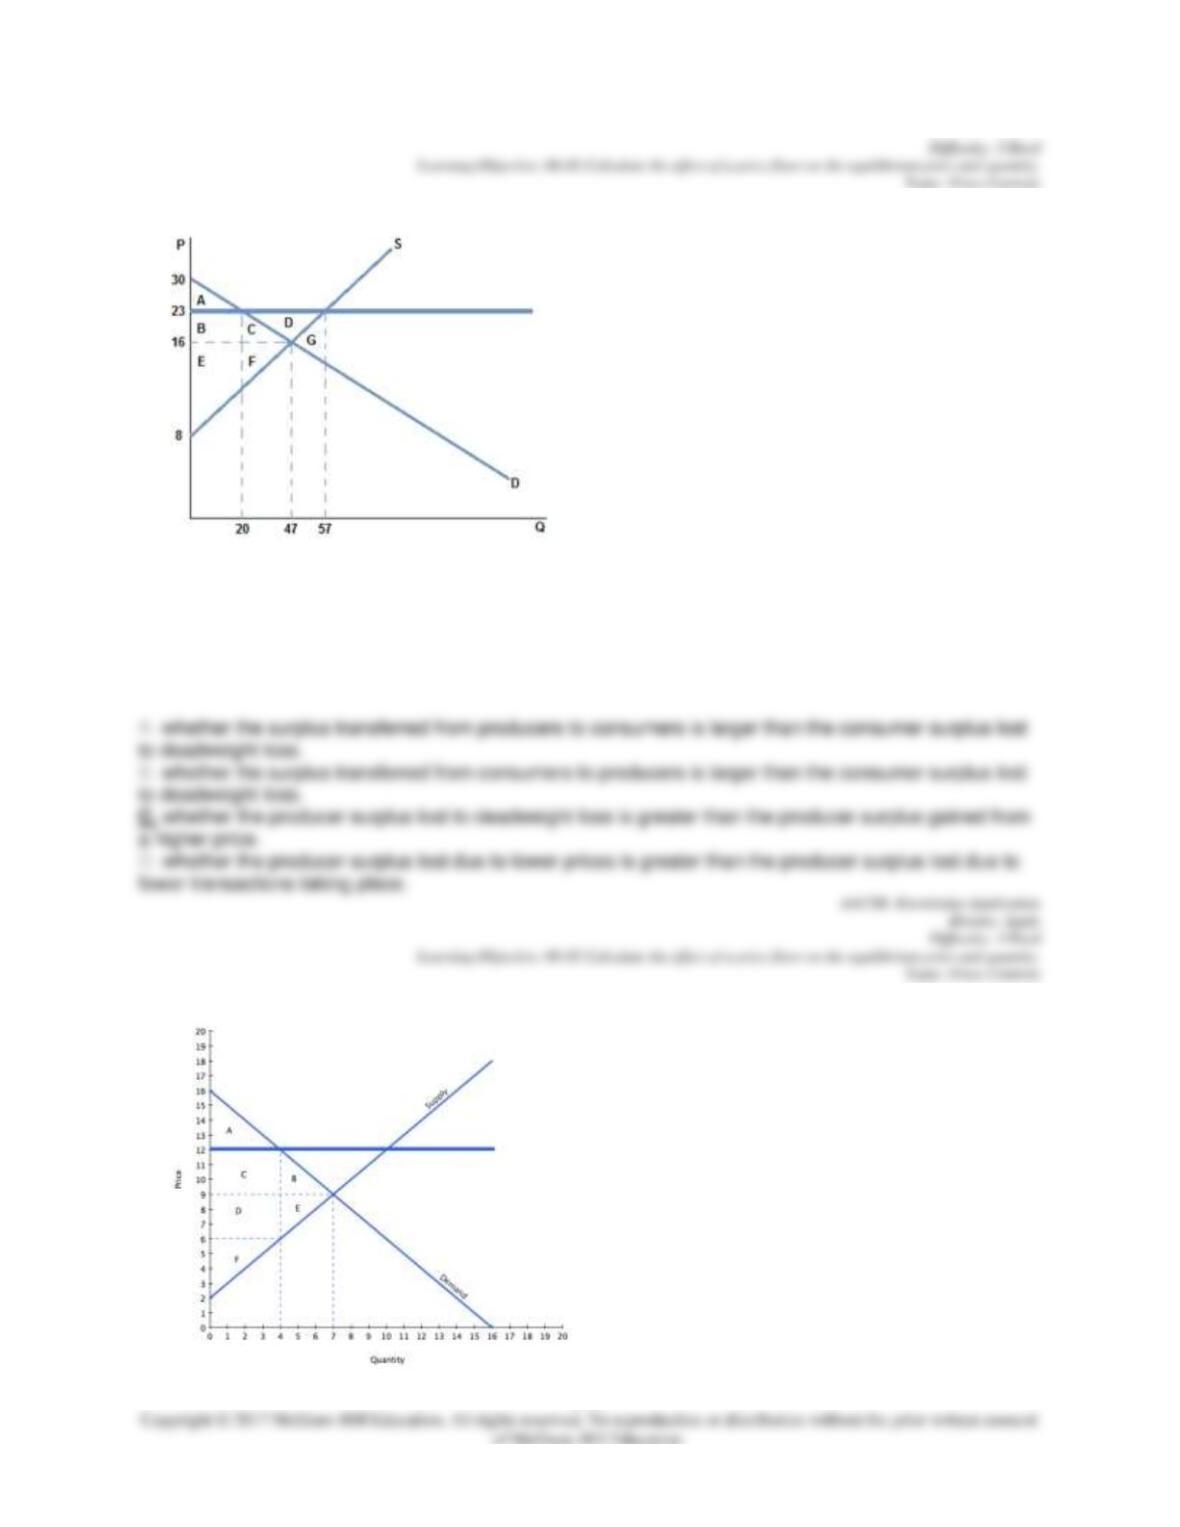
After a price floor of $23 is placed on the market in the graph shown:
6-31
72.
If the intended aim of the price floor set in the graph shown was a net increase in the well-being of
producers, then positive analysis would have us consider:
73.
6-32
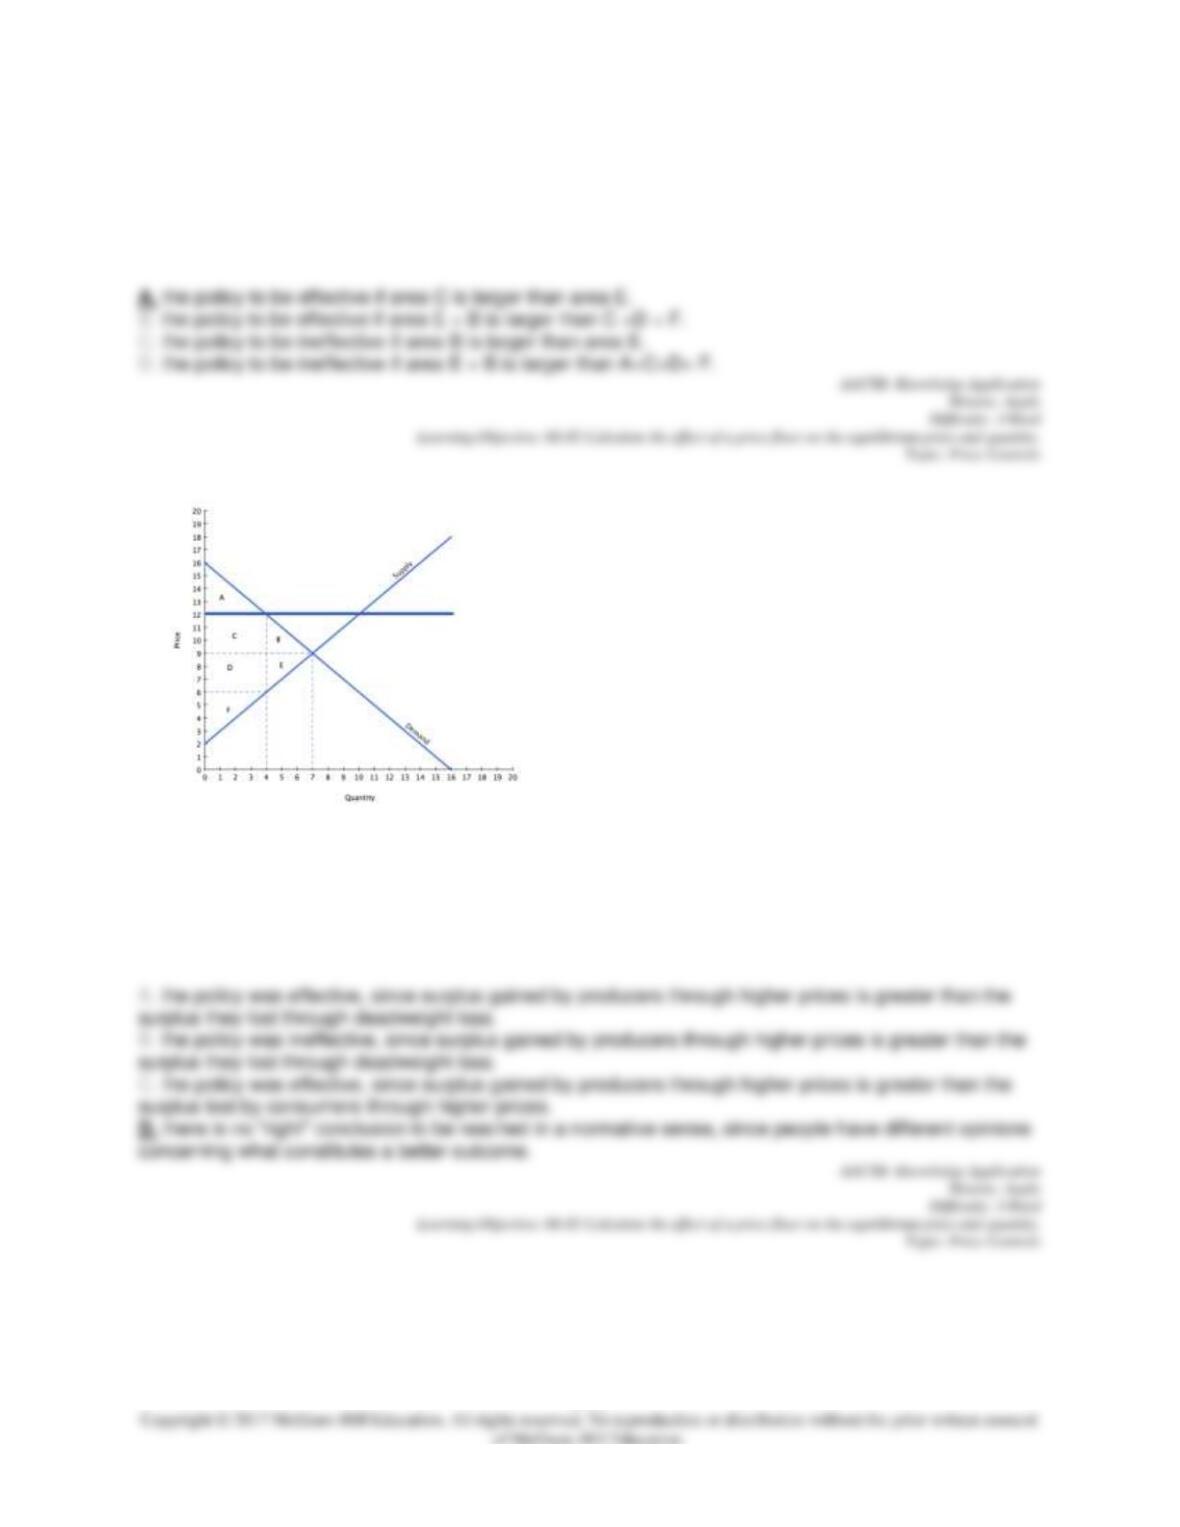
If the intended aim of the price floor set in the graph shown was a net increase in the well-being of
producers, then positive analysis would have us consider:
74.
If the intended aim of the price floor set in the graph shown was a net increase in the well-being of
producers, then normative analysis would conclude that:
75.
Which of the following changes to the market in the graph shown could cause the price floor to become
non-binding?
76. One way to ensure all producers benefit from a price floor is to:
77. Because a price floor causes:
78. An argument against price floors is:
79. Taxes:
80. A tax imposed on a good can:
81. A tax on sellers has what effect on a market?
82. A tax on sellers:
83. A tax on sellers:
84. A tax on sellers:
85. When a tax is imposed on a market:
86. A tax wedge:
87. The difference in the price the buyer pays and the price the sellers keep in the presence of a tax is
called:
88.
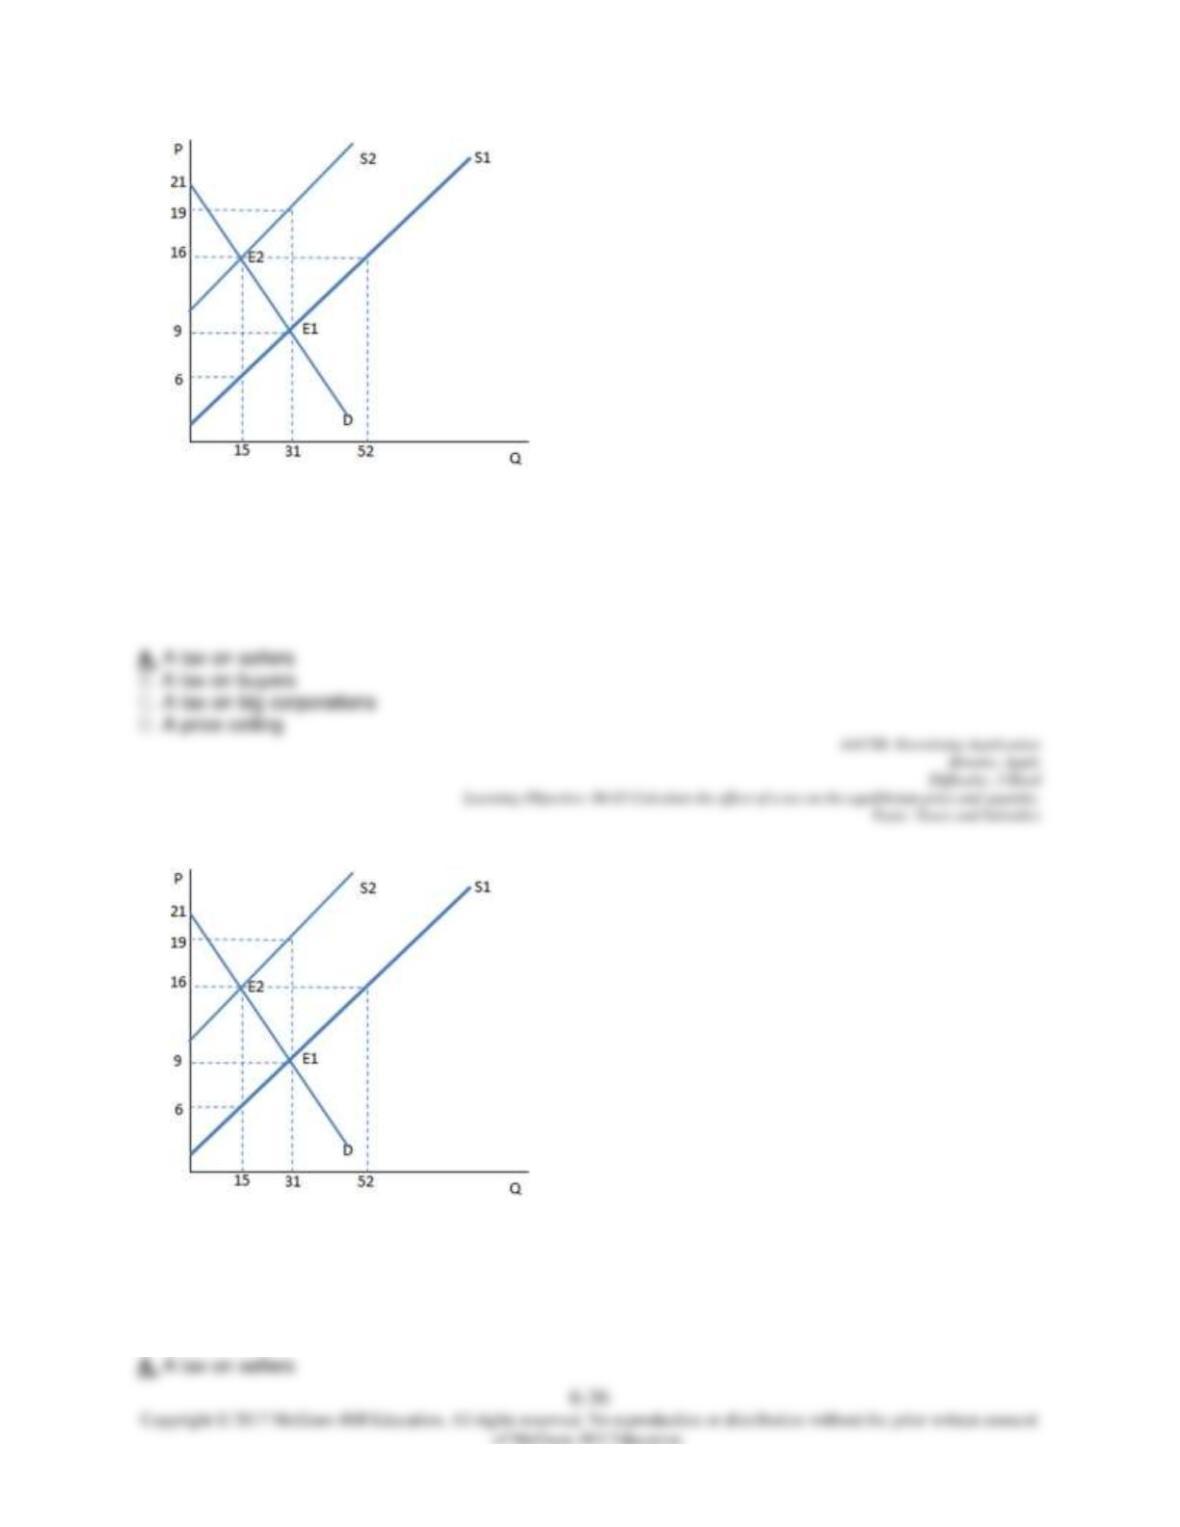
Suppose a tax has been imposed in the graph shown. Which kind of tax is most likely demonstrated by
this graph?
89.
Consider the graph shown. What would most likely be the cause of a shift from S1 to S2?
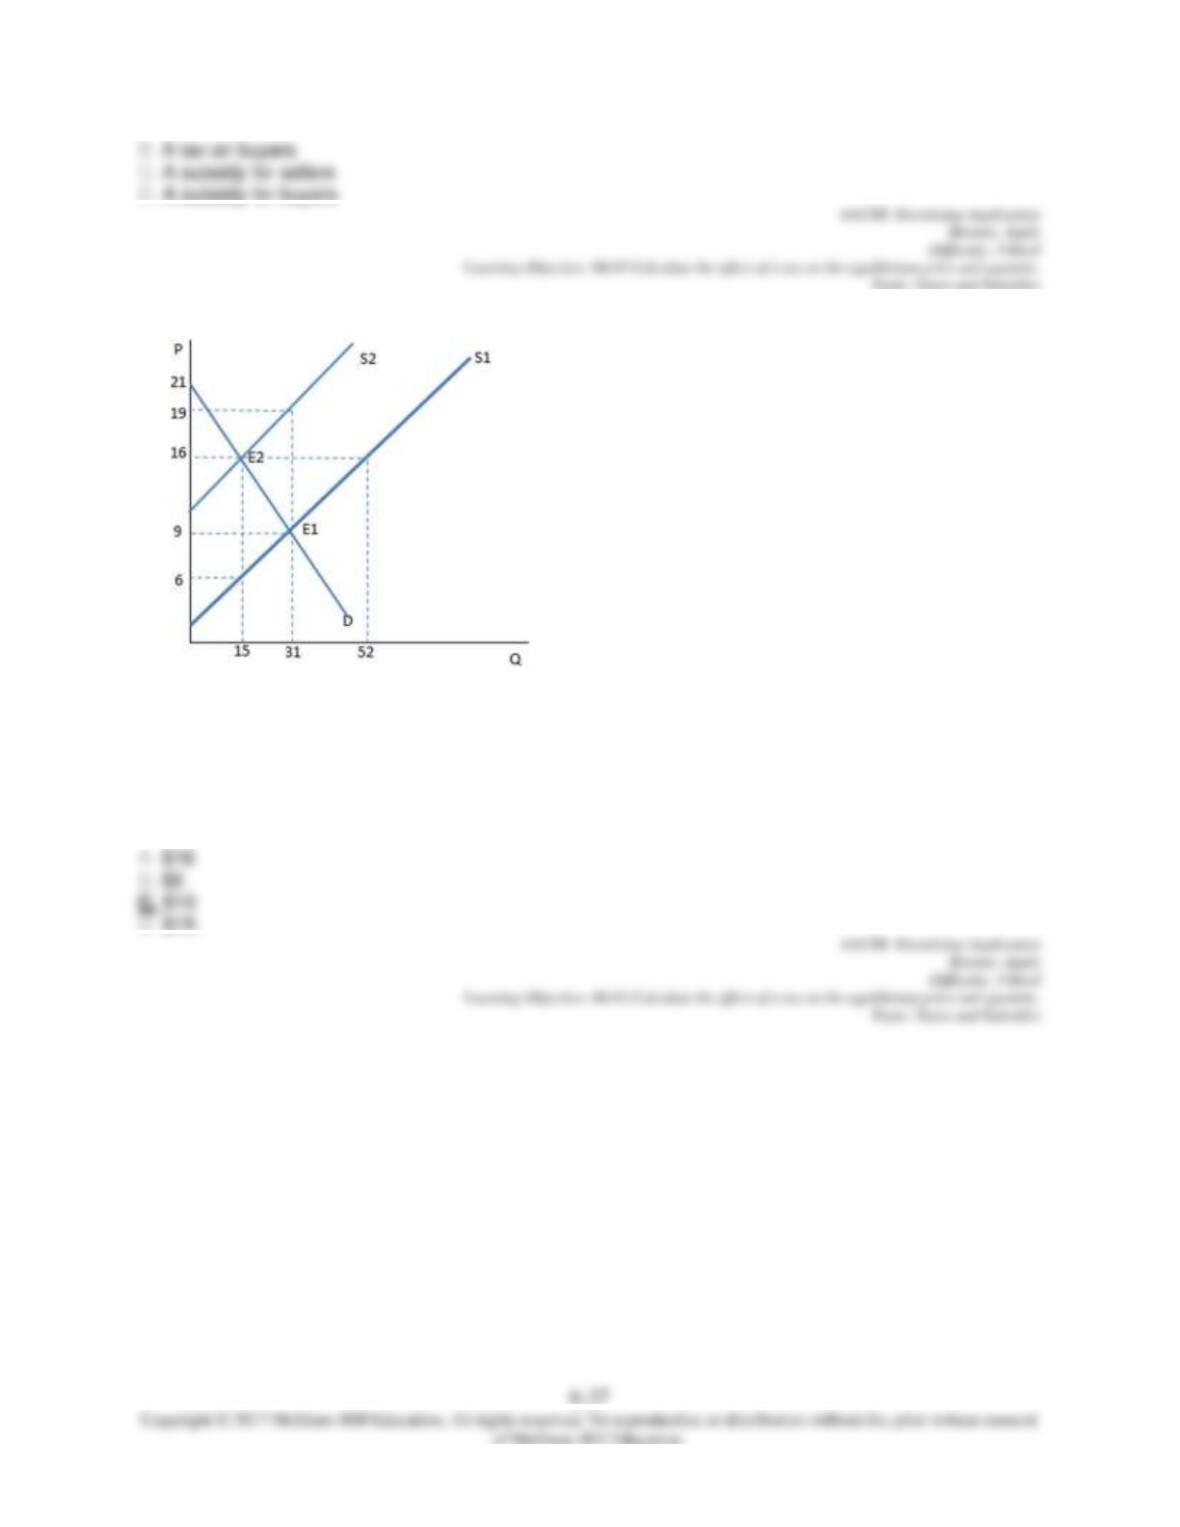
90.
Suppose a tax on sellers has been imposed in the graph shown. What is the total tax paid per unit of the
good?
6-38
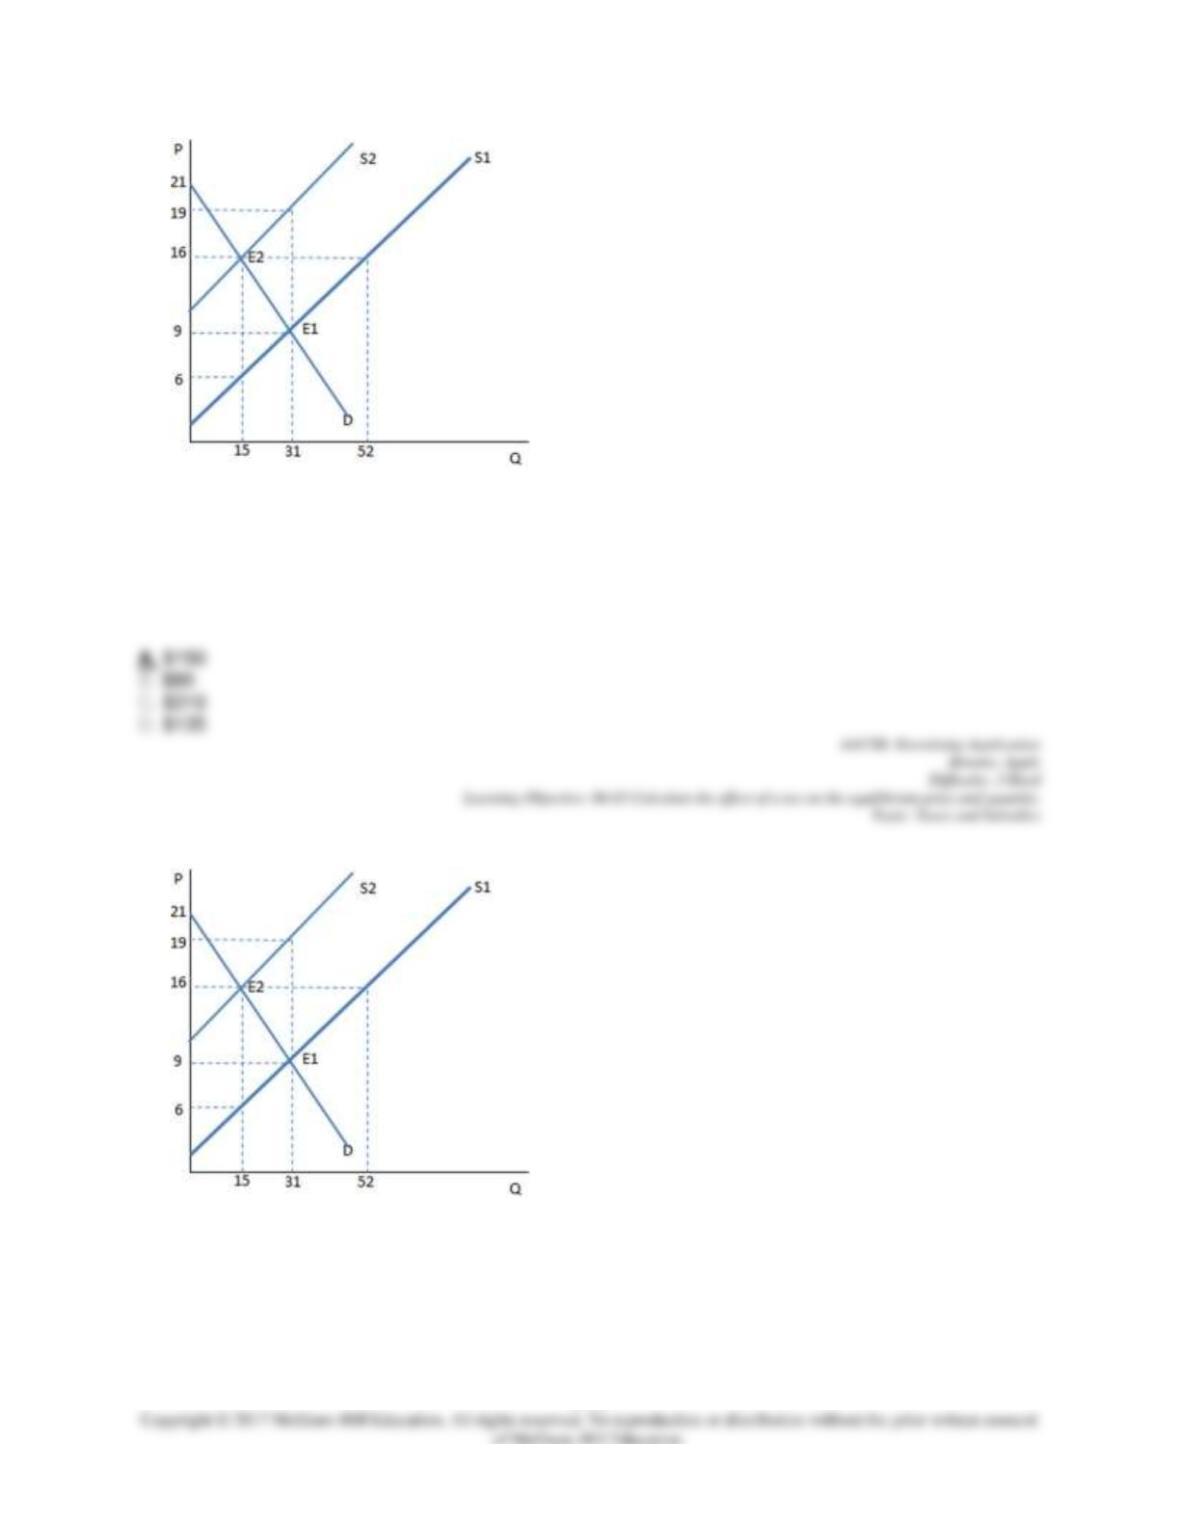
91.
The graph shown demonstrates a tax on sellers. What is the amount of tax revenue being generated from
the tax?
92.
The graph shown demonstrates a tax a sellers. Before the tax was imposed, the sellers produced
________ units and received __________ for each one sold.
6-39
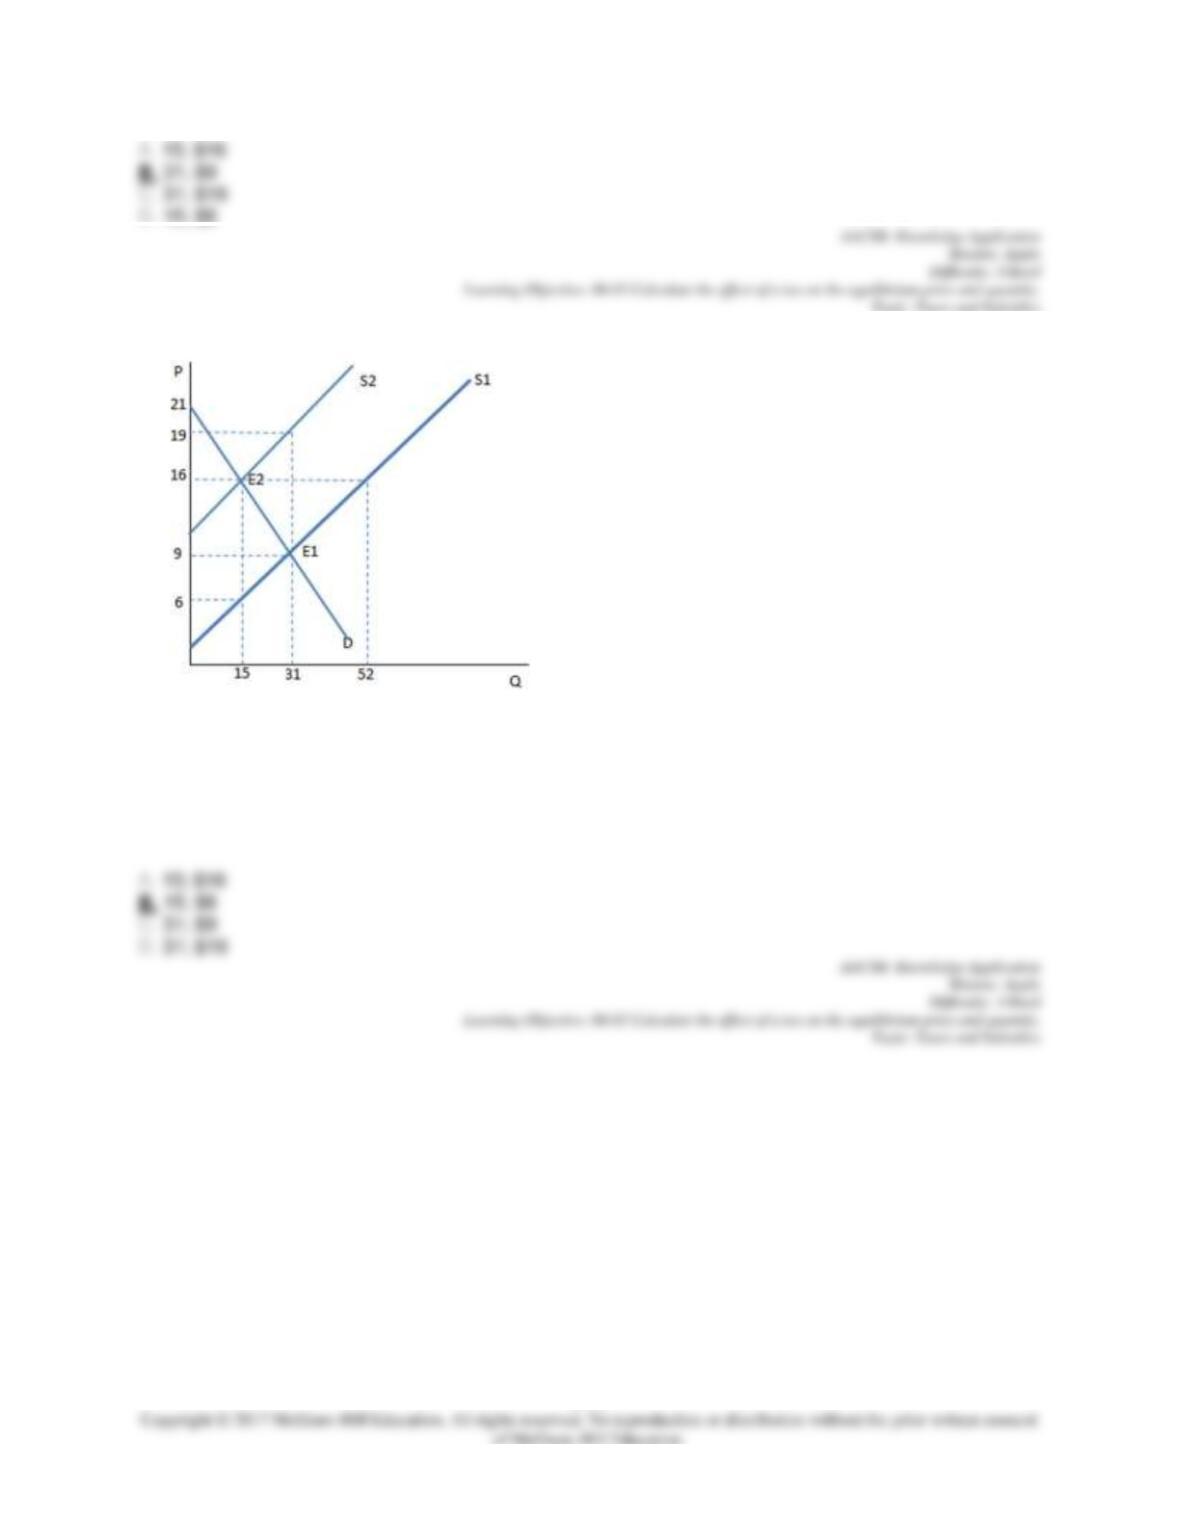
93.
The graph shown demonstrates a tax on sellers. Once the tax has been imposed, the sellers produce
____ units and receive _____ for each one sold.
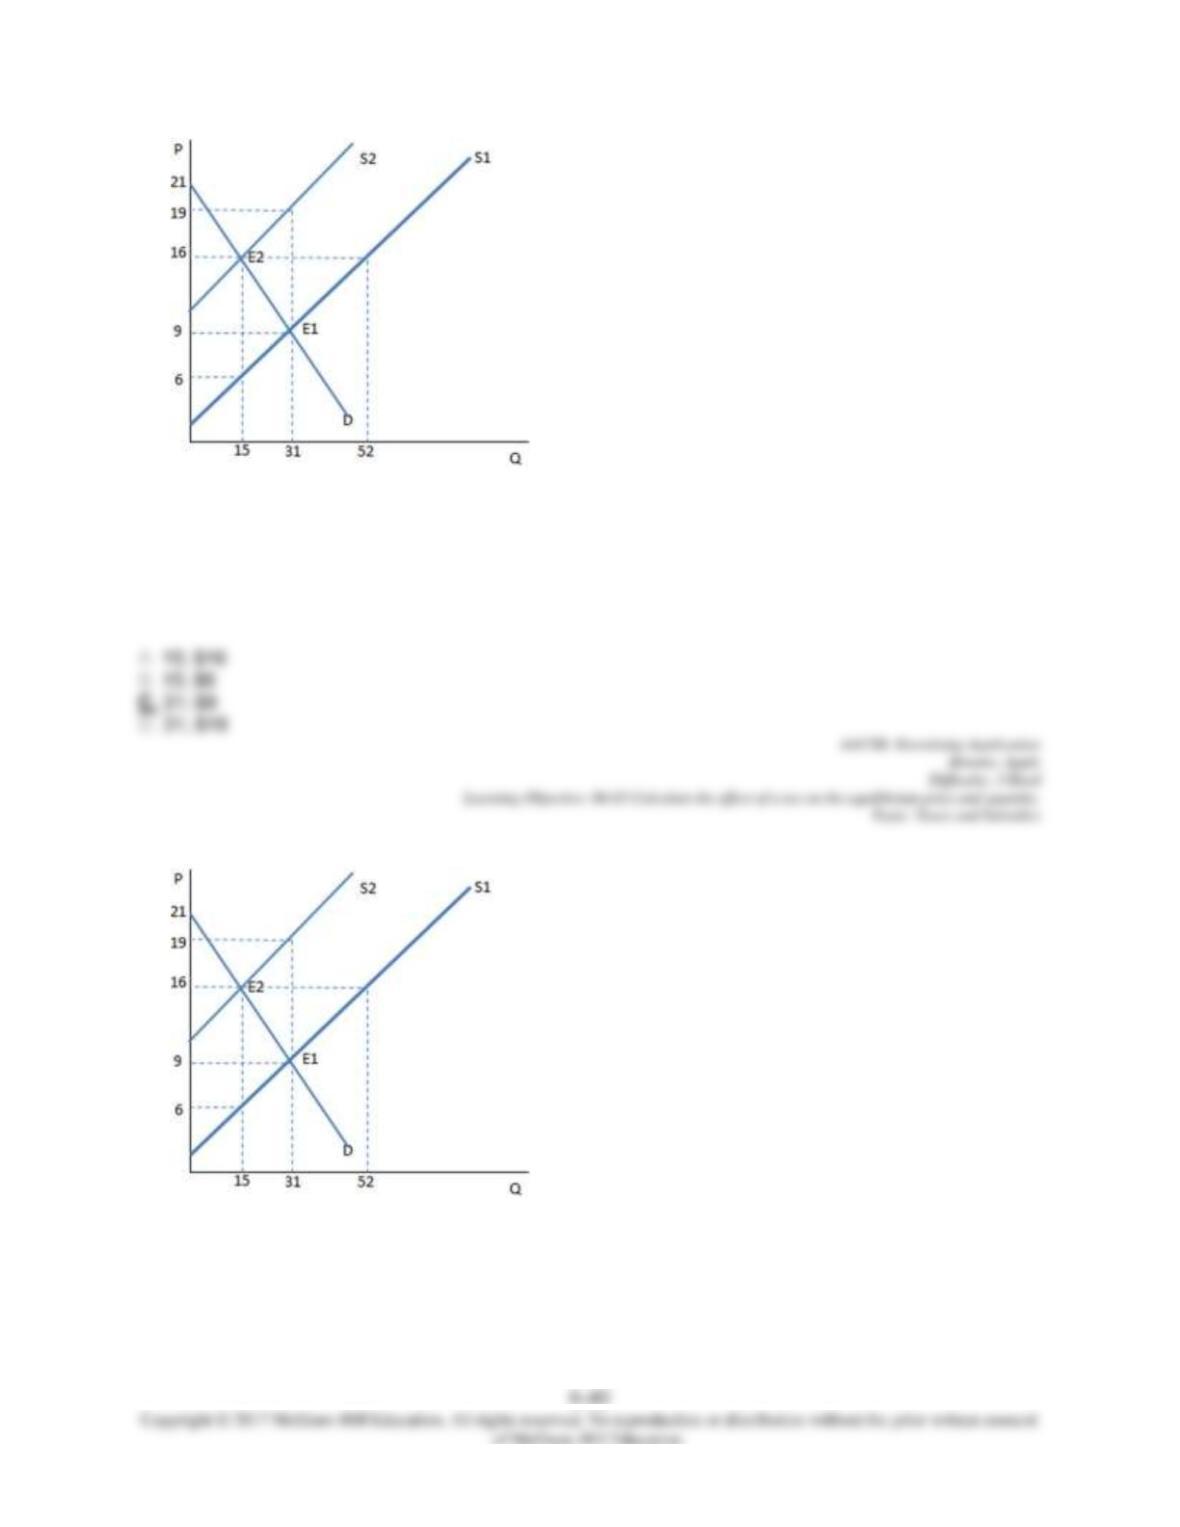
94.
The graph shown demonstrates a tax on sellers. Before the tax was imposed, the buyers purchased ____
units and paid _____ for each one.
95.
Suppose a tax on sellers has been imposed as shown in the graph. Once the tax is in place, the buyers
experience: