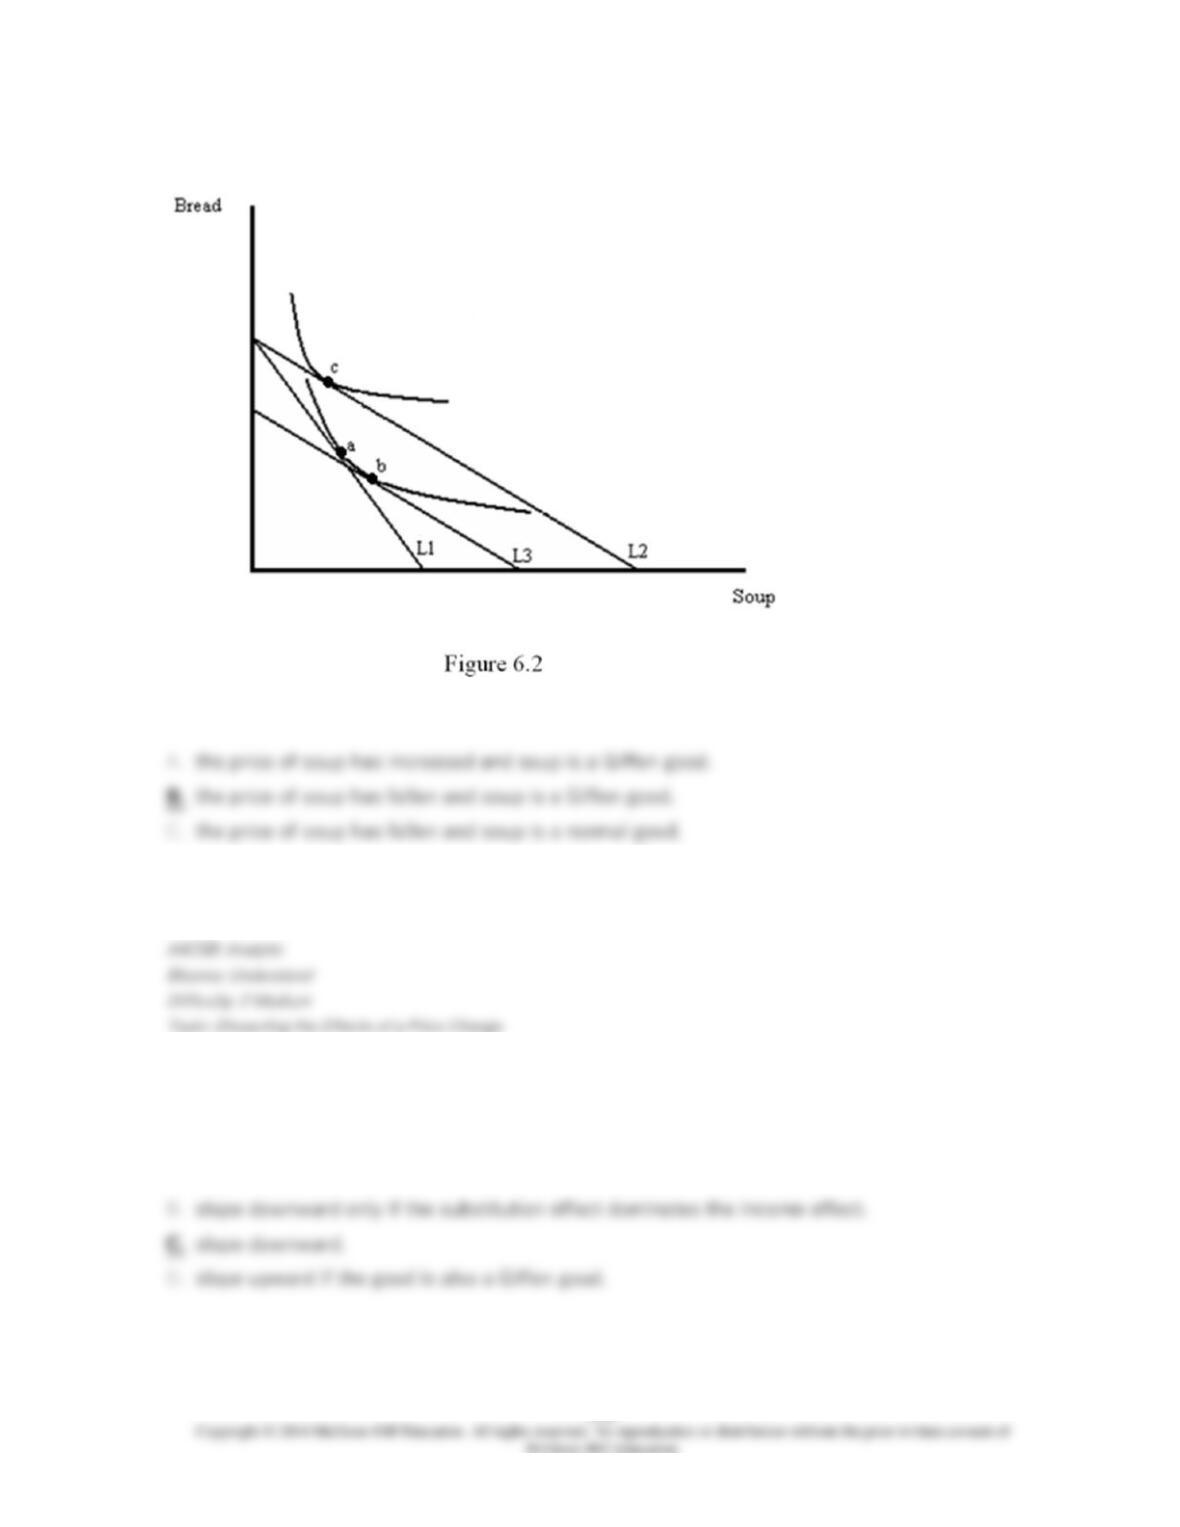
32. Figure 6.2 illustrates a change in the price of soup. From the graph, we can conclude that:
D. the price of soup has fallen and bread is a Giffen good.
33. The demand curve for a normal good will:
A. slope downward only if the income effect dominates the substitution effect.
34. The substitution effect of a price change ________ consistent with the Law of Demand.
D. for inferior goods is not
35. The income effect of a price change is:
A. always consistent with the Law of Demand.
36. If leisure is drawn on the horizontal axis and labor is drawn on the vertical axis, then a
person who attaches more importance to leisure than to labor will have indifference curves that:
D. will be L-shaped.
37. The demand curve for leisure will slope upward if leisure is a ______ good and the income
effect of a wage change is relatively _______.
D. inferior; small
38. Because individuals initially own more time than they consume and sell the difference to
their employers:
D. the income effect of a wage change is relatively small.
39. For low wages, the leisure demand curve slopes ______; for higher wages it slopes ______.
D. upward; upward
40. For low wages, the labor supply curve slopes ______; for higher wages it slopes ______.
D. upward; upward
41. Which of the following statements is true, assuming leisure is a normal good?
D. If the income effect is sufficiently large, the labor supply curve will shift to the left.
42. Suppose that an individual has chosen not to work. Then a change in the wage rate:
D. creates neither an income effect nor a substitution effect.
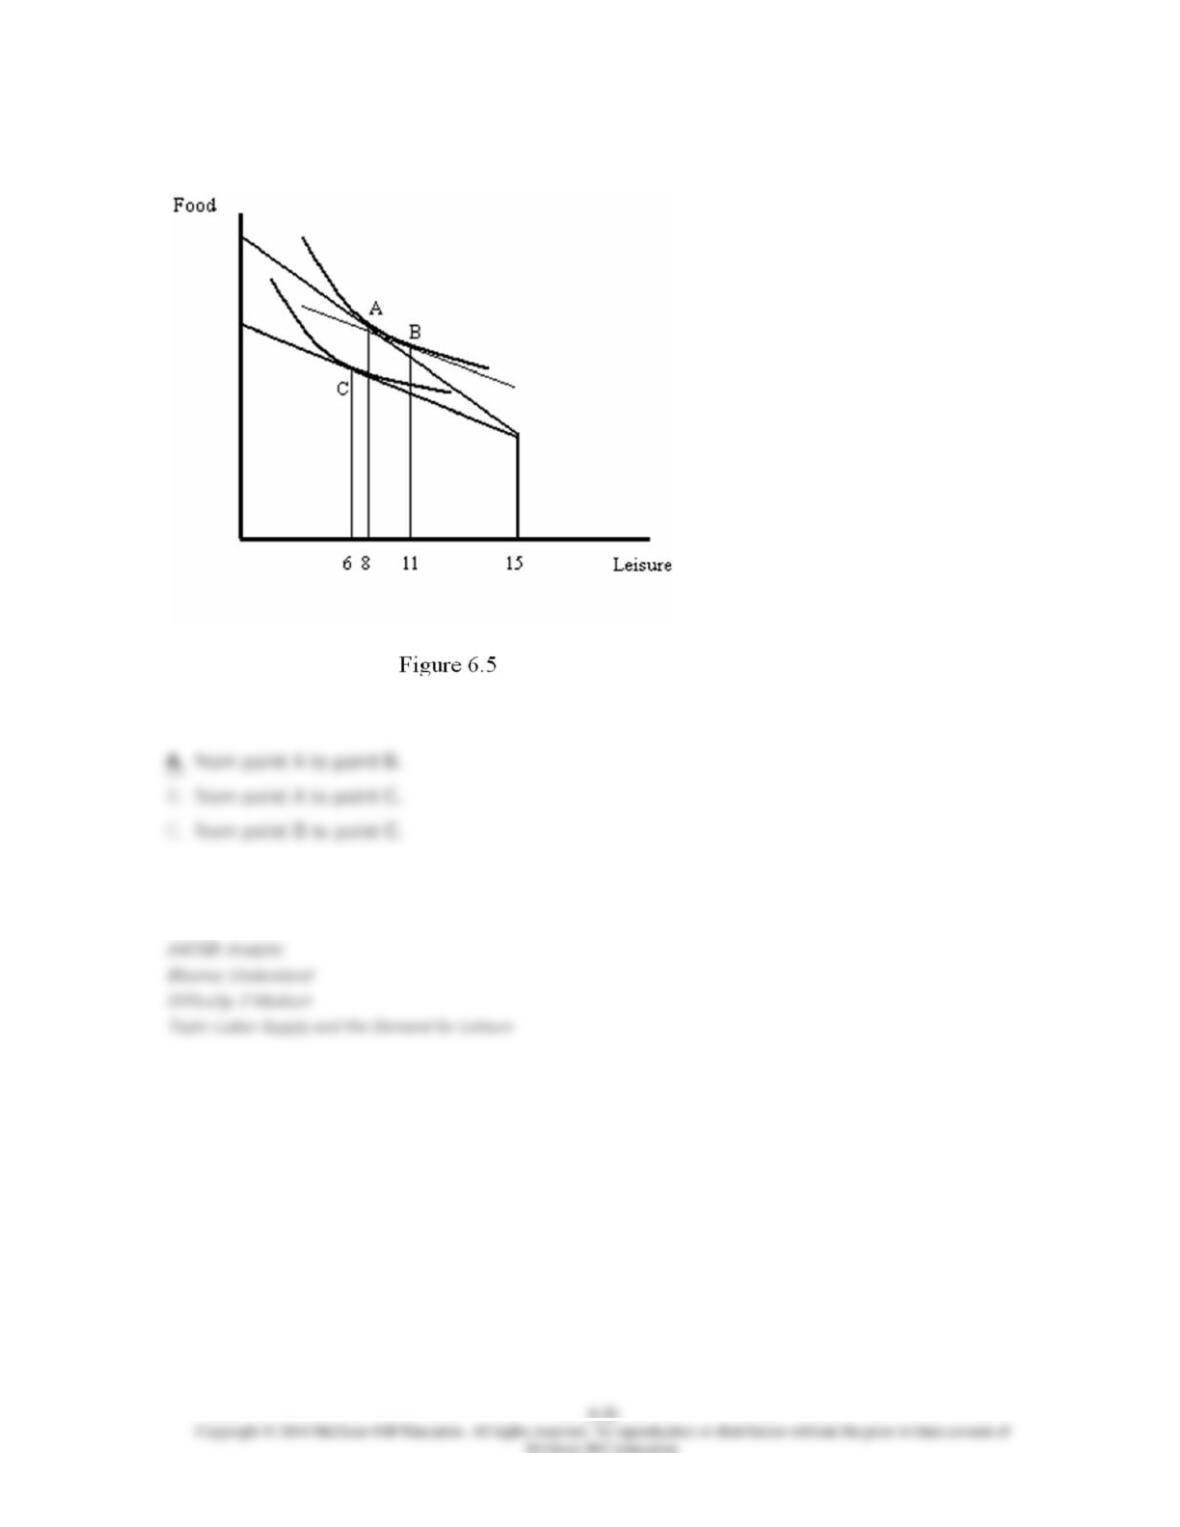
43. Refer to Figure 6.5. The substitution effect is shown by the movement:
D. from point B to point A.
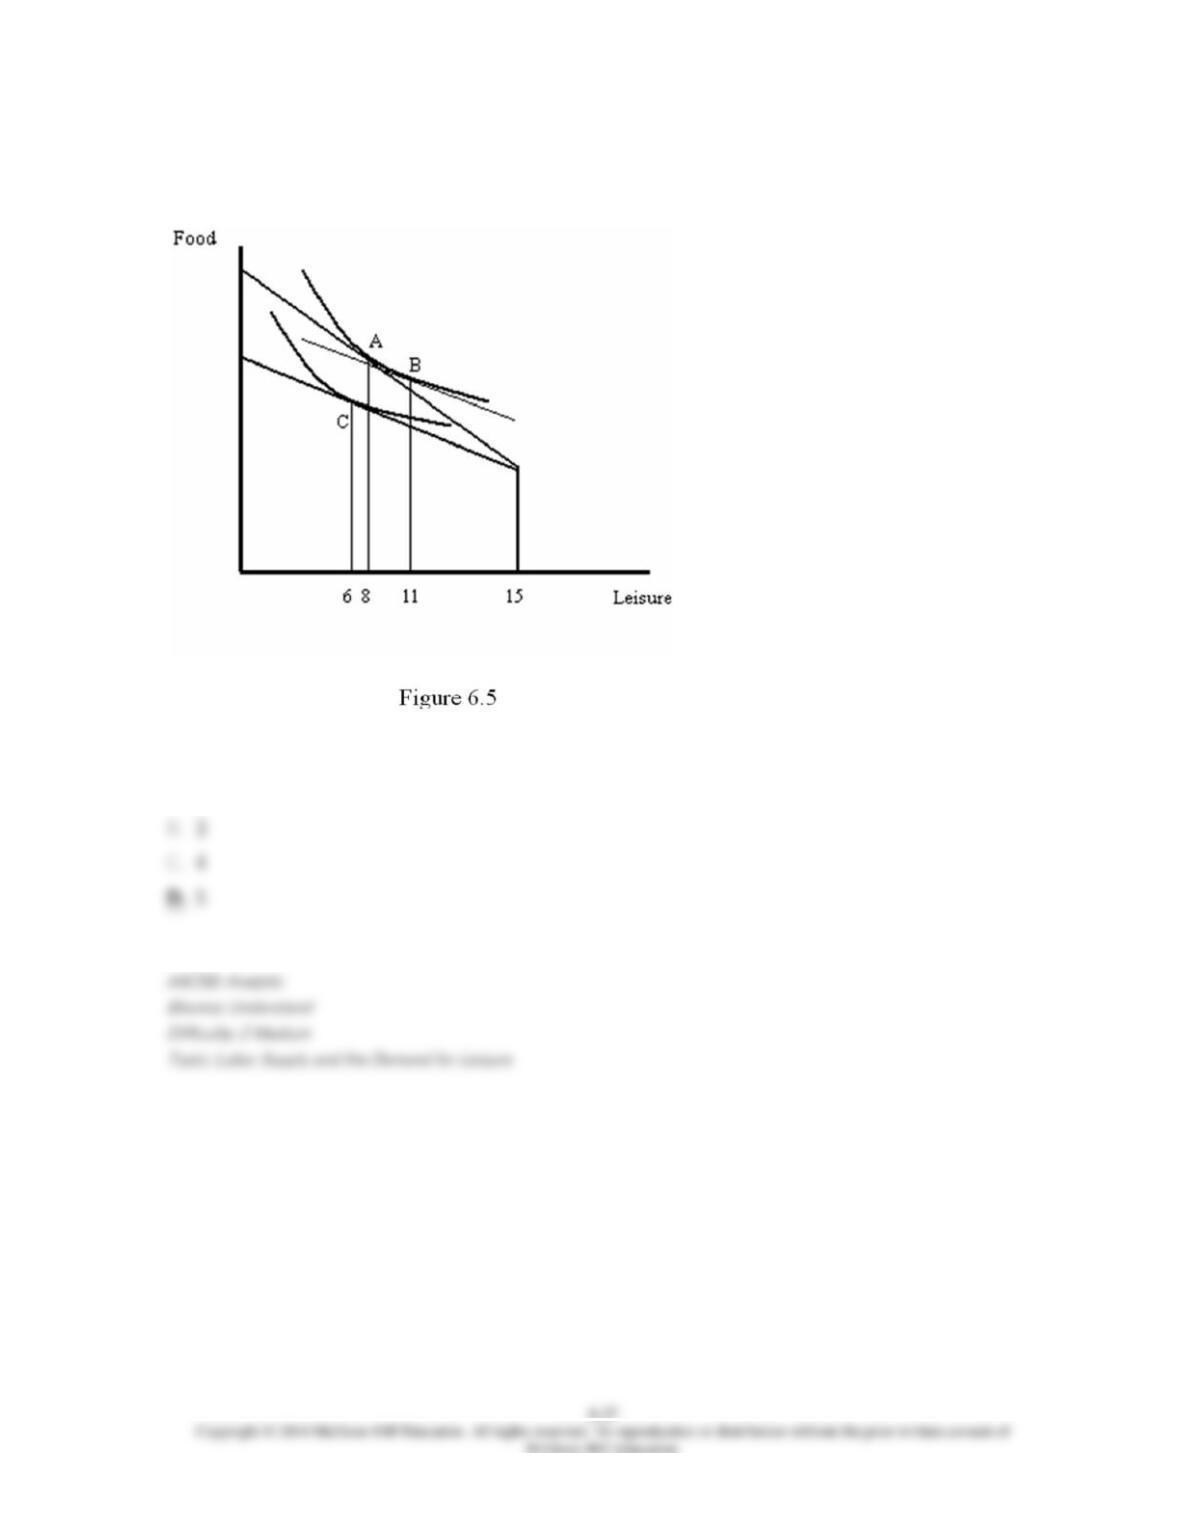
44. Refer to Figure 6.5. By how many hours does leisure change as a result of the income
effect of the wage change?
A. 2
45. Which of the following best describes labor force participation rates for men and women
over the period 1960 to 2000?
A. Labor force participation rates for both men and women increased.
46. A demand curve that shows the relationship between the price of a good and the amount
of the good consumed holding the consumer’s income fixed and allowing their well-being to vary
is called:
D. a derived demand curve.
47. A demand curve that shows the relationship between the price of a good and the amount
of the good consumed holding the consumer’s well-being fixed and allowing their to income vary
is called:
D. a derived demand curve.
48. A consumer’s ______ determines the location of their uncompensated demand curve, while
the level of their ______ determines the location of their compensated demand curve.
D. preferences; well-being
49. For a normal good, the income and substitution effects work in the ______ direction.
Therefore, a change in price produces a ______ change in uncompensated demand than in
compensated demand.
A. opposite; smaller
50. A Hicksian, or compensated, demand curve reflects:
D. neither the income nor the substitution effects of a price change.
51. A Marshallian, or uncompensated, demand curve reflects:
A. only the substitution effect of a price change.
52. If a good is inferior, then whenever the compensated demand curve intersects the
uncompensated demand curve:
D. the compensated demand curve will be upward-sloping.
53. What is the difference between approximate and exact consumer surplus?
D. Approximate consumer surplus can be measured, while exact consumer surplus cannot be
measured.
54. When income effects are small:
A. there is no difference between the uncompensated demand curve and the uncompensated
demand curve.
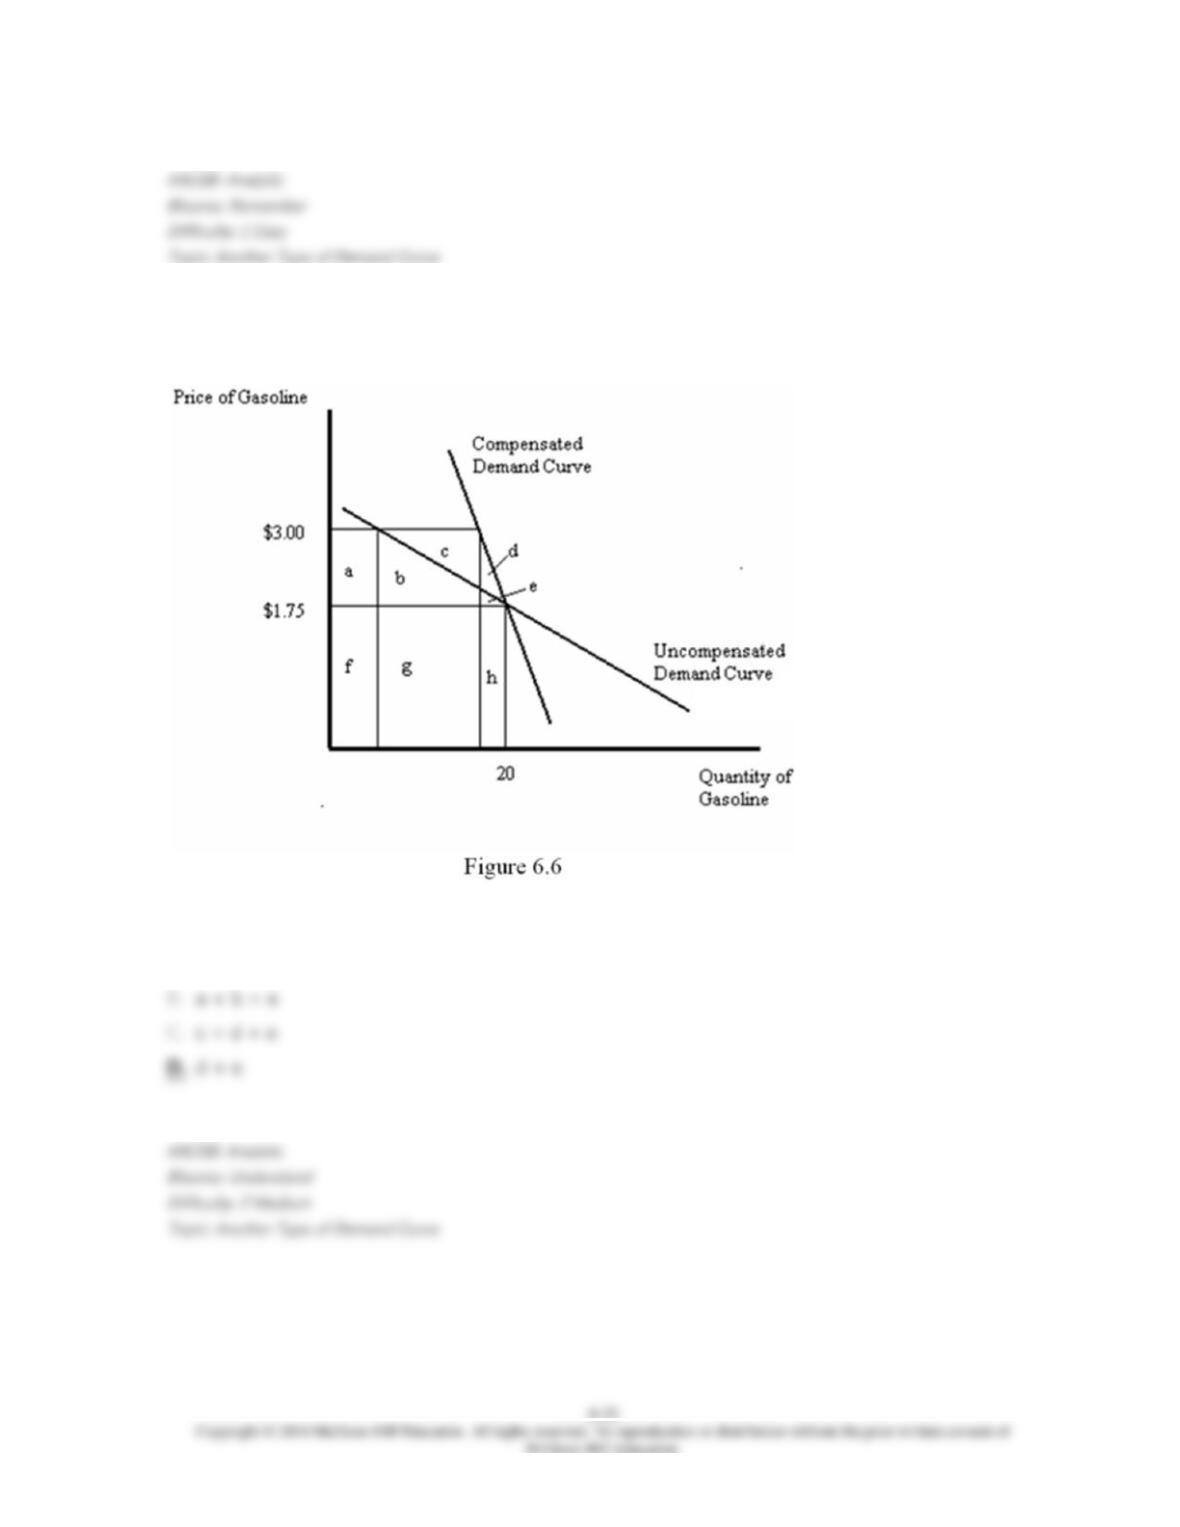
55. Refer to Figure 6.6. What area represents the compensation for reduced consumption that
results from an increase in the price of gasoline from $1.75 to $3.00 per gallon?
A. a + b
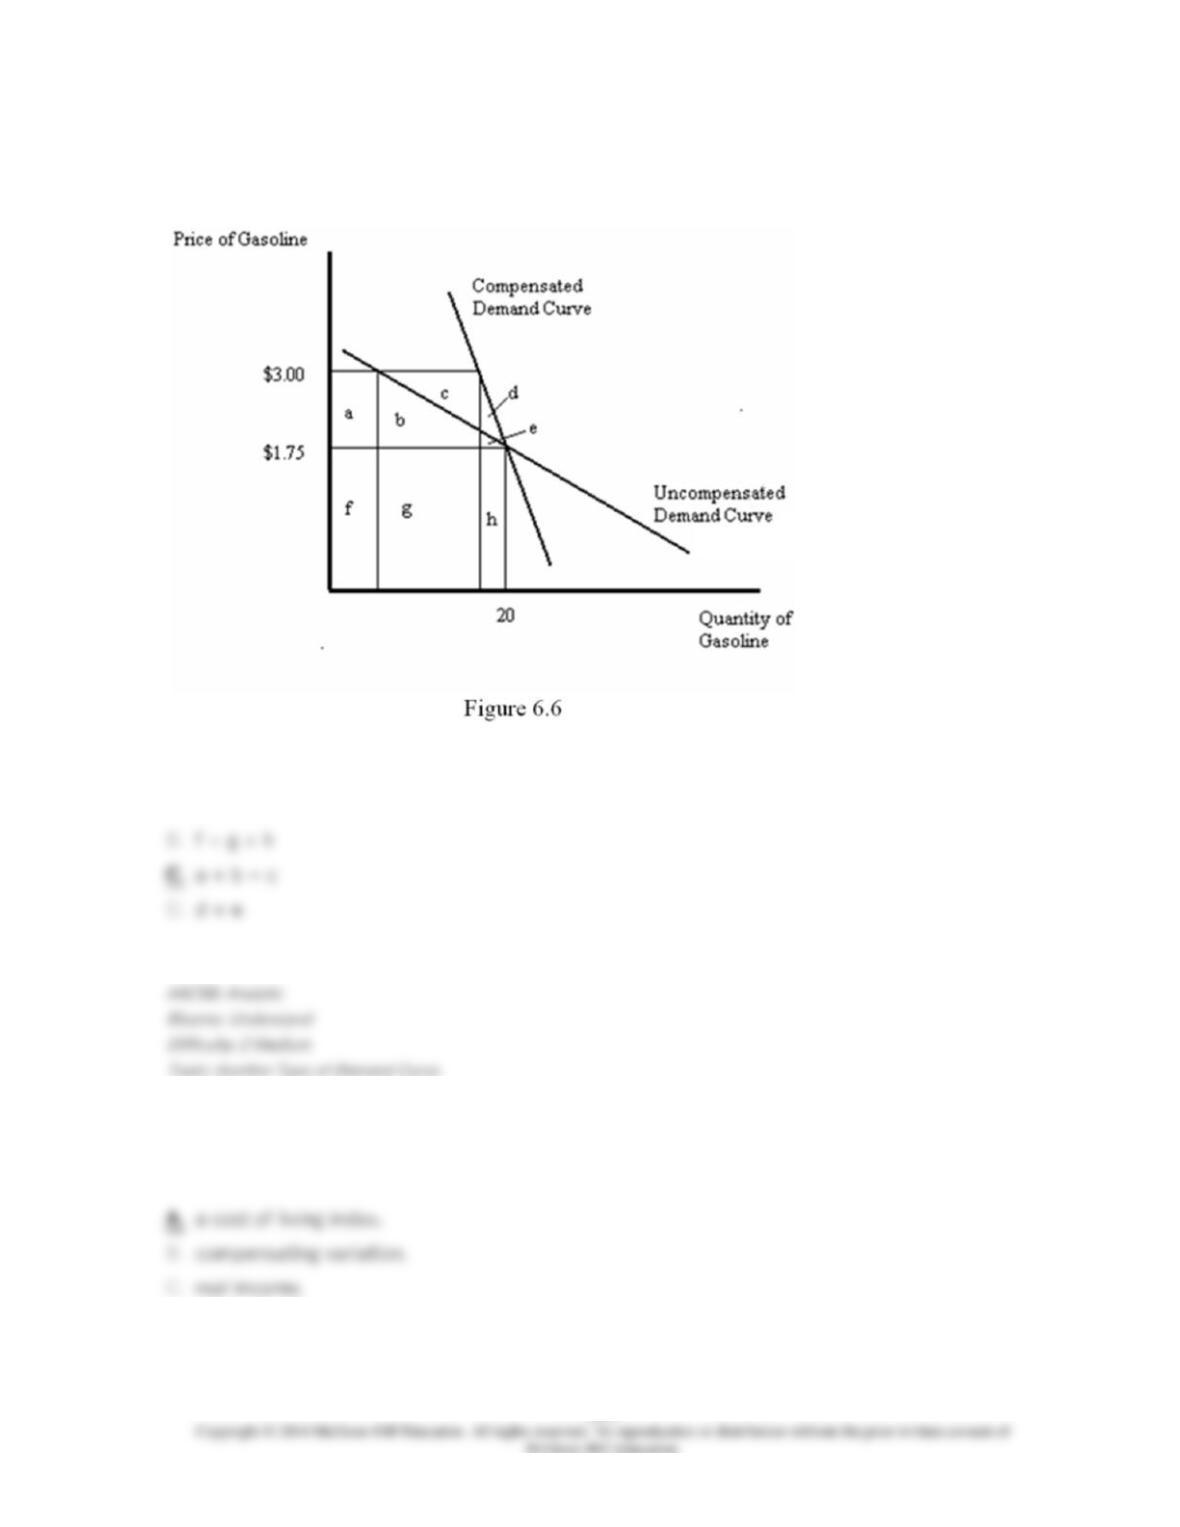
56. Refer to Figure 6.6. What area represents the compensation for an increase in the price of
gasoline from $1.75 to $3.00 per gallon?
A. a + b + c + d + e
57. The relative cost of achieving a fixed standard of living in different situations is called:
D. consumer surplus.