Chapter 06 Test Bank KEY
1. A type of public policy set in response to rising prices of a basic necessity, such as food, might be:
2. Government attempts to lower, raise, or simply stabilize prices can:
3. Governments may attempt to protect dairy farmers from low milk prices by:
4. Government attempts to set prices below market equilibrium can:
5. Governments may intervene in markets to:
6. Governments can discourage consumption of certain goods by:
7. Governments may choose to intervene in a market in an attempt to:
8. Situations in which the assumption of efficient, competitive markets fails to hold are called:
9. An example of a market failure is when:
10. If there is a sole producer of a good, and he faces no threat of competition, it is likely that:
11. A market failure is most likely to occur when:
12. If there is a sole producer of a good, and he faces no threat of competition, it is likely that:
13. The government imposing a minimum wage is an example of an attempt to:
14. In evaluating policy effectiveness, economists rely on:
15. Positive analysis:
16. Positive analysis:
17. Normative analysis:
18. Price controls:
19. A price ceiling is:
20. A price floor is:
21. For a price ceiling to have an impact on a market it:
22. A price ceiling is non-binding when:
23. In order for a price ceiling to “bind,” it:
24. A price floor that is binding:
25. Governments tend to set price ceilings:
26. A binding price ceiling:
6-6
27. A binding price floor:
28.
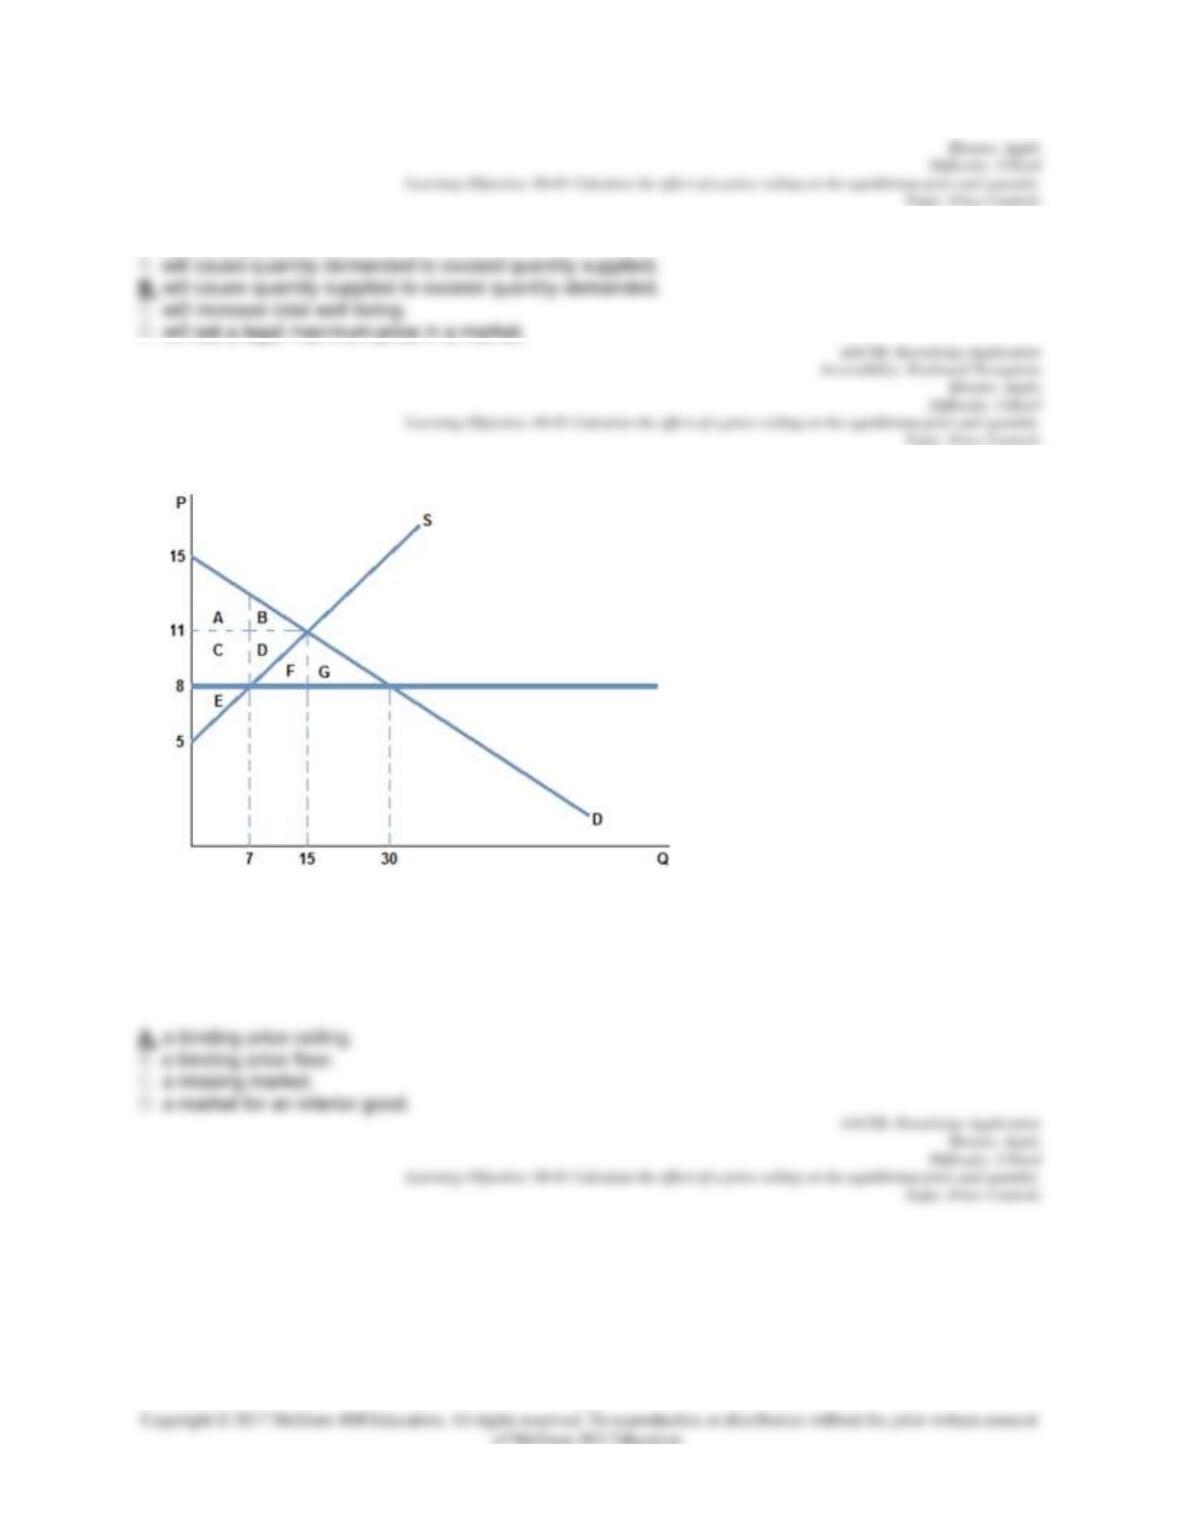
The graph shown best represents:
6-7
29.
If a binding price ceiling were placed in the market in the graph shown:
30.
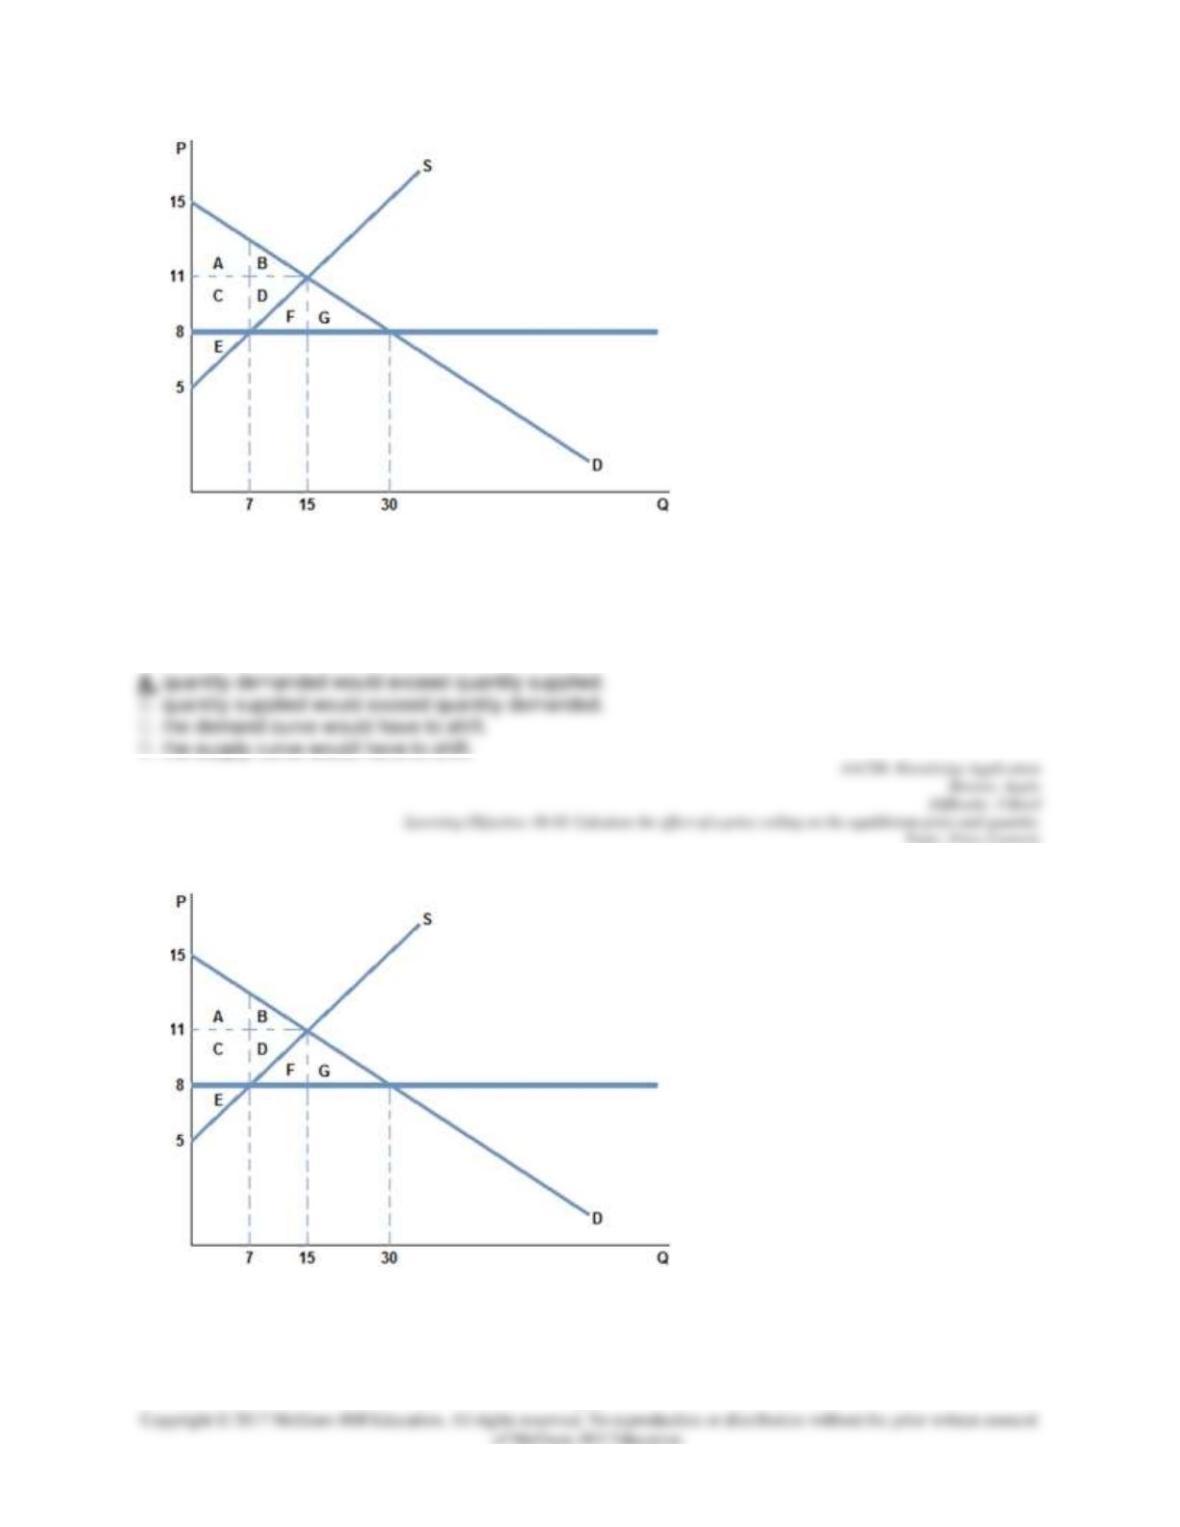
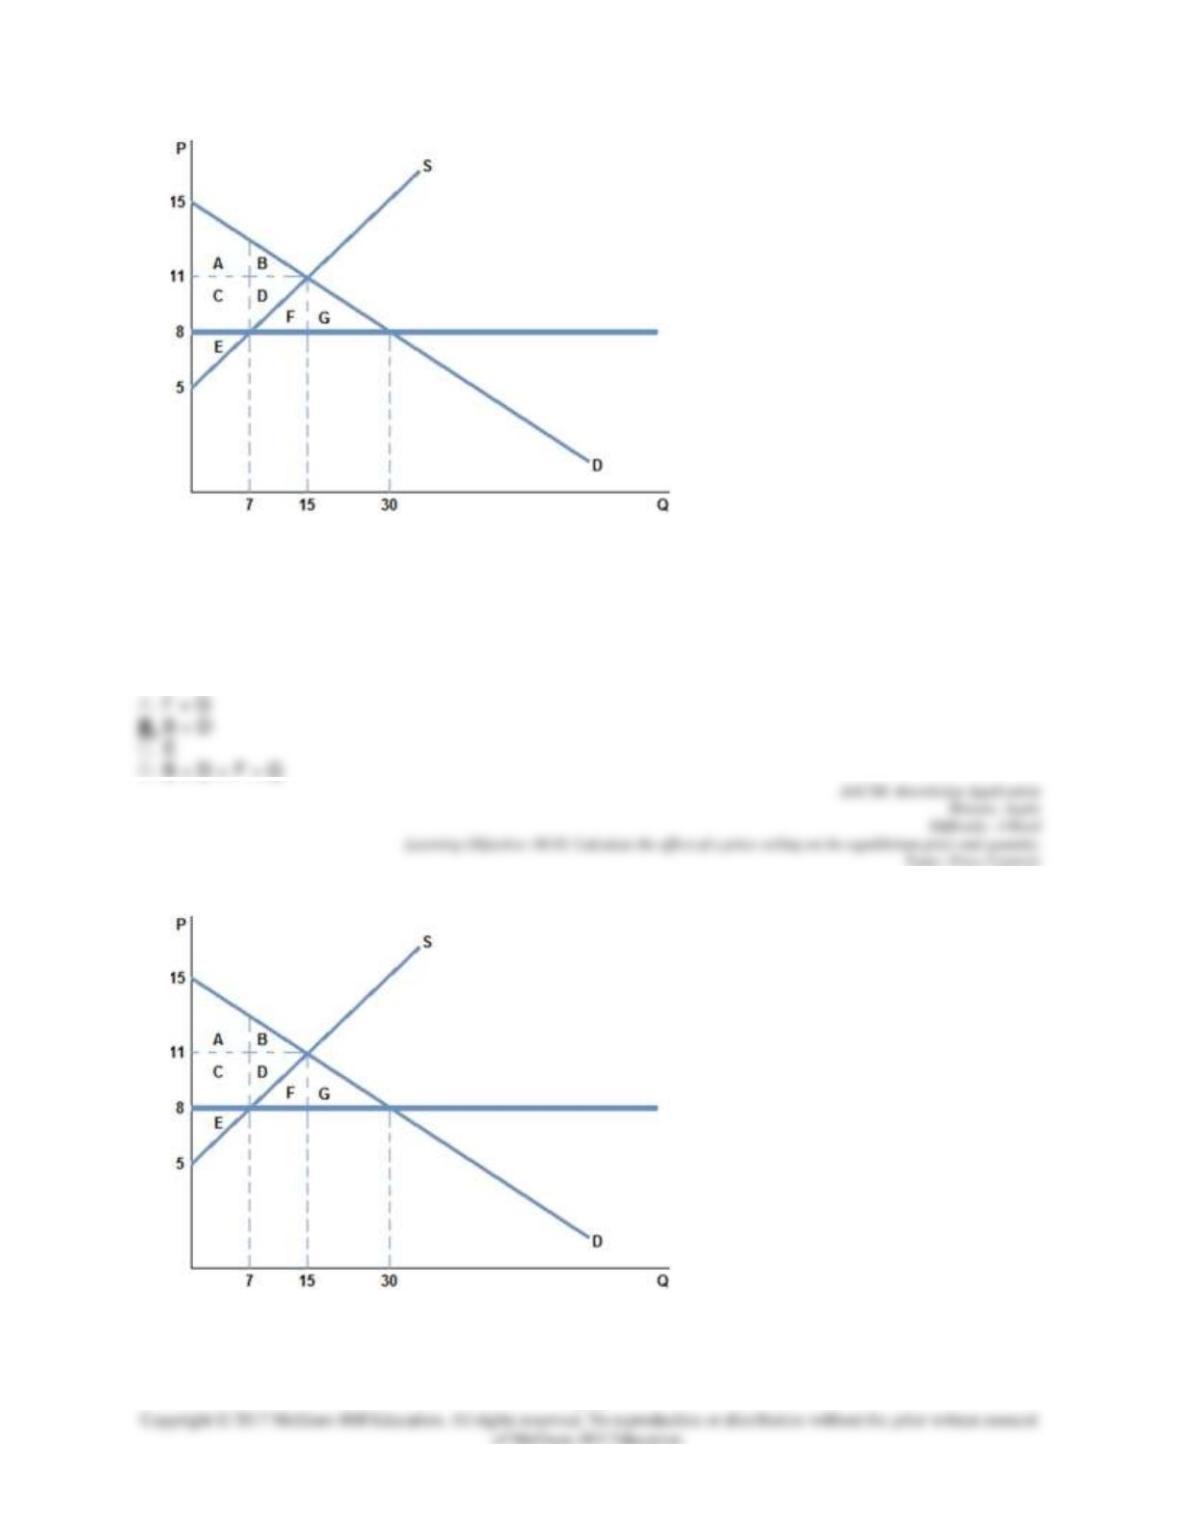
If a price ceiling of $8 were placed in the market in the graph shown:
31.
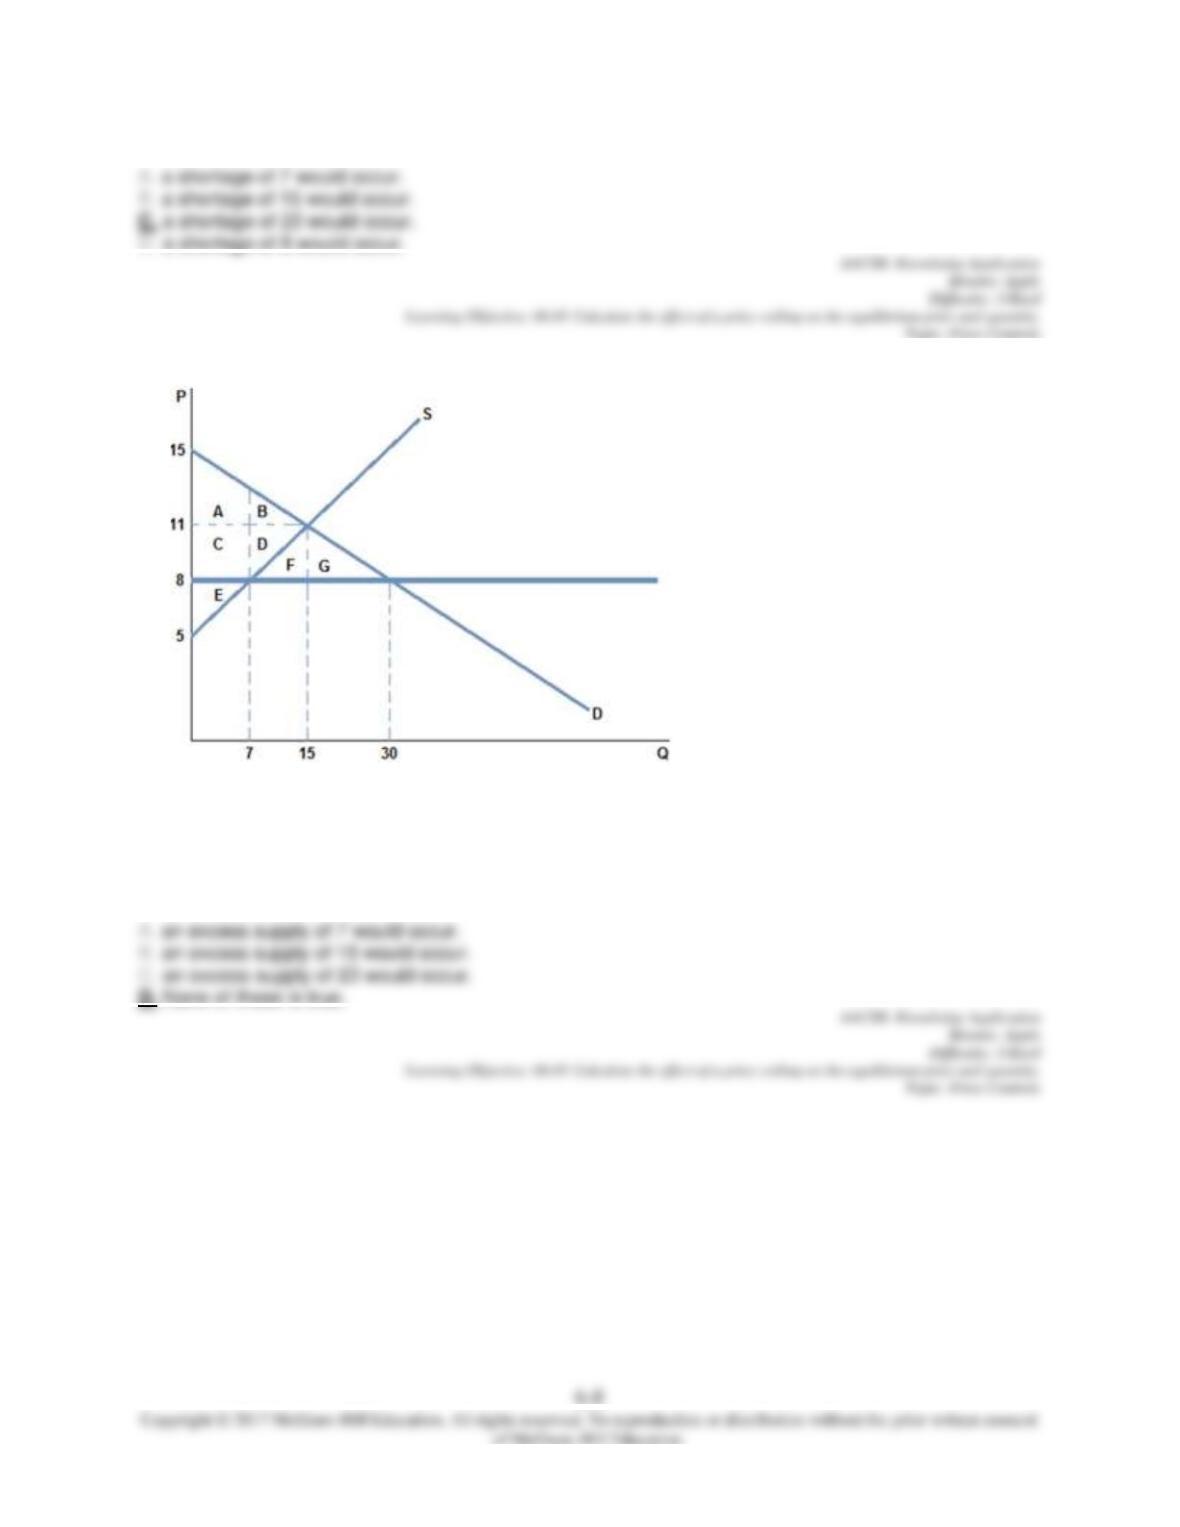
If a price ceiling of $8 were placed in the market in the graph shown:
6-9
32.
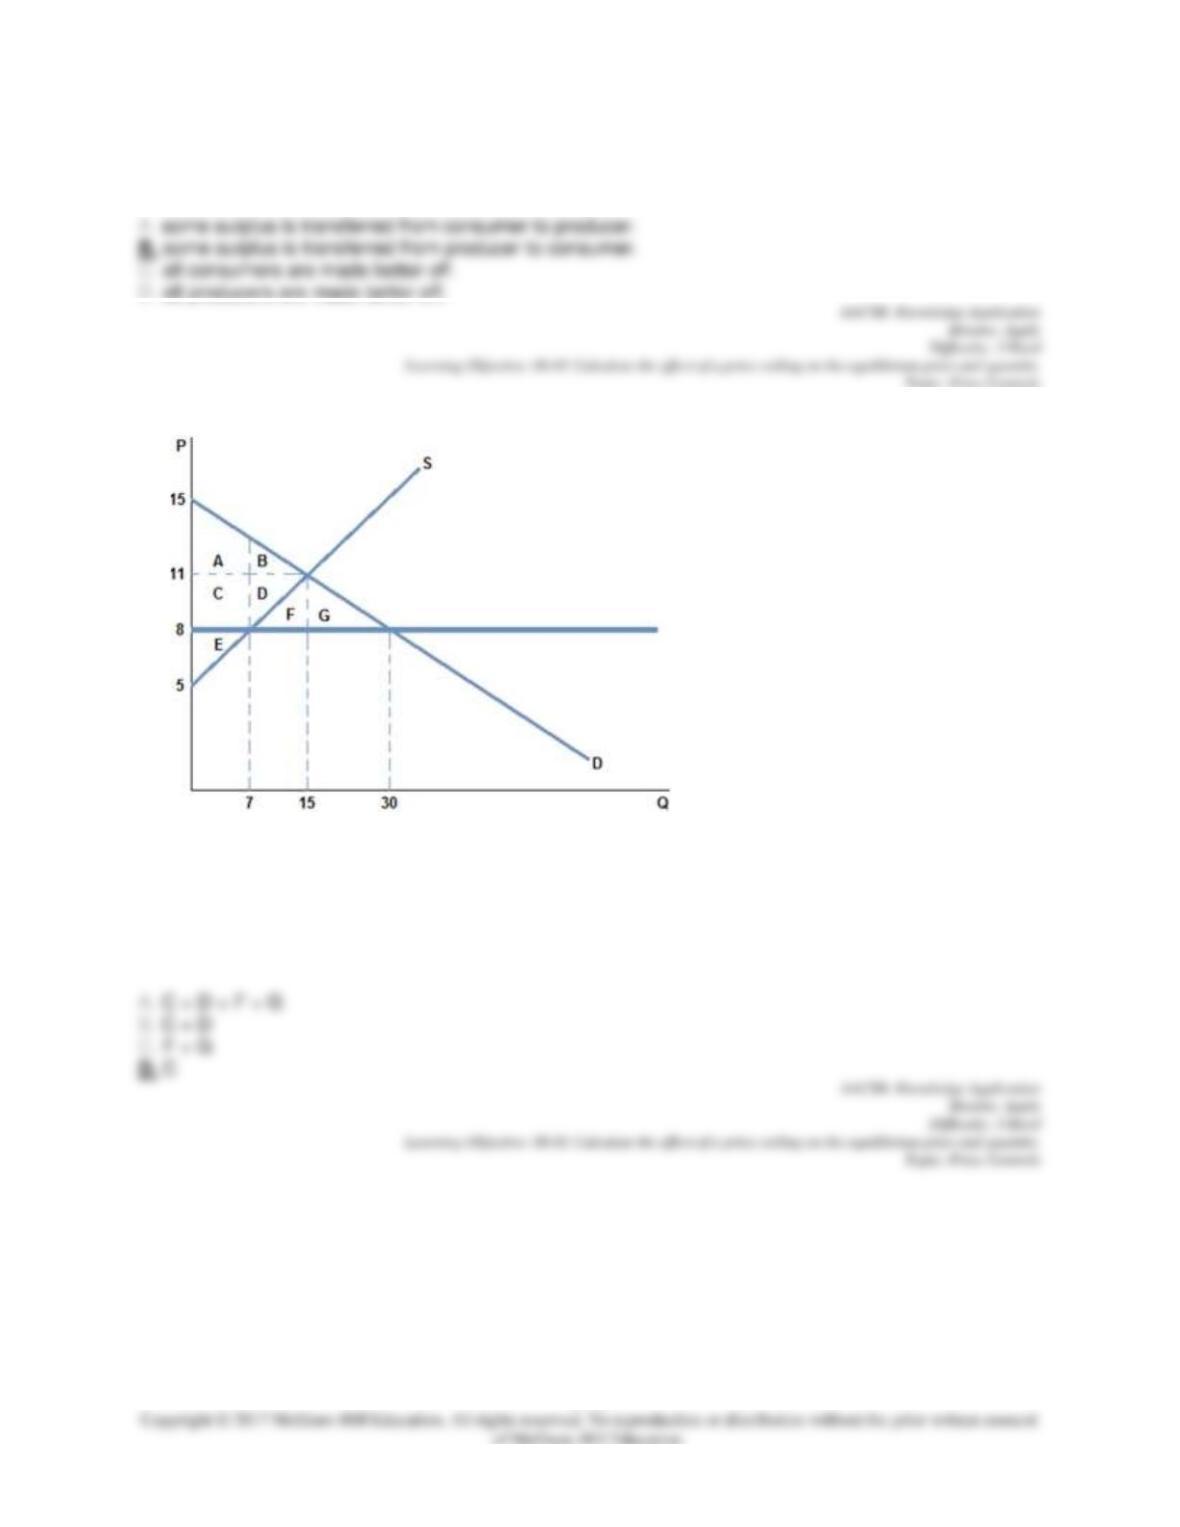
If a price ceiling of $8 were placed in the market in the graph shown, which area represents deadweight
loss?
33.
6-10
If a price ceiling of $8 were placed in the market in the graph shown:
34.
If a price ceiling of $8 were placed on the market in the graph shown, which area represents the surplus
that is transferred from producers to consumers?
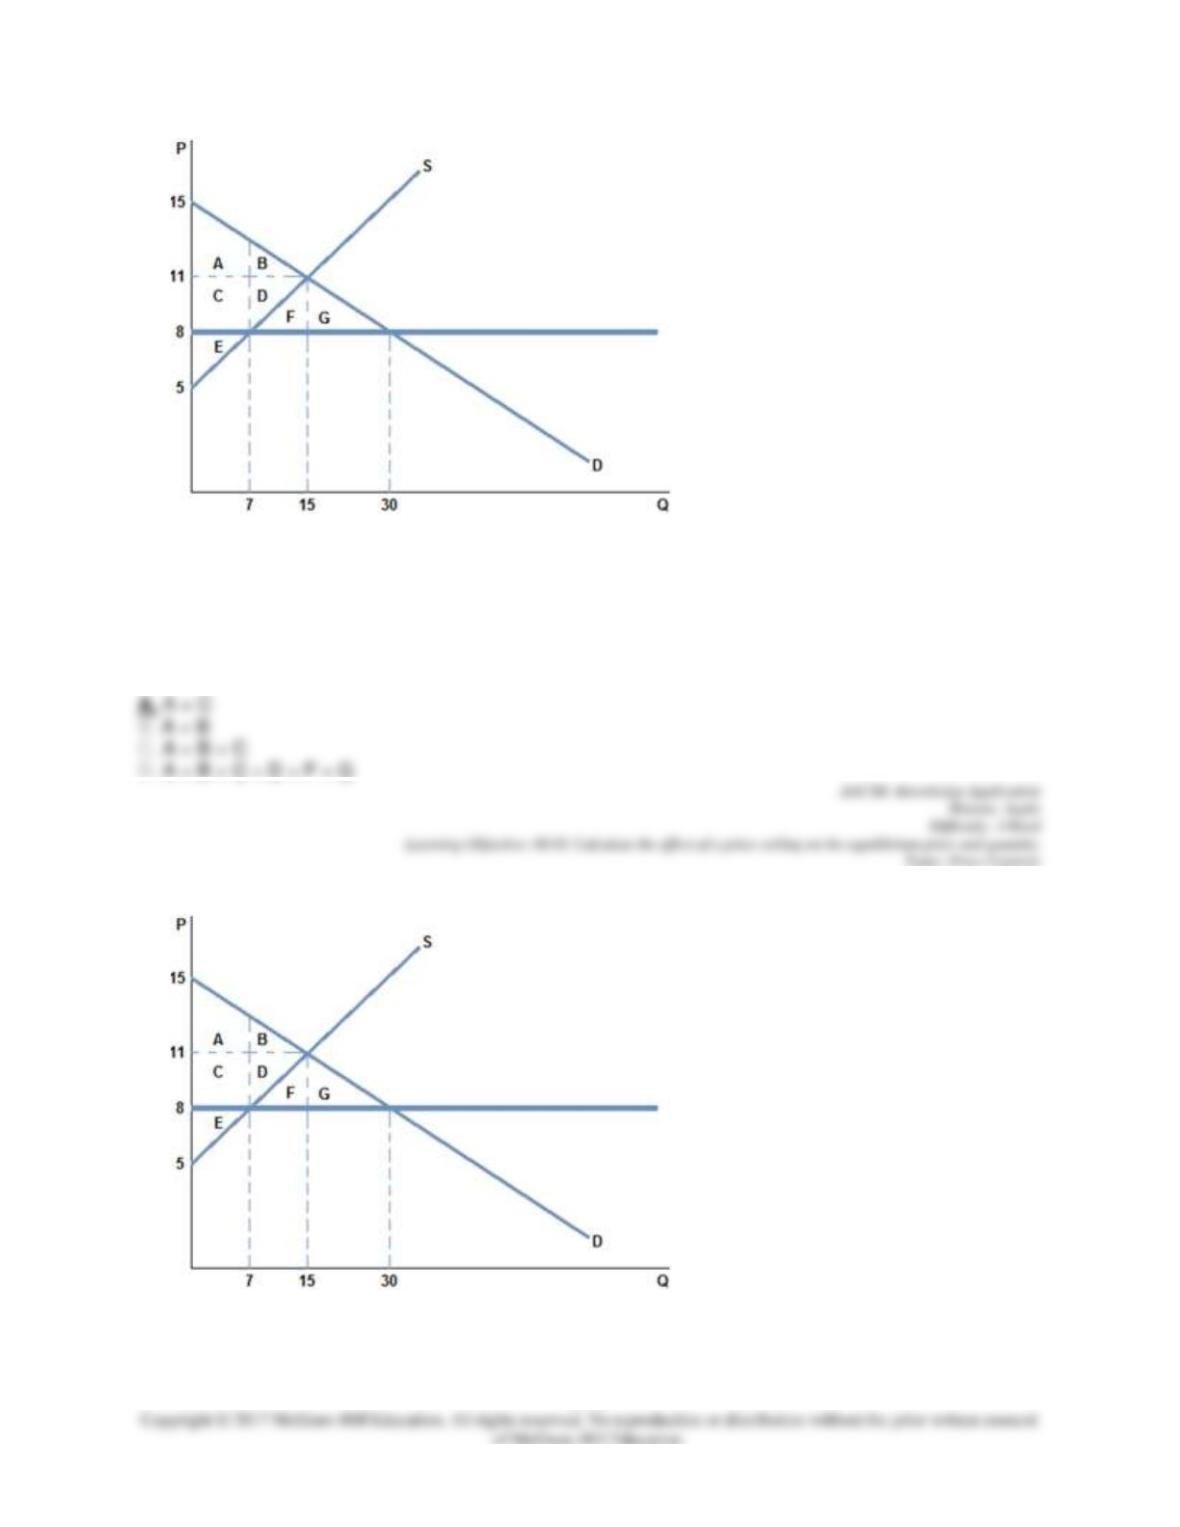
6-11
35.
After a price ceiling of $8 is placed on the market in the graph shown, which area represents consumer
surplus?
36.
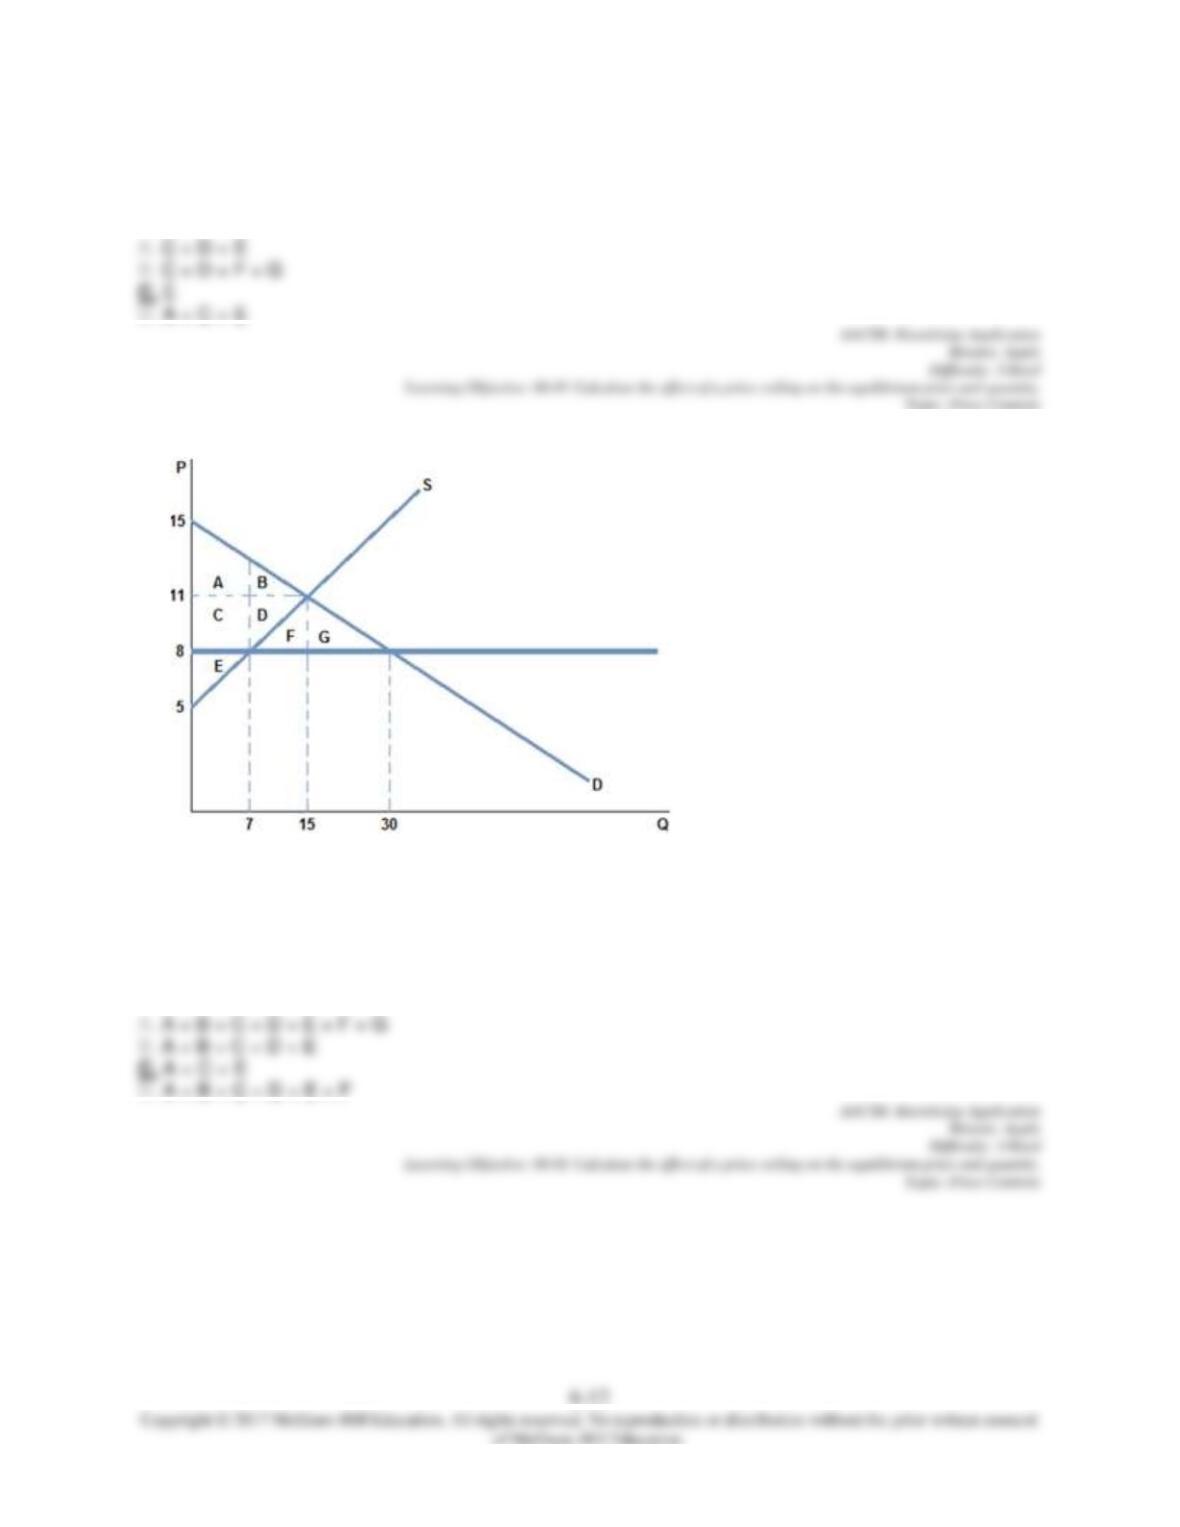
After a price ceiling of $8 is placed on the market in the graph shown, which area represents producer
surplus?
37.
After a price ceiling of $8 is placed on the market in the graph shown, which area represents total
surplus?
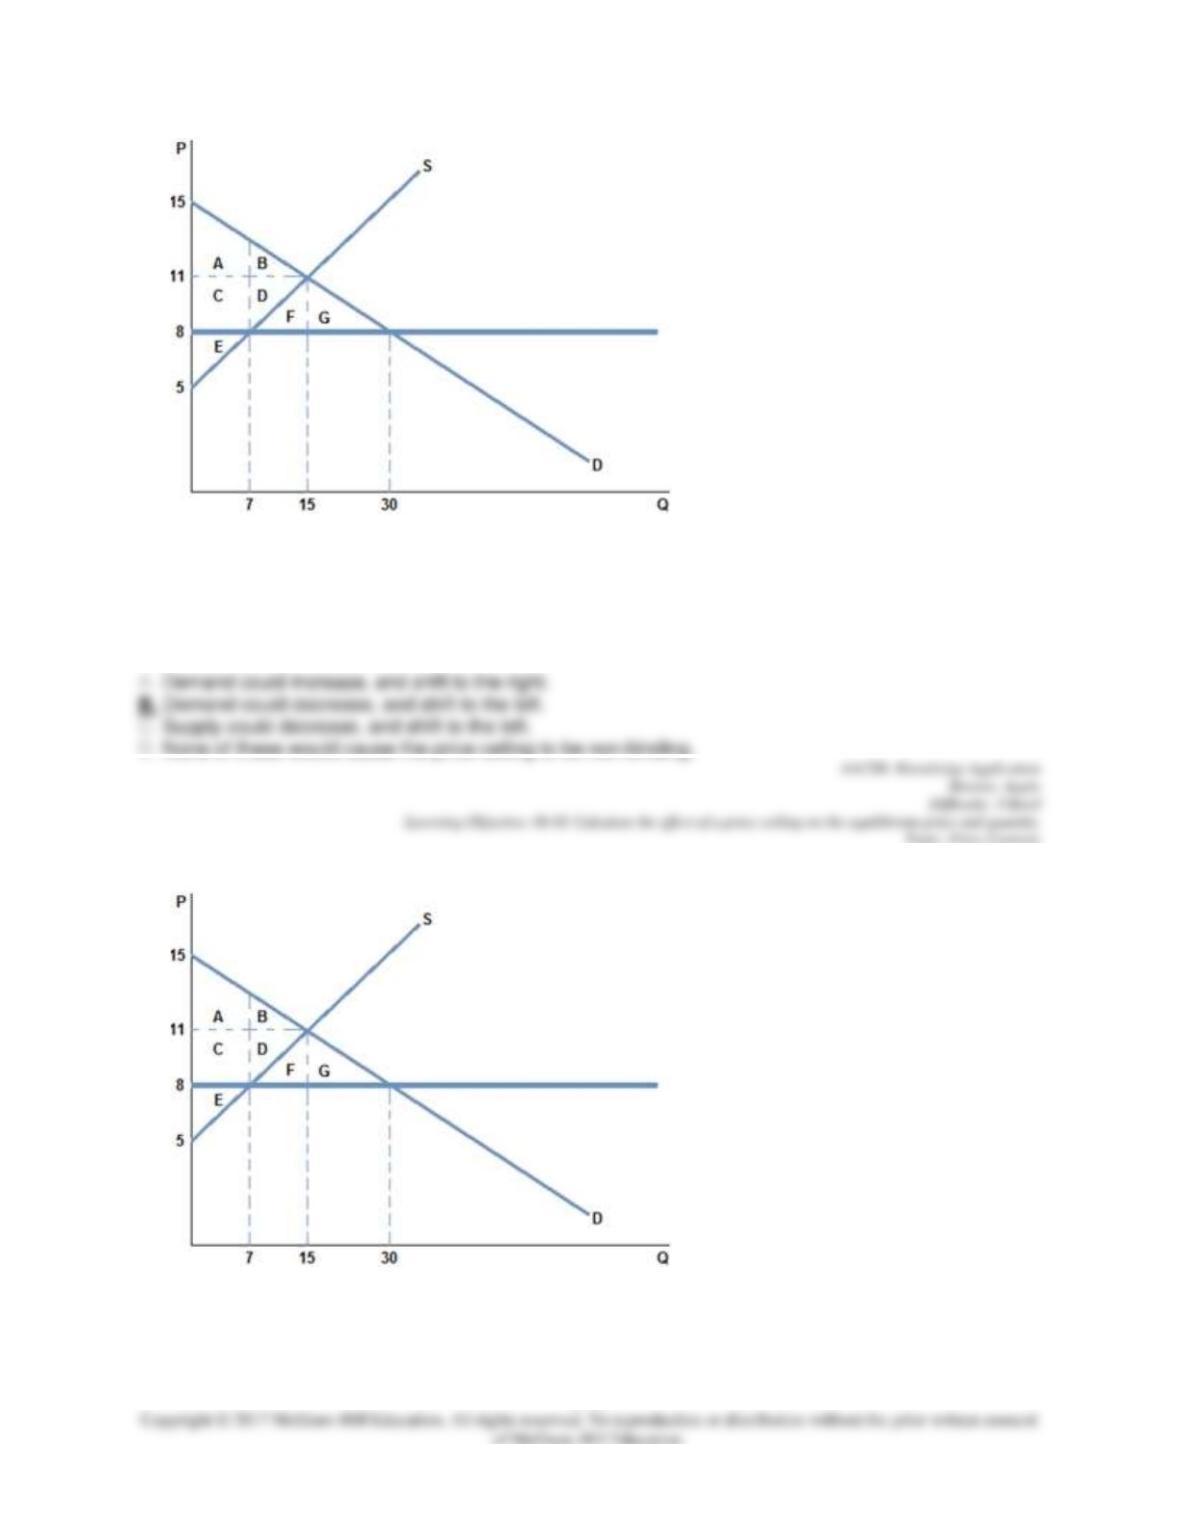
6-13
38.
What could happen to render the price ceiling set in the graph shown non-binding?
39.
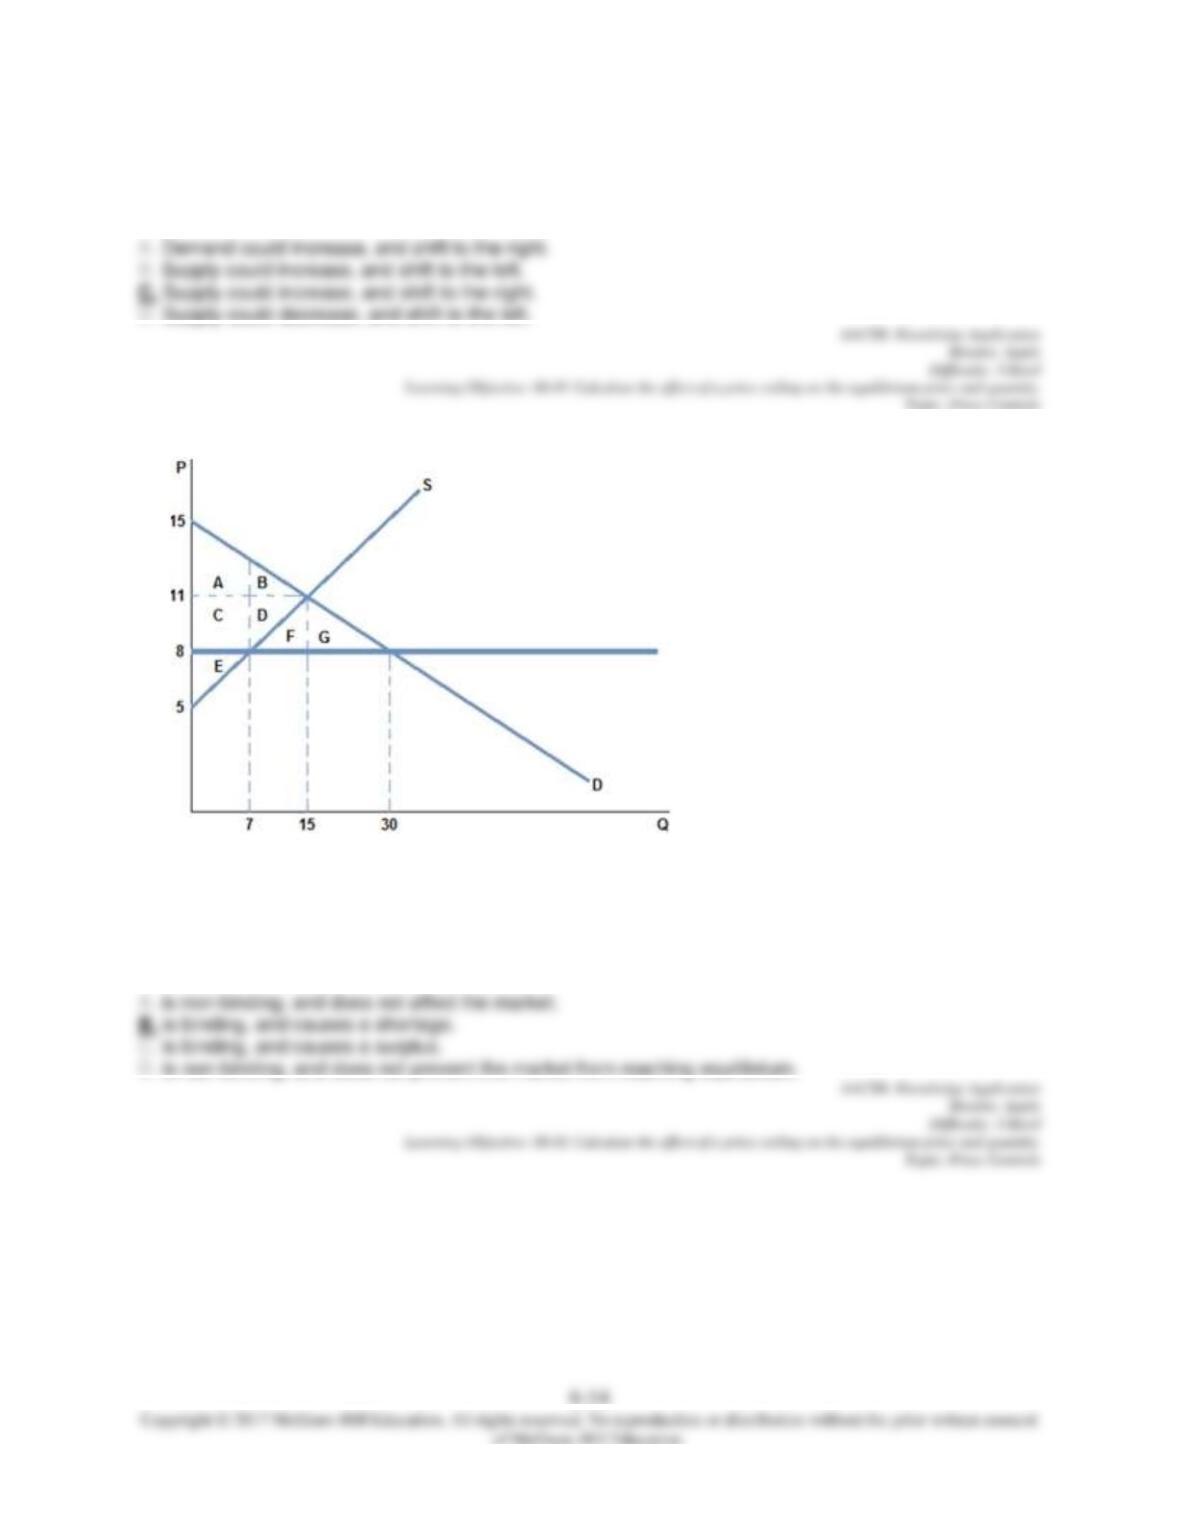
Which of the following changes to the market in the graph shown could cause the price ceiling to become
non-binding?
40.
A price ceiling of $8 placed on the market in the graph shown:
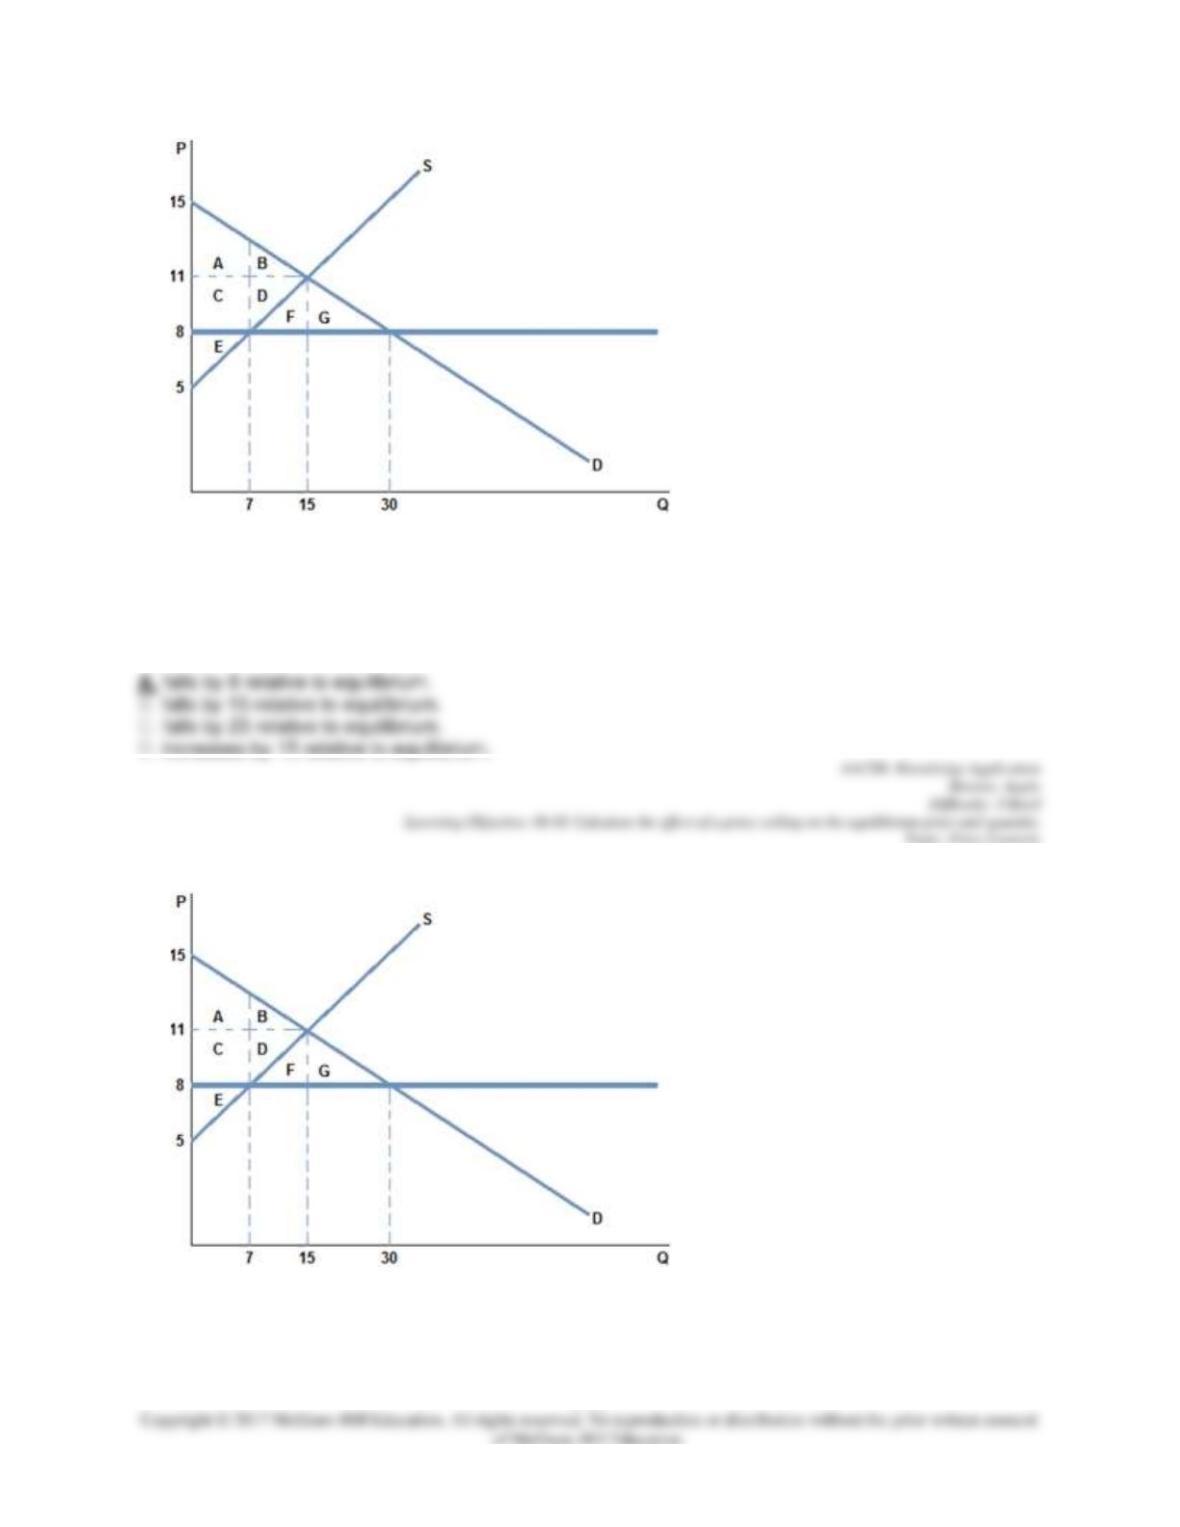
6-15
41.
After a price ceiling of $8 is placed on the market in the graph shown, the total number of units traded:
42.
According to the graph above, a price ceiling in this market would be non-binding if it were set at:
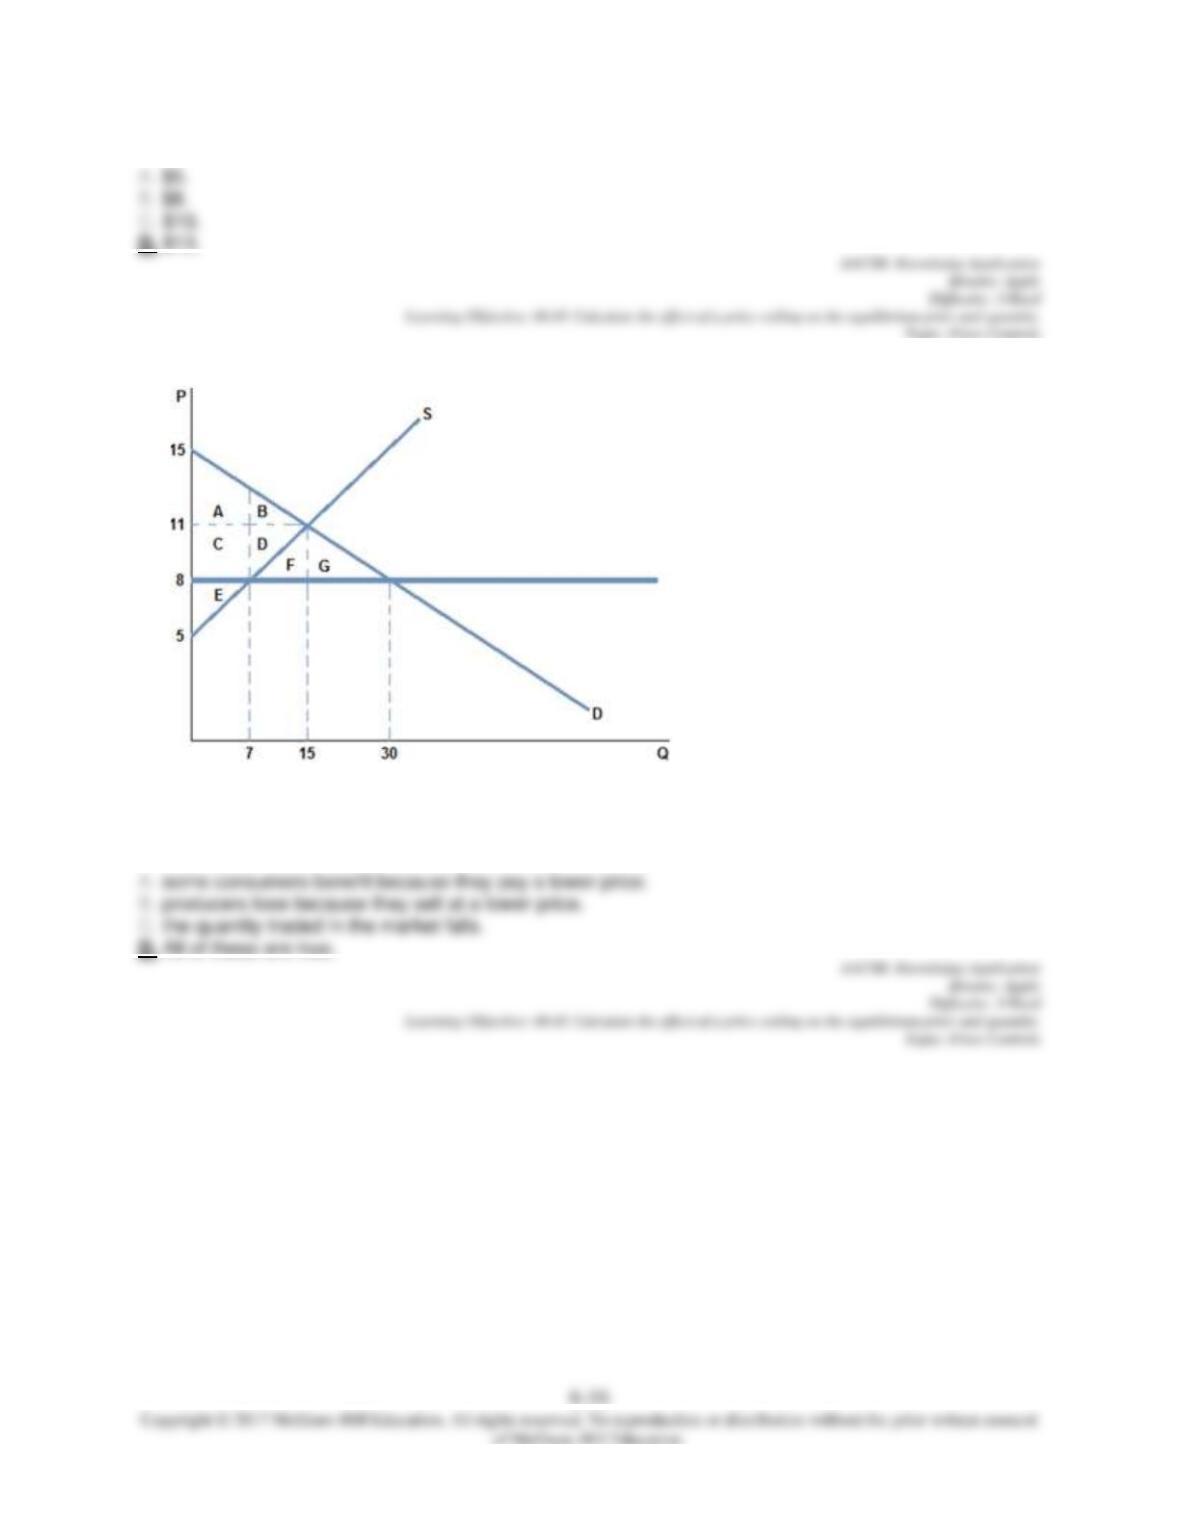
43.
After a price ceiling of $8 is placed on the market in the graph shown:
6-17
44.
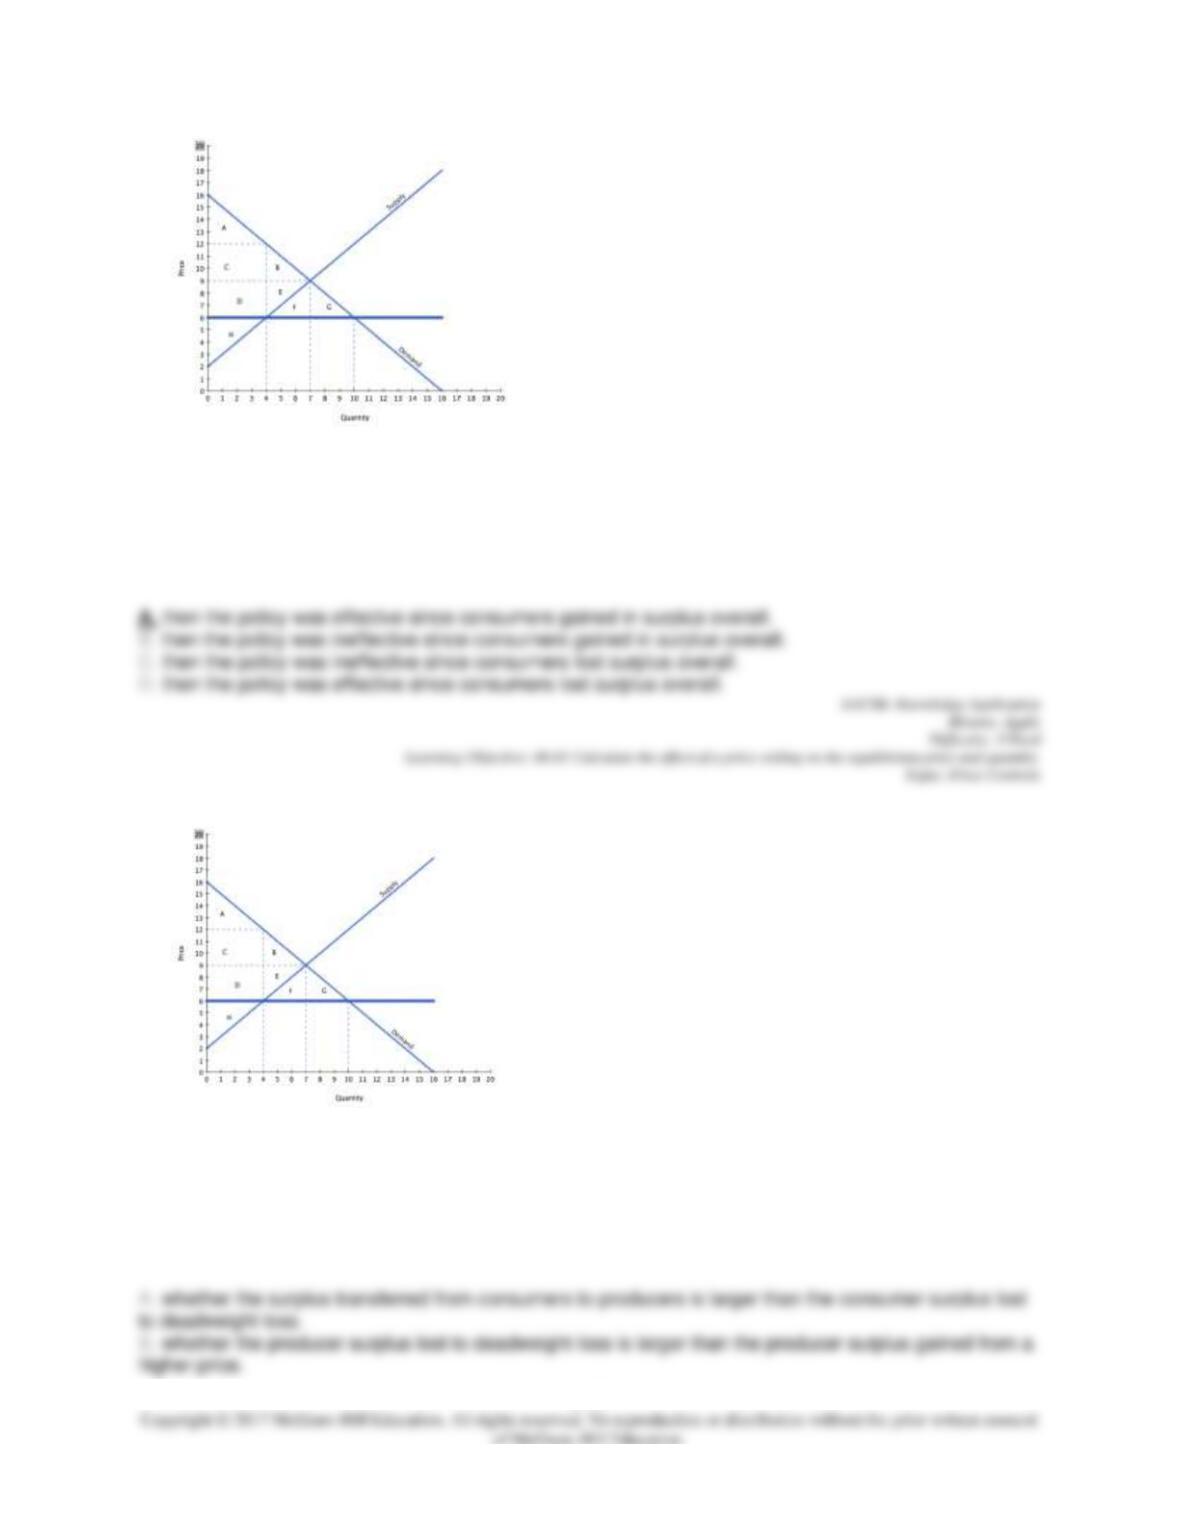
With reference to the graph above, if the intended aim of the price ceiling set at $6 was a net increase in
the well-being of consumers:
45.
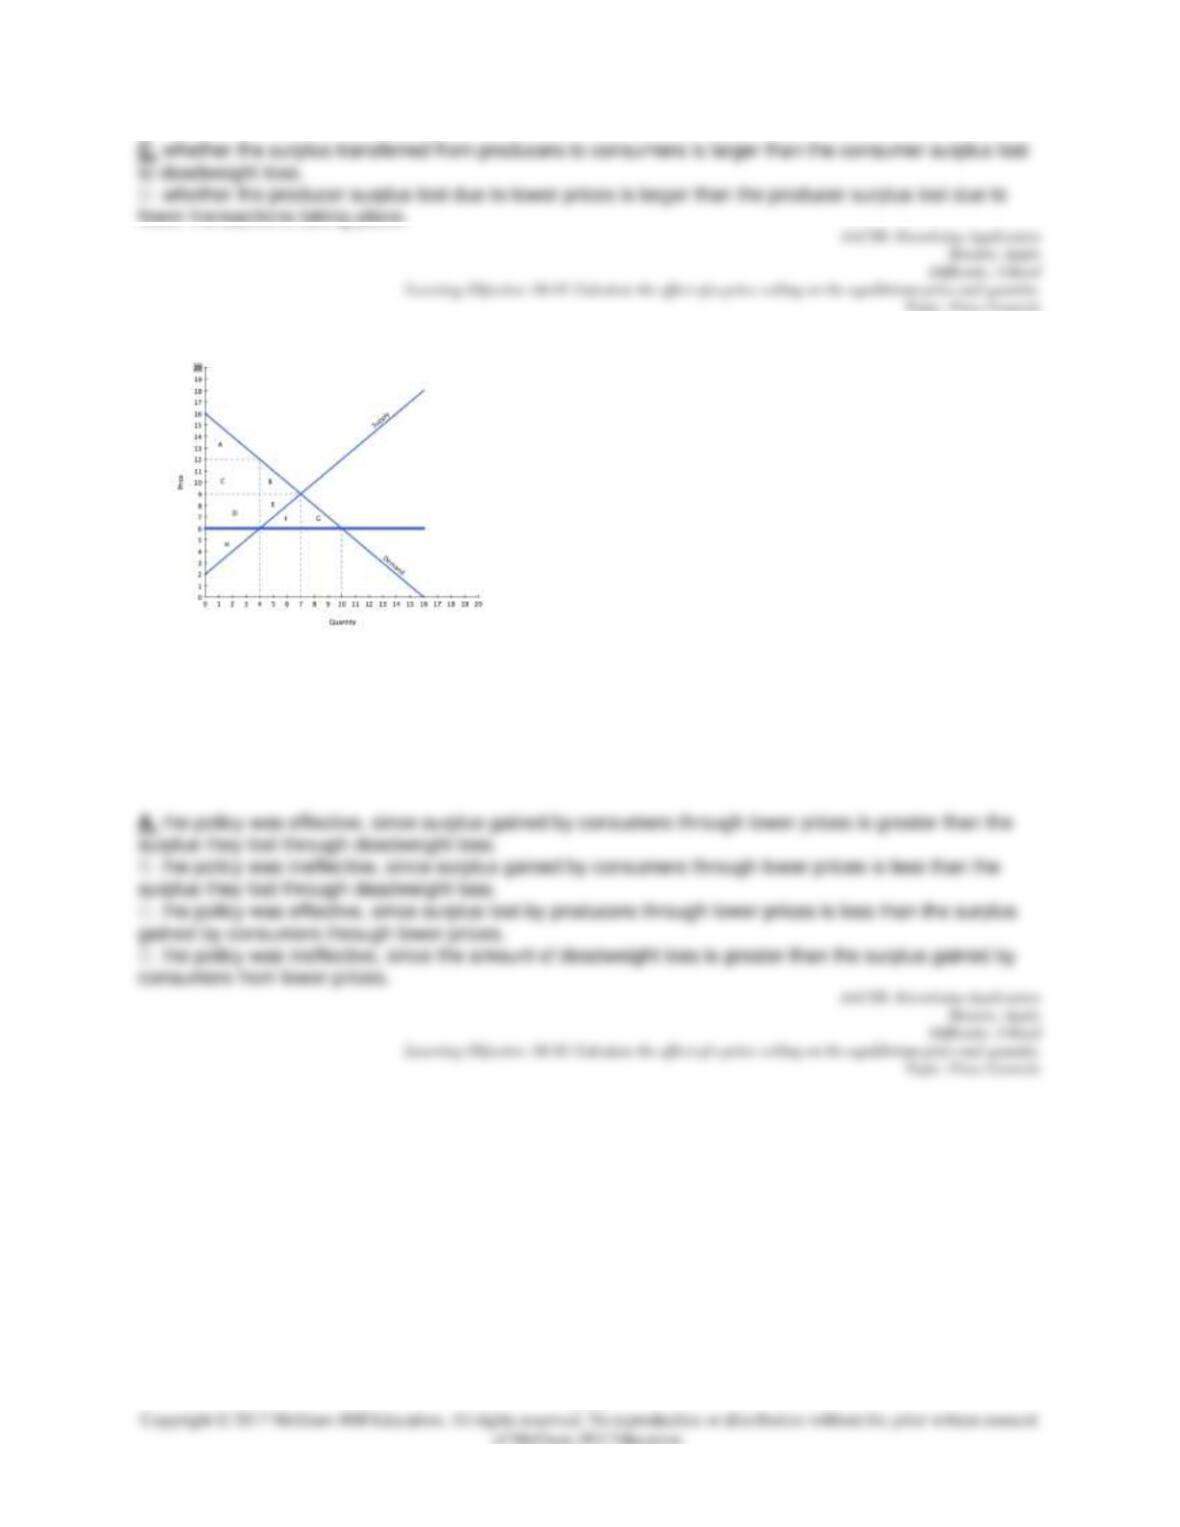
With reference to the graph above, if the intended aim of the price ceiling set at $6 was a net increase in
the well-being of consumers, then positive analysis would consider:
6-18
46.
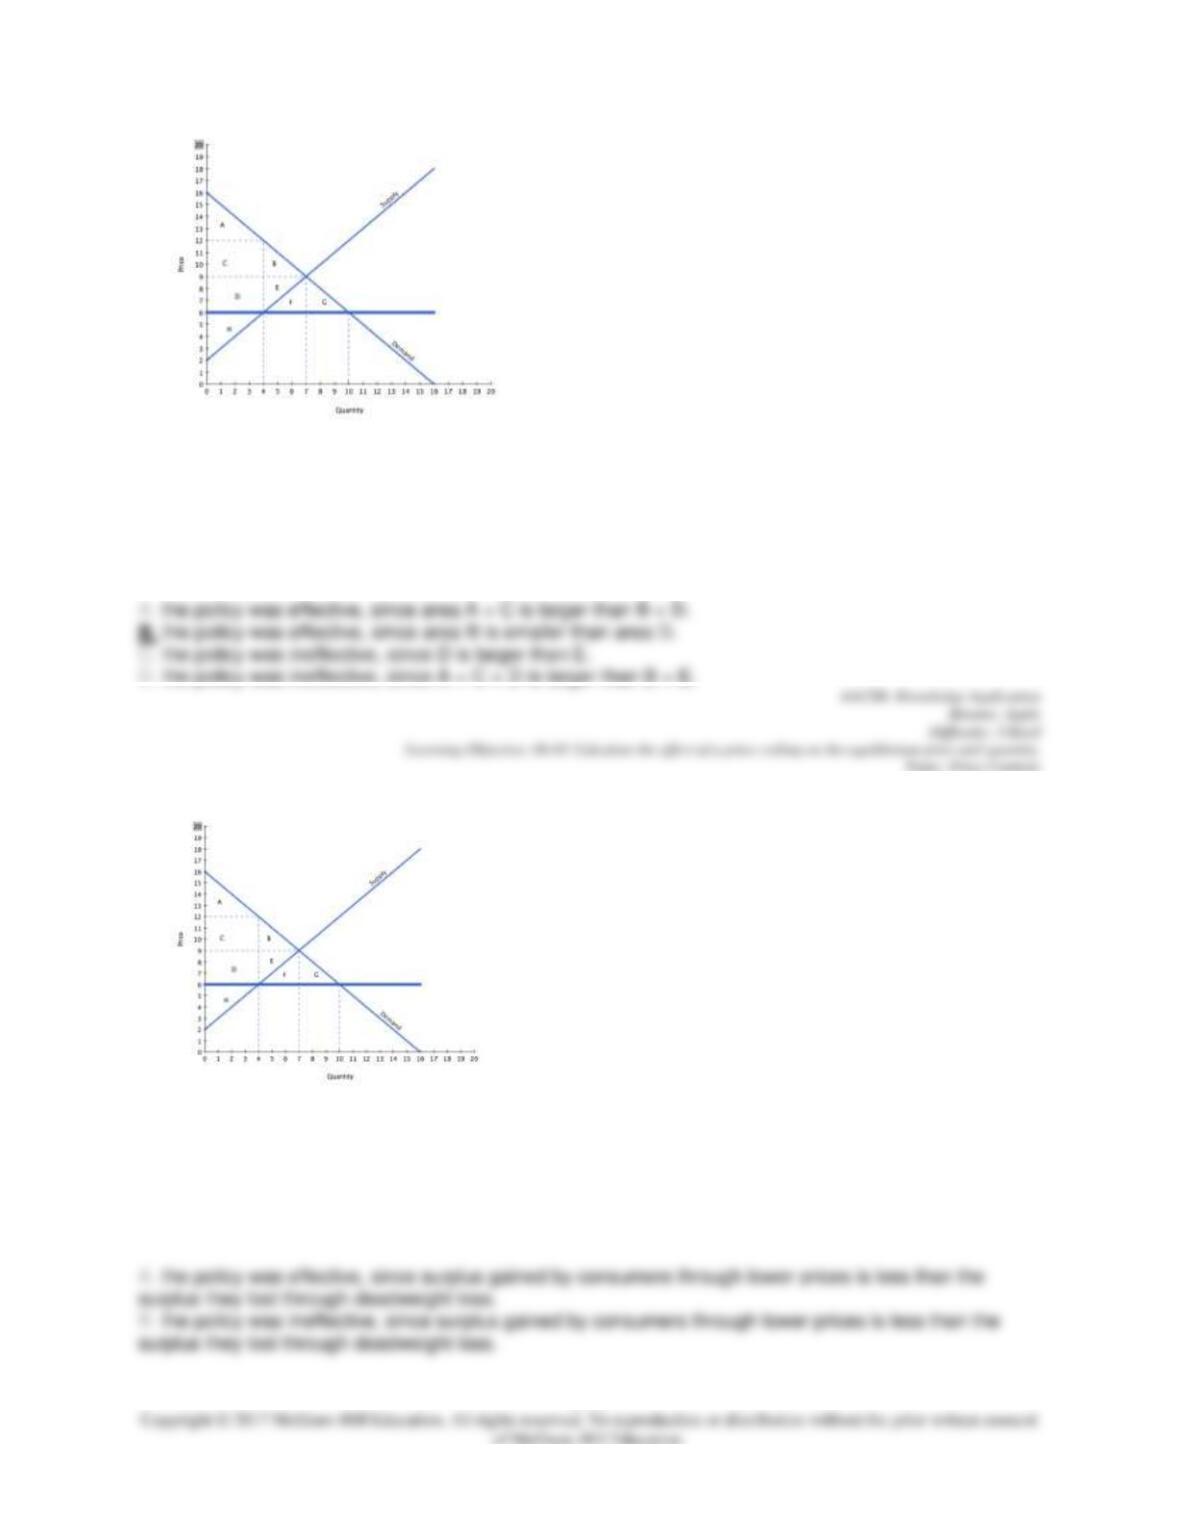
With reference to the graph above, if the intended aim of the price ceiling set at $6 was a net increase in
the well-being of consumers, then positive analysis would conclude:
6-19
47.
With reference to the graph above, if the intended aim of the price ceiling shown was a net increase in the
well-being of consumers, then positive analysis would conclude:
48.
With reference to the graph above, if the intended aim of the price ceiling set at $6 was a net increase in
the well-being of consumers, then normative analysis would conclude that:
49.
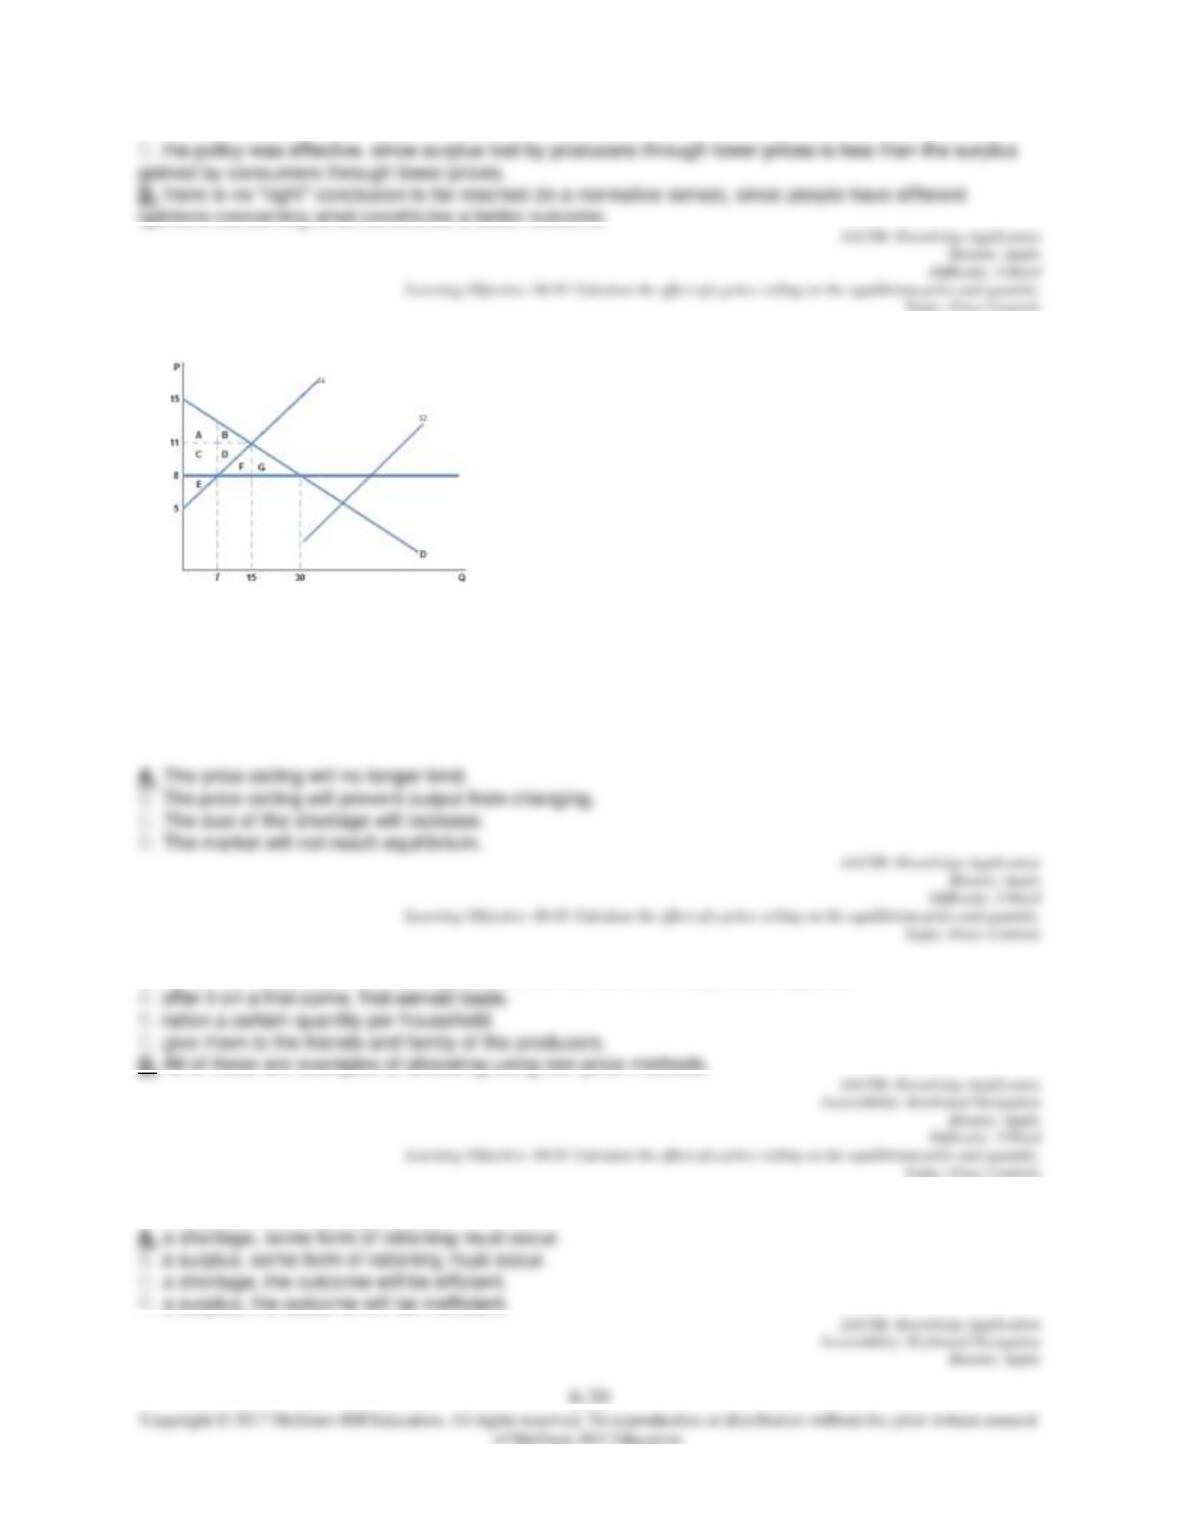
Suppose the market supply is initially at S1 and a price ceiling is set at 8. If supply shifts from S1 to S2,
then
50. One way to allocate the scarce good created from an effective price ceiling is to:
51. Because a price ceiling causes: