26) Explain the relationship between real GDP and potential GDP and between the
unemployment rate and the natural unemployment rate as the economy moves through a business
cycle.
27) What is the relationship over the business cycle of potential GDP and real GDP?
28) What are the three stages of constructing the CPI?
29) “The market basket used to calculate the CPI is revised monthly to more accurately depict
consumers’ choices. The price data for the CPI are collected every month.” Are the previous
sentences true or false?
30) Assume that after you graduate, you move to a simple economy in which only three goods
are produced and consumed: fish, fruit, and meat. Suppose that on January 1, fish sold for $2.50
per pound, meat was $3.00 per pound, and fruit was $1.50 per pound. At the end of the year, you
discover that the catch was low and that fish prices had increased to $5.00 per pound, but fruit
prices stayed at $1.50 per pound, and meat prices had actually fallen to $2.00. Can you say what
happened to the overall CPI, in terms of whether it increased, decreased, or stayed the same? Do
you have enough information to calculate the inflation rate? Note, this problem requires no
calculation; just state and explain your answers.
31) What is inflation and how is it measured using the Consumer Price Index?
32) List the four sources of bias in the CPI and briefly explain them.
33) Is the CPI a biased measure of the inflation rate? Explain your answer.
34) “The new goods bias puts a downward bias into the CPI and its measure of the inflation
rate.” Is the previous sentence correct or not? Explain your answer.
35) What is the commodity substitution bias? What effect does it have on the CPI?
36) “The bias in the CPI distorts private contracts because a future payment that is linked to the
CPI will be raised above the true increase in the price level.” Is the previous sentence true or
false?
37) Explain the CPI bias and how it can distort private contracts and increase government
outlays.
38) What, if any, is the impact of the CPI bias on government spending?
39) How is the GDP deflator is calculated.
6 Numeric and Graphing Questions
1) The unemployment rate is 6 percent. If the population is 300 million, and the number
unemployed is 6 million and the number employed is 94 million, what is the size of the labor
force?
2) Suppose the current unemployment rate is 5 percent, the labor force is 400 million people, the
labor force participation rate is 80 percent and the working-age population is 500 million people.
What number of people are unemployed?
3) Suppose that the U.S. population is 275 million. Also assume that the labor force is 135
million and that 130 million people are employed. Calculate the unemployment rate.
4) Suppose the population is 220 million people, the labor force is 150 million people, the
number of people employed is 130 million and the working-age population is 175 million
people. What is the unemployment rate?
5) Suppose the working-age population is 150 million, the labor force is 125 million, and
employment is 120 million.
a) What is the unemployment rate?
b) Now suppose that 2 million students graduate from college and begin to look for jobs. What
is the new unemployment rate if none of the students have found jobs yet?
c) Suppose that all 2 million students find jobs. What is the unemployment rate now?
6) Suppose there are 180 million employed people and 20 million unemployed people.
a) What is the unemployment rate?
b) Suppose that 5 million unemployed people give up their search for jobs and become
discouraged workers. What is the new official unemployment rate?
7) Consider the following scenario. Initially the economy has 90 million people working, 10
million people unemployed, and 20 million people not in the labor force. Then prospects for the
economy improve. Five million people who previously were not in the labor force now join the
10 million previously unemployed in looking for work. For now, the economy remains with 90
million workers. What happens to the unemployment rate?
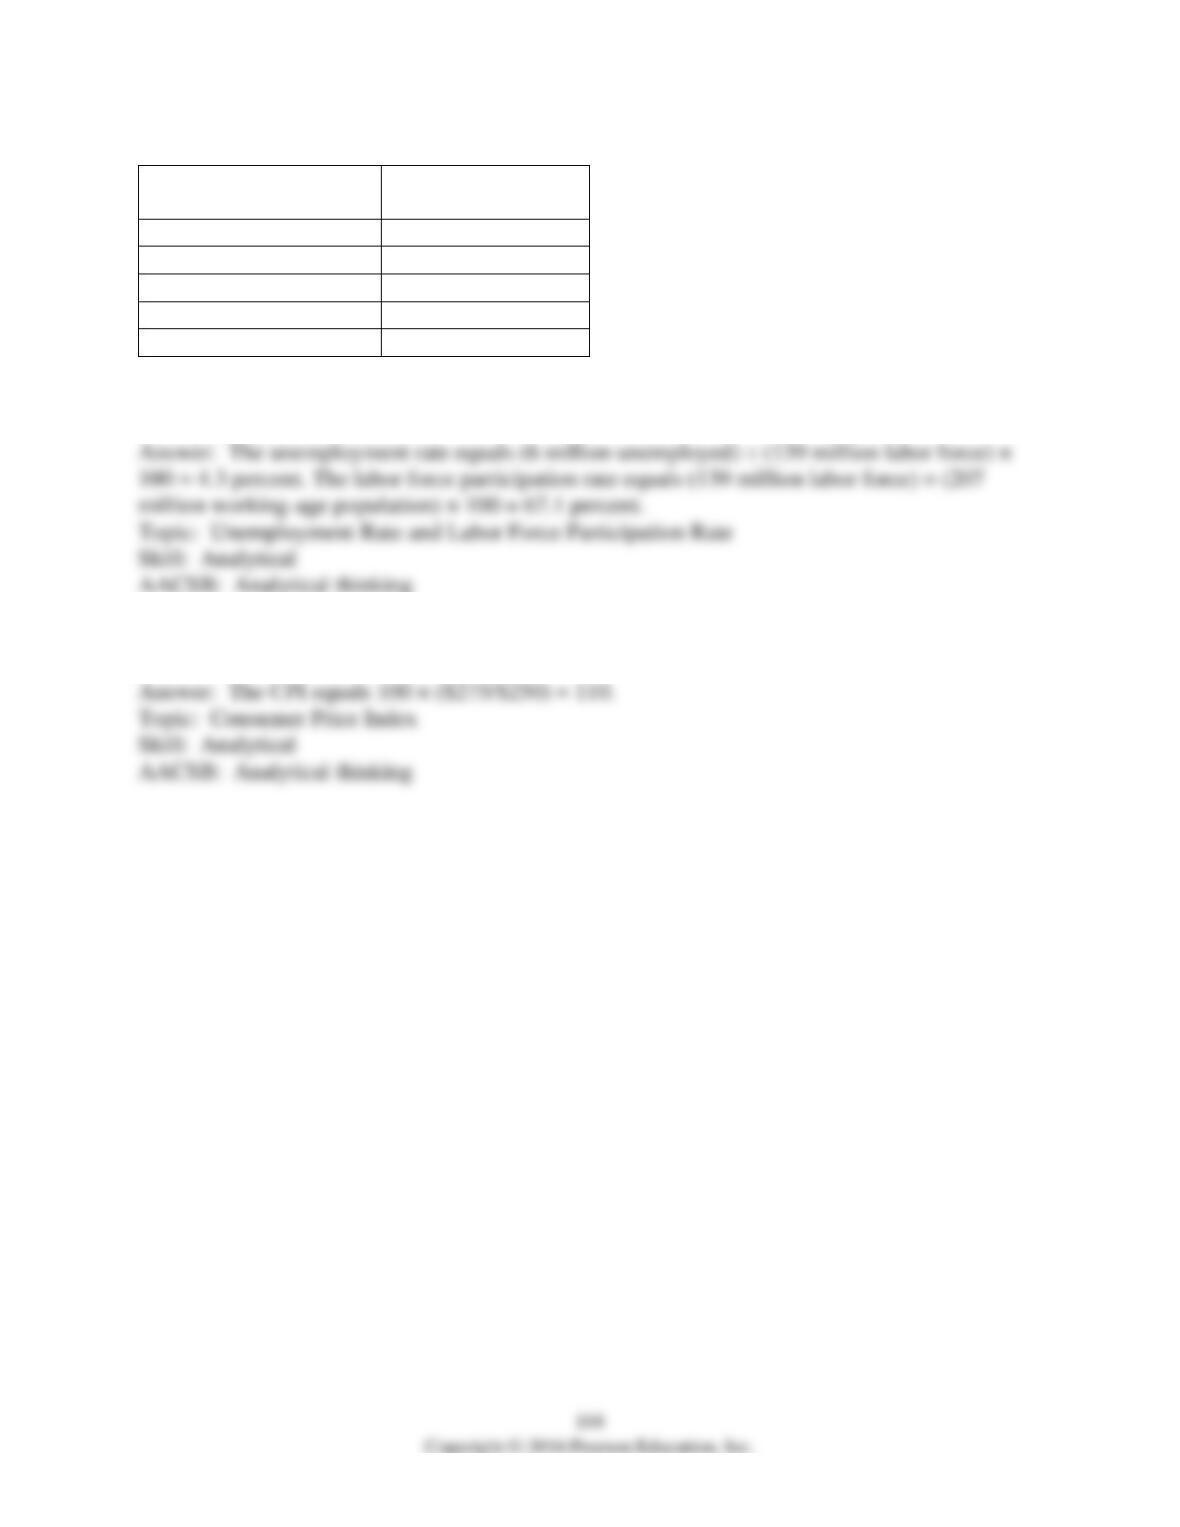
Category
Number of people
(millions)
Total population
246
Working-age population
207
Labor force
139
Employed
133
Unemployed
6
8) Based on the information in the above table, what is the unemployment rate? What is the labor
force participation rate?
9) If the base year CPI basket costs $250 and next year the CPI basket costs $275, what is next
year’s CPI?
Item
Quantity
(2015)
Price
(2015)
Loaves of bread
20
$3.00
Jugs of soda
20
$2.00
Item
Quantity
(2016)
Price
(2016)
Loaves of bread
22
$4.00
Jugs of soda
30
$1.50
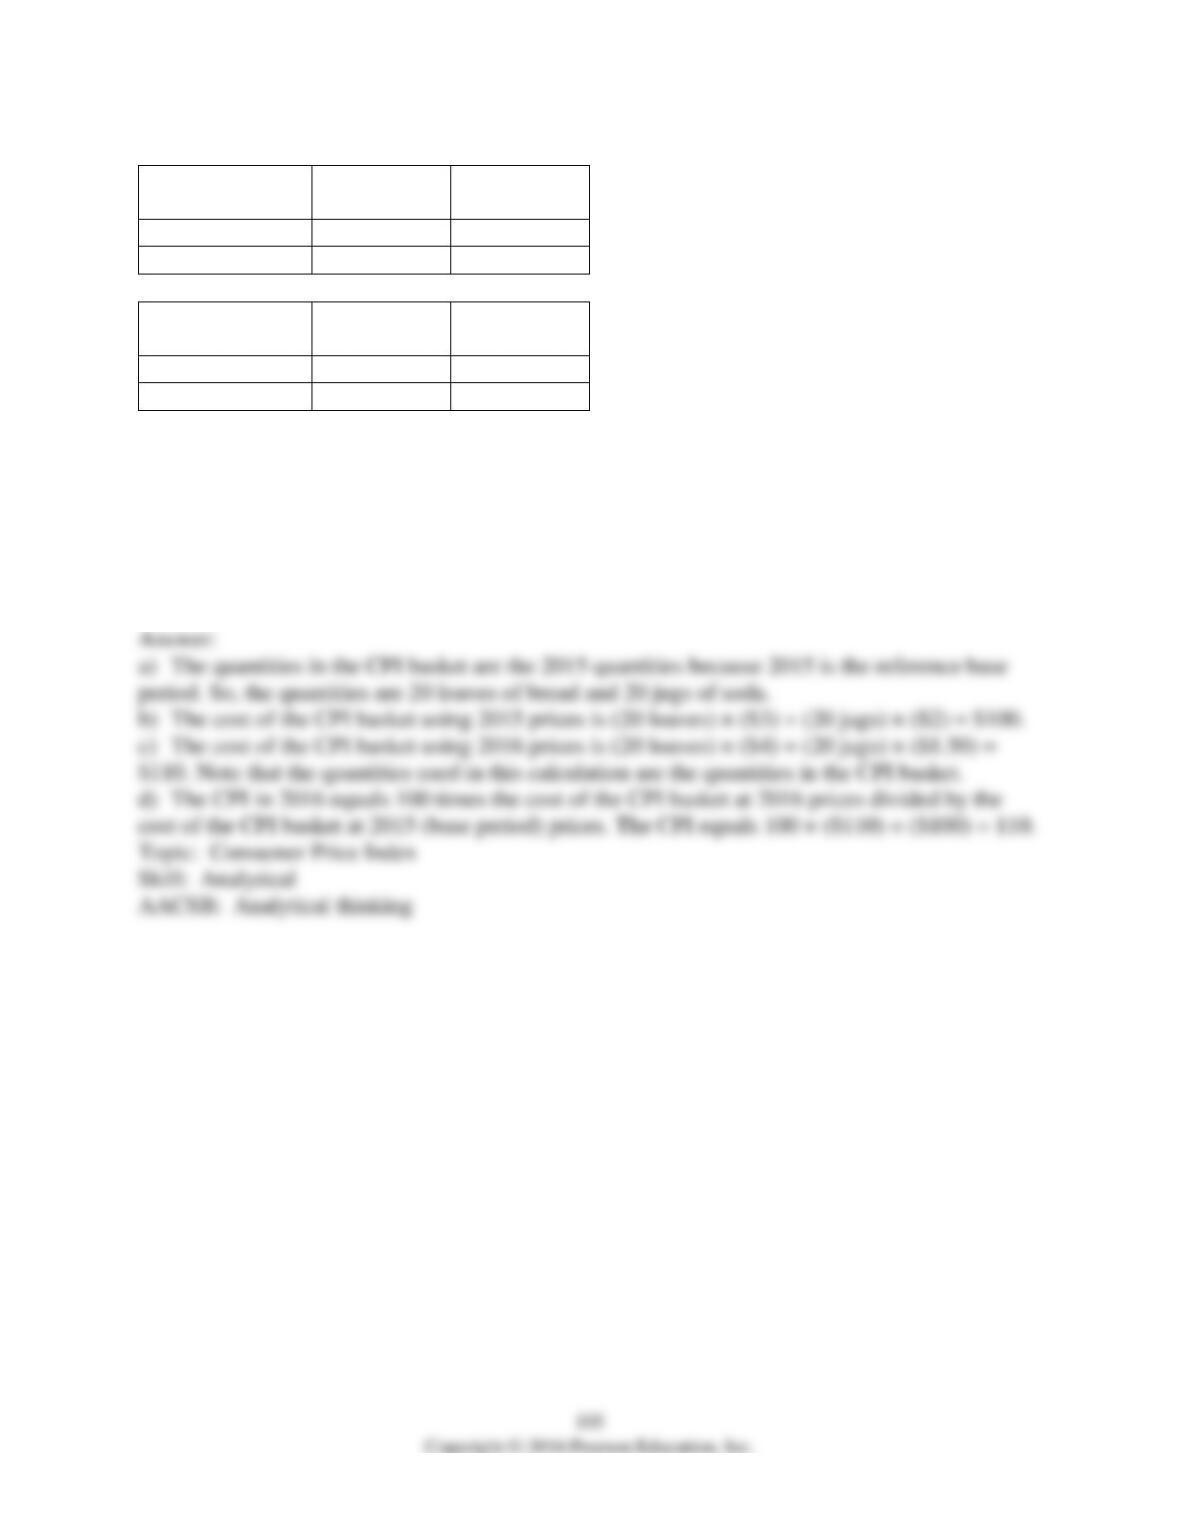
10) The tables above give the purchases of an average consumer in a small economy. (These
consumers purchase only loaves of bread and jugs of soda.) Suppose 2015 is the reference base
period.
a) What quantities are in the CPI basket?
b) What is the cost of the CPI basket using 2015 prices?
c) What is the cost of the CPI basket using 2016 prices?
d) What is the CPI in 2016?
Item
Quantity
(2015)
Price
(2015)
Shampoo
25
$2.35
Pizza
15
$7.50
Item
Quantity
(2016)
Price
(2016)
Shampoo
25
$2.50
Pizza
15
$7.75
11) The tables above give the purchases of an average consumer in a small economy. (These
consumers purchase only shampoo and pizza.) Suppose 2015 is the reference base period.
a) What is the cost of the CPI basket in 2015 and 2016?
b) What is the CPI in 2015 and in 2016?
c) What is the inflation rate between 2015 and 2016?
Item
Quantity
(2015)
Price
(2015)
Meals
100
$10.00
Parking
50
$100.00
Item
Quantity
(2016)
Price
(2016)
Meals
100
$12.00
Parking
50
$97.50
12) The tables above give the purchases of a typical consumer in a country comprised of one
large city. These consumers purchase only restaurant meals and parking. The year 2015 is the
reference base period.
a) Find the total cost of the CPI basket for 2015 and 2016.
b) What is the CPI in 2012 and in 2016?
c) What is the inflation rate between 2015 and 2016?
Item
Quantity
(2015)
Price
(2015)
Price
(2016)
Oranges
50
$0.90
$0.75
Bananas
100
$0.50
$0.95
Chicken
200
$2.00
$2.50
Beef
100
$5.00
$4.80
Bread
300
$1.75
$2.00
13) The table above gives the CPI basket for 2015. Suppose that 2015 is the reference base
period.
a) What is the cost of the CPI basket in 2015?
b) What is the cost of the CPI basket in 2016?
c) What is the CPI for 2015?
d) What is the CPI for 2016?
14) If the CPI this year is 175.2 and next year the CPI is 176.1, what was the inflation rate over
the year?
15) Last year the CPI was 177.1 and this year the CPI is 180.9. What was the inflation rate
between these two years?
Year
CPI
1997
152.5
1998
157.0
1999
160.6
2000
163.1
2001
166.7
2002
172.3
16) The table above gives the U.S. CPI for six years. Calculate the inflation rates between 1997
to 1998, 1998 to 1999, 1999 to 2000, 2000 to 2001, and 2001 to 2002.
17) For each of the following values of nominal GDP and real GDP, calculate the GDP price
deflator.
a) Nominal GDP = $600; real GDP = $800.
b) Nominal GDP = $900; real GDP = $900.
c) Nominal GDP = $1,200; real GDP = $1,000
18) If nominal GDP is $230 for a period and real GDP is $200 for the same period, what is the
GDP deflator for this period?
1) The working-age population is divided between those people in the labor force and those
people unemployed.

2) One way to be considered unemployed is to be without a job and looking for work.
3) The labor force is the sum of the working-age population and the number of unemployed
people.
4) The unemployment rate equals [(the number of people unemployed)/(the population)] × 100.
5) The unemployment rate measures the percentage of the working-age population who can’t find
a job.
6) The unemployment rate measures the percentage of people in the labor force who can’t find a
job.
7) Unlike cyclical unemployment, both frictional and structural unemployment rise during
recessions and fall during expansions.
8) Frictional, structural and cyclical unemployment are three classifications of unemployment.
9) If a worker is temporarily laid off because the economy is in a recession, frictional
unemployment increases.
10) Structural unemployment usually lasts longer than frictional unemployment.
11) When the economy is at full employment the unemployment rate equals the natural
unemployment rate.
12) The absence of cyclical unemployment means the economy is at the natural unemployment
rate.
13) The natural unemployment rate increased significantly during the 1980s and the 1990s.
14) The CPI is the average price of all goods and services produced within the economy.
15) The commodity substitution bias is that consumers substitute high-quality goods for low-
quality goods.
8 Extended Problems
Category
Number (millions)
Working age population
222.0
Labor force
146.8
Employment
138.0
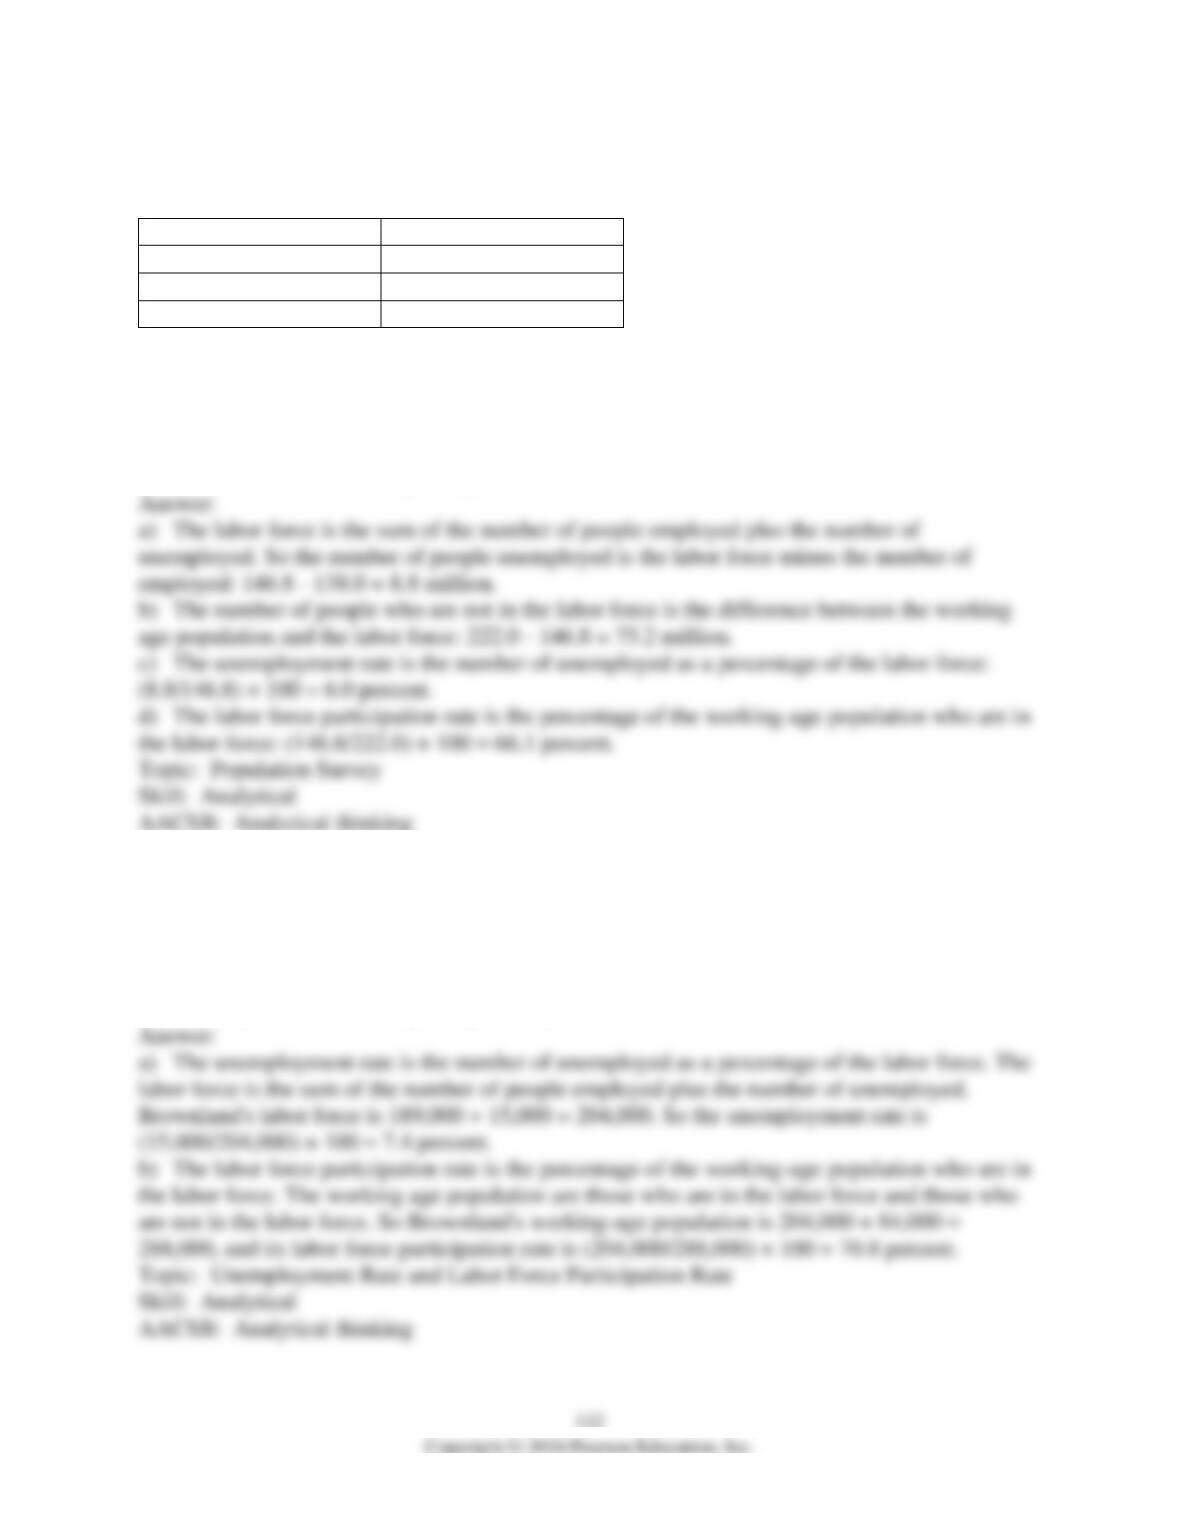
1) The Bureau of Labor Statistics reported the data in the table above for October 2003.
a) Calculate the number of people unemployed.
b) Calculate the number of people who are not in the labor force
c) Calculate the unemployment rate.
d) Calculate the labor force participation rate.
2) A labor force survey in Brownland records the following data:
Employed: 189,000
Unemployed: 15,000
Not in the labor force: 84,000
a) Calculate the unemployment rate.
b) Calculate the labor force participation rate.
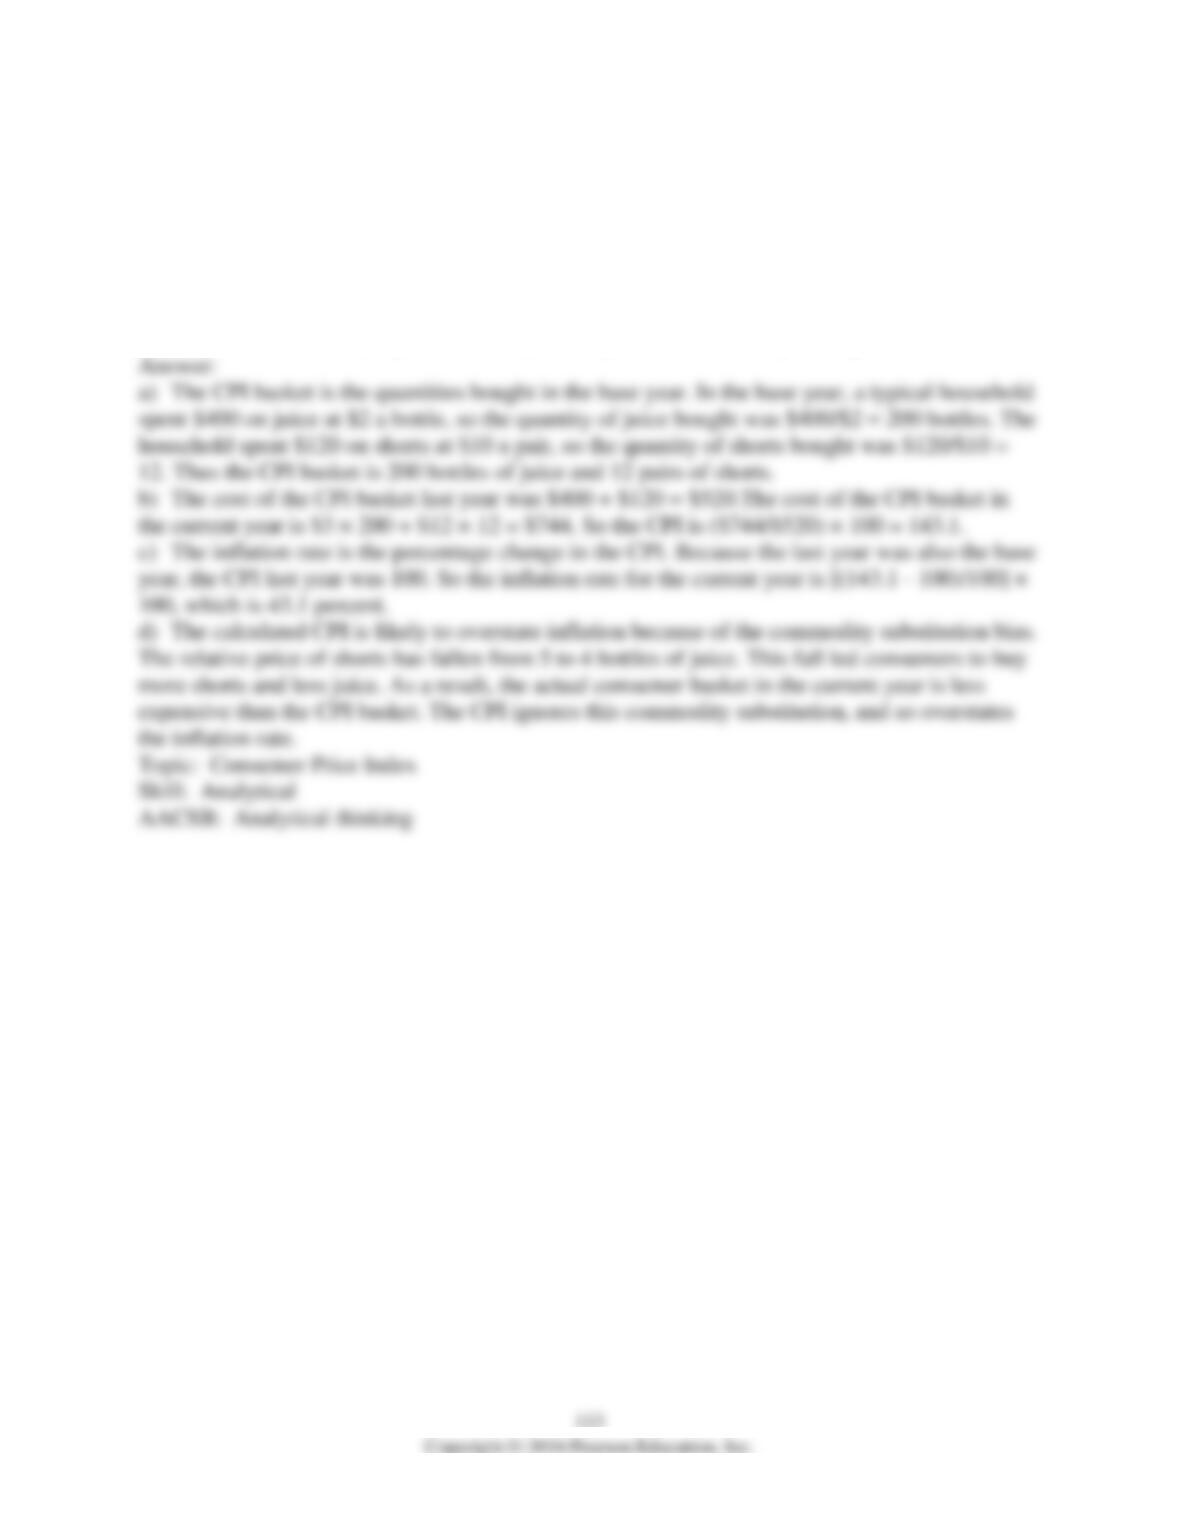
3) A typical household in Orangeland consumes only orange juice and shorts. Last year, which
was the base year, the household spent $400 on juice and $120 on shorts. In the base year, juice
was $2 a bottle and shorts were $10 a pair. This year, juice is $3 a bottle, shorts are $12 a pair,
and a typical household has bought 180 bottles of juice and 14 pairs of shorts.
a) What is the basket used in the CPI?
b) Calculate the CPI in the current year.
c) Calculate the inflation rate in the current year.
d) Is the inflation rate that you’ve calculated likely to be biased? Why or why not?