a.
D to C.
b.
B to D.
c.
C to B or A.
d.
D to A but not B.
DISC: Utility and consumer choic – DISC: Utility and consumer choice
United States – BPROG: Reflective Thinking – BPROG: Analysis
Utility and consumer choice
Appendix: The Slopes of Indifference Curves and Budget Lines
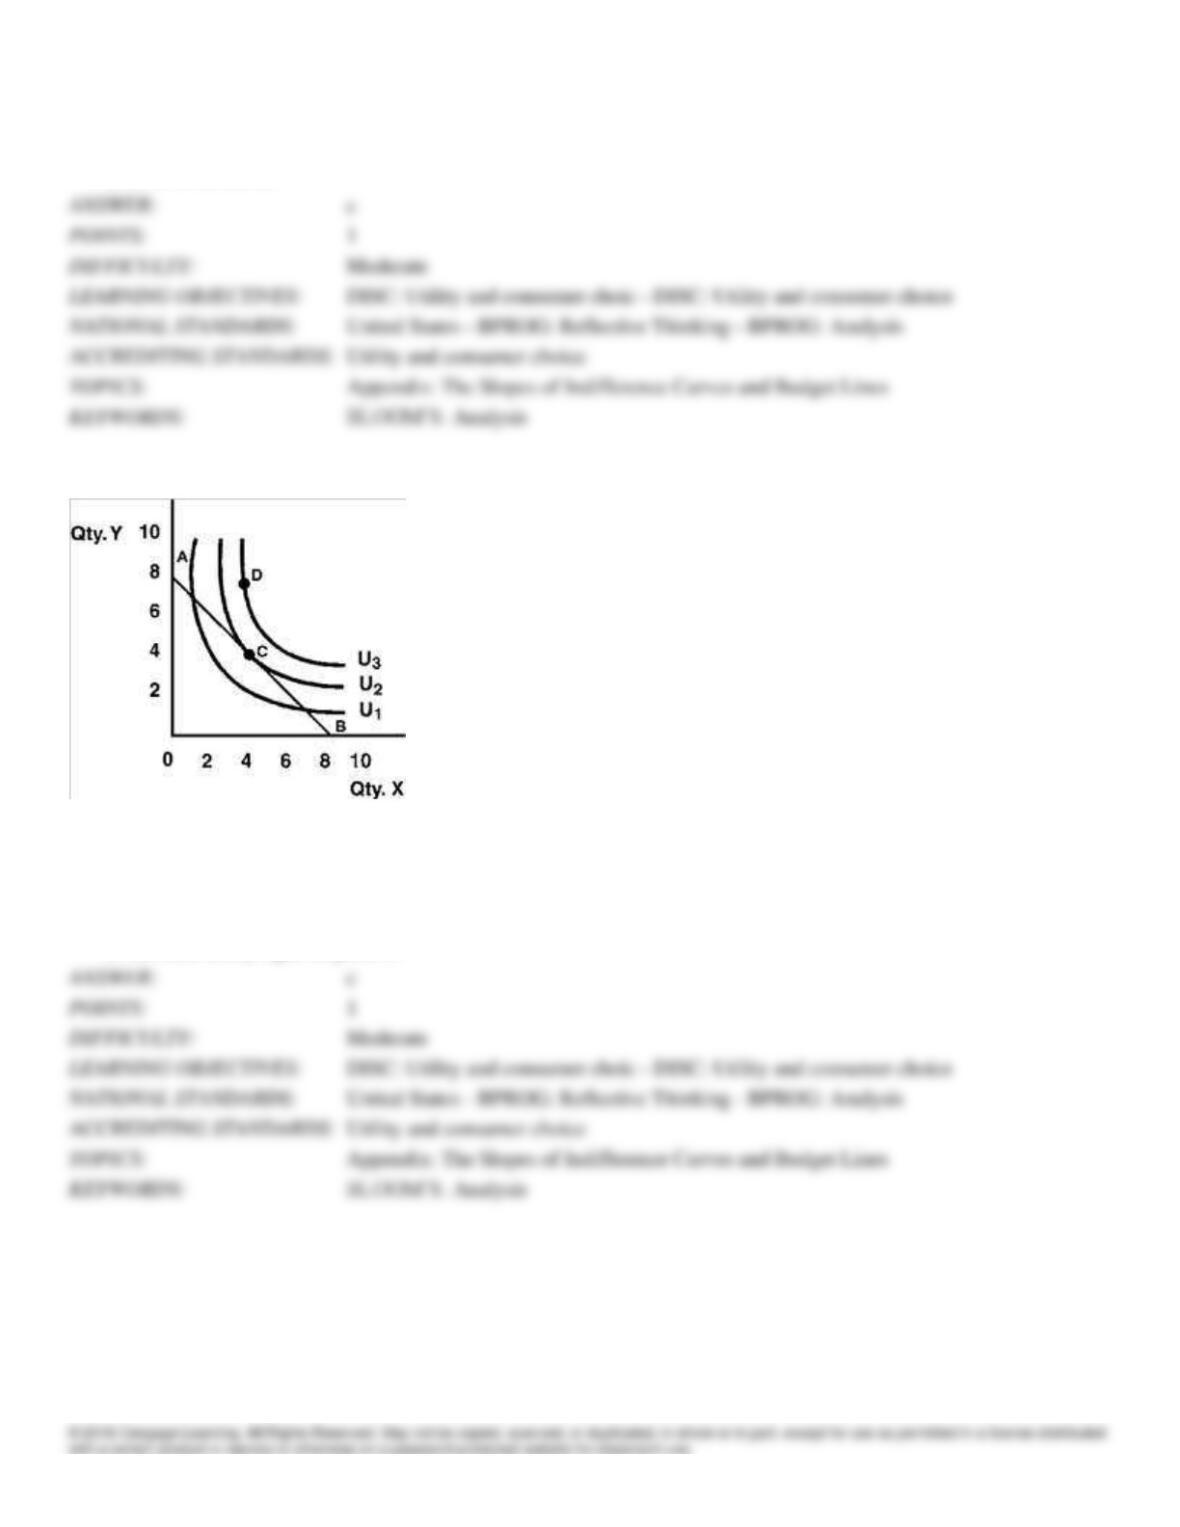
Figure 5-18
171. In Figure 5-18, point D for the consumer
a.
will be chosen because total utility is larger there than at point C.
b.
would not be chosen because it is less desirable than point C.
c.
is unattainable, given the consumer’s budget.
d.
has total utility equal to point C.
DISC: Utility and consumer choic – DISC: Utility and consumer choice
United States – BPROG: Reflective Thinking – BPROG: Analysis
Utility and consumer choice
Appendix: The Slopes of Indifference Curves and Budget Lines
Figure 5-19
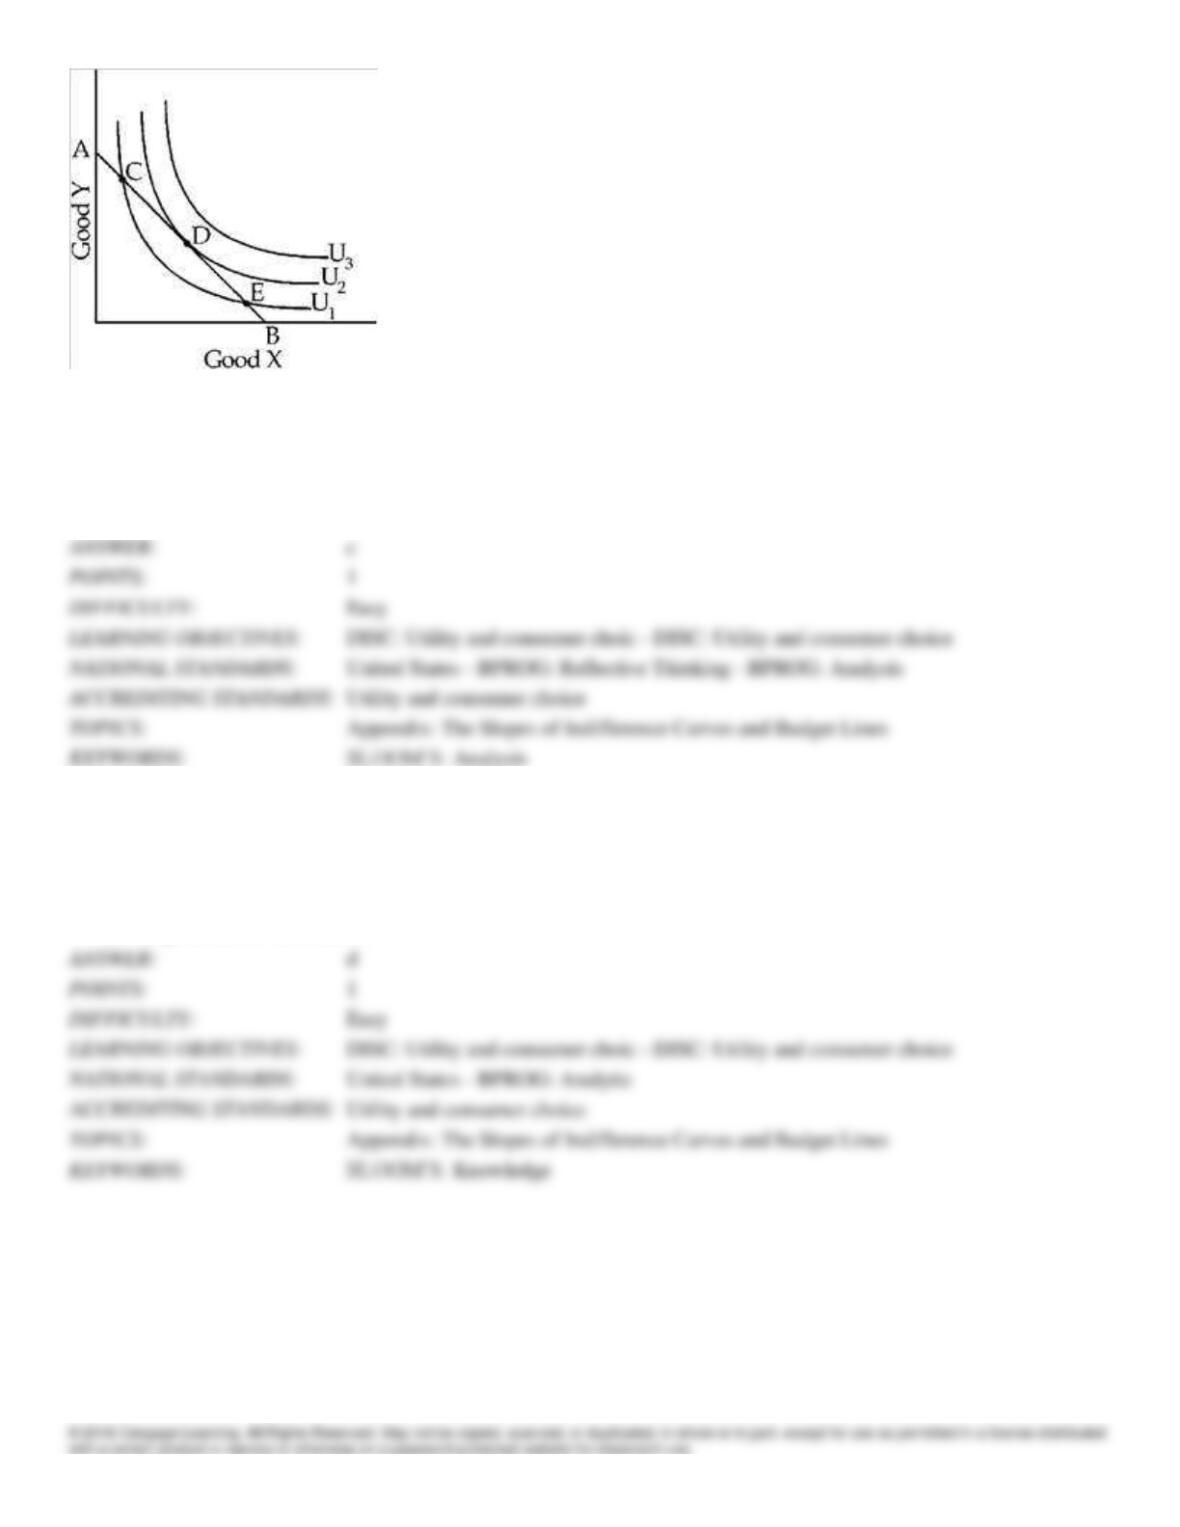
172. In Figure 5-19, the consumer experiences at point C
a.
greater total utility than at point D.
b.
greater total utility than at point E.
c.
less total utility than at point D.
d.
total utility equal to that experienced at point D.
DISC: Utility and consumer choic – DISC: Utility and consumer choice
United States – BPROG: Reflective Thinking – BPROG: Analysis
Utility and consumer choice
Appendix: The Slopes of Indifference Curves and Budget Lines
173. The slope of an indifference curve is called the
a.
bliss gradient.
b.
happiness slope.
c.
average transformation rate.
d.
marginal rate of substitution.
DISC: Utility and consumer choic – DISC: Utility and consumer choice
United States – BPROG: Analytic
Utility and consumer choice
Appendix: The Slopes of Indifference Curves and Budget Lines
Figure 5-7
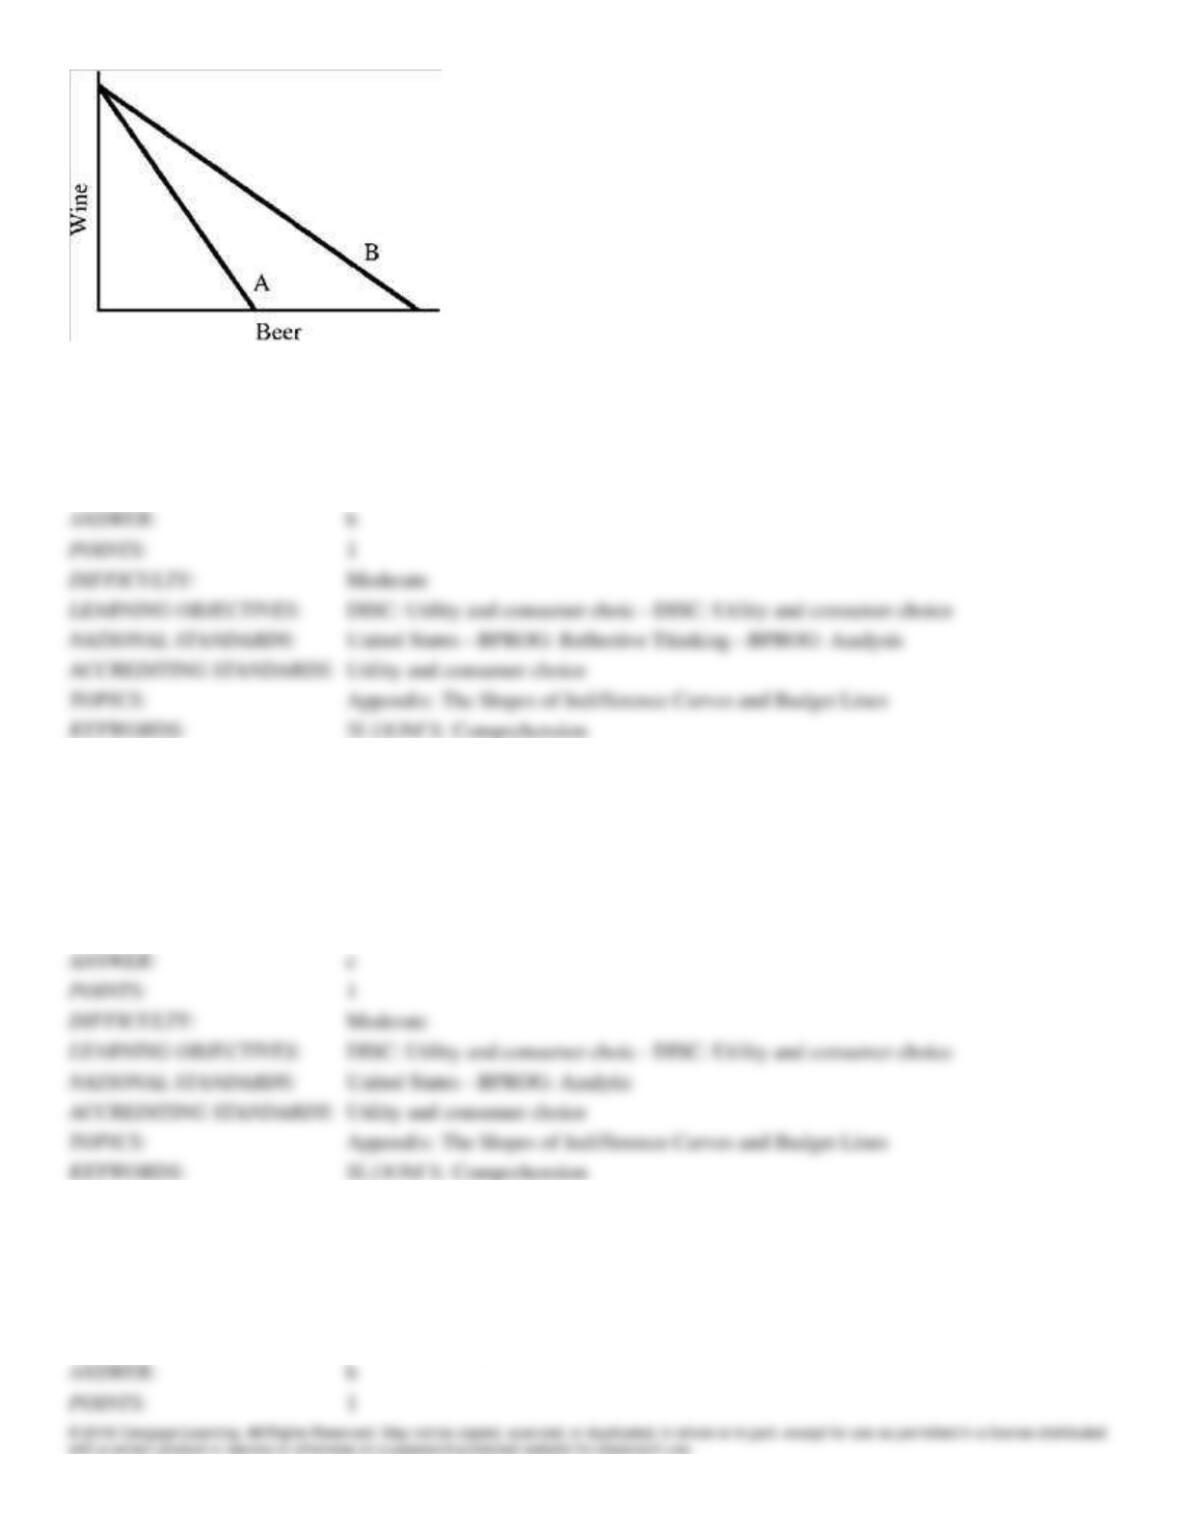
174. In Figure 5-7, budget line B compared to A clearly shows that the
a.
price of wine increased.
b.
price of beer decreased.
c.
price of beer increased.
d.
consumers’ money income increased.
DISC: Utility and consumer choic – DISC: Utility and consumer choice
United States – BPROG: Reflective Thinking – BPROG: Analysis
Utility and consumer choice
Appendix: The Slopes of Indifference Curves and Budget Lines
175. The slope of an indifference curve at all points reflects
a.
the terms by which the consumer can trade off goods in the market.
b.
the relative prices of the two goods.
c.
the willingness of the consumer to trade one good for another.
d.
consumer income relative to the price of a good.
e.
the relative price ratio of the two goods.
DISC: Utility and consumer choic – DISC: Utility and consumer choice
United States – BPROG: Analytic
Utility and consumer choice
Appendix: The Slopes of Indifference Curves and Budget Lines
176. If the prices of both goods increase by 10 percent, the budget line
a.
shifts to the right in parallel fashion.
b.
shifts to the left in parallel fashion.
c.
is unaffected since only relative price changes matter.
d.
pivots on the axis of the more expensive good.
DISC: Utility and consumer choic – DISC: Utility and consumer choice
United States – BPROG: Analytic
Utility and consumer choice
Appendix: The Slopes of Indifference Curves and Budget Lines
177. The slope of the budget line
a.
always equals 1.
b.
equals income divided by price.
c.
equals the ratio of the prices.
d.
decreases as we move from left to right.
DISC: Utility and consumer choic – DISC: Utility and consumer choice
United States – BPROG: Analytic
Utility and consumer choice
Appendix: The Slopes of Indifference Curves and Budget Lines
178. Possible causes of an upward-sloping demand curve are:
a.
consumers judge the quality of a product based on quality
b.
consumers judge the quality of a product based on price
c.
consumers purchase a product based on snob appeal
d.
a and b are true
e.
b and c are true
DISC: Utility and consumer choic – DISC: Utility and consumer choice
United States – BPROG: Analytic
Utility and consumer choice
From Individual Demand Curves to Market Demand Curves
179. If marginal utility is a positive number:
a.
the more you purchase, the more total utility you get
b.
the more you purchase, the less total utility you get
c.
utility is not affected by more purchases
d.
none of these is correct
DISC: Supply and demand
United States – BPROG: Analytic
Supply and demand
Utility: A Tool to Analyze Purchase Decisions
180. When using the terms “total utility” or “marginal utility” we assume:
a.
the consumer will exchange one commodity for another
b.
the consumer will part with money for the commodity
c.
the consumer has declined to purchase the commodity
d.
a and b are correct
Moderate
DISC: Utility and consumer choic – DISC: Utility and consumer choice
United States – BPROG: Analytic
Utility and consumer choice
Utility: A Tool to Analyze Purchase Decisions
Essay
181. Why is gold very expensive, even though it is not essential to life, while water, which is essential to life, is
inexpensive?
Easy
DISC: Utility and consumer choic – DISC: Utility and consumer choice
United States – BPROG: Analytic
Utility and consumer choice
Consumer Choice as a Trade-Off: Opportunity Cost
182. In Figure 5-1 from the text, if the price of pizzas is $8:
a.
how many pizzas will the consumer purchase?
b.
what is the payment for the optimal number of pizzas?
c.
how much consumer surplus will the consumer receive?
a.
The consumer will purchase 5 pizzas at a price of $8.
b.
The payment for 8 pizzas will be $40 ($8 per pizza multiplied by 5 pizzas).
Easy
DISC: Utility and consumer choic – DISC: Utility and consumer choice
United States – BPROG: Reflective Thinking – BPROG: Analysis
Utility and consumer choice
Utility: A Tool to Analyze Purchase Decisions
183. Define the following terms. Give a complete and precise definition in one sentence.
a.
total utility
b.
marginal utility
c.
consumer’s surplus
d.
“law” of demand
money the consumer is willing to pay for one more unit of the commodity.
requires the consumer to pay for that quantity of X.
1
Easy
DISC: Utility and consumer choic – DISC: Utility and consumer choice
United States – BPROG: Analytic
Utility and consumer choice
Utility: A Tool to Analyze Purchase Decisions
184. How do you calculate consumer’s surplus? What happens to consumer’s surplus when the price of a commodity
rises?
consumer surplus will be taken away by the supplier in the form of a higher price.
1
Easy
DISC: Utility and consumer choic – DISC: Utility and consumer choice
United States – BPROG: Analytic
Utility and consumer choice
Utility: A Tool to Analyze Purchase Decisions
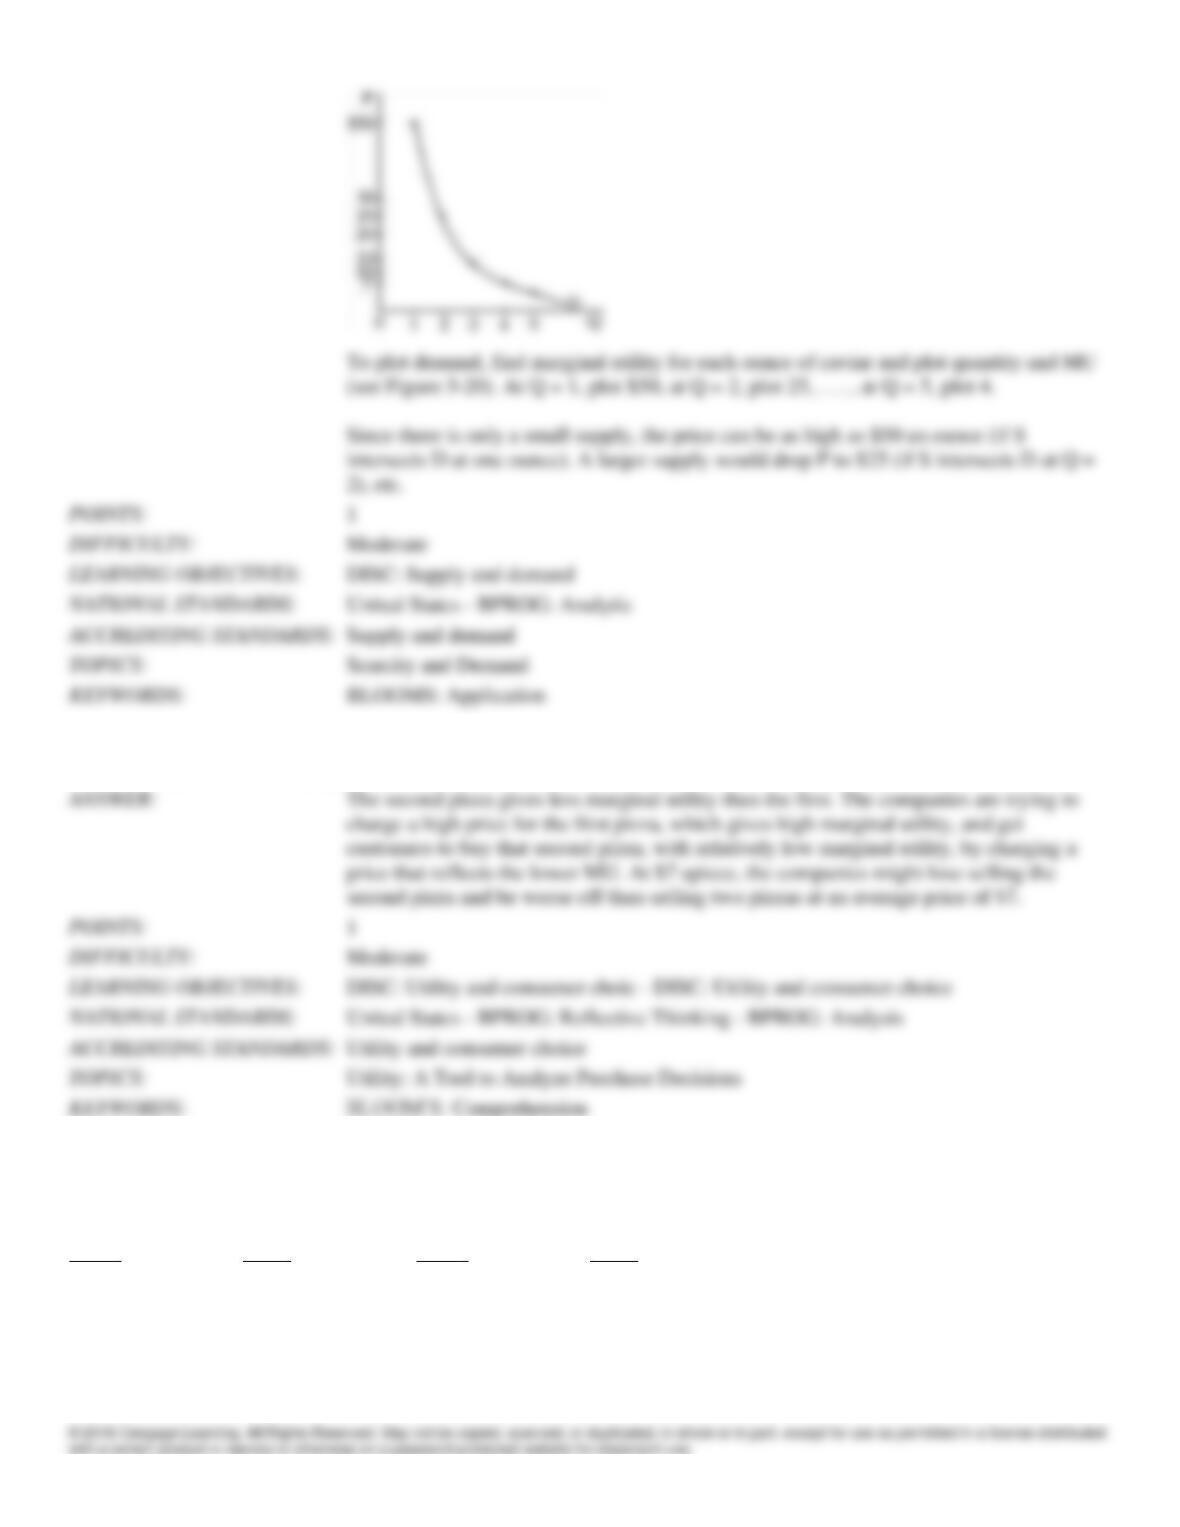
185. Plot the demand for caviar given the following information on quantity consumed and total utility; then explain why
caviar sells for such a high price.
Quantity
Total Utility
(in ounces)
(in dollars)
1
50
2
75
3
88
4
95
5
99
1
Moderate
186. Use the law of diminishing marginal utility to explain why Domino’s and Pizza Hut allow the purchase of a second
pizza for only $4 when one pays full price (around $10) for the first pizza. Why not simply charge $7 a pizza instead?
1
Moderate
187. You have five hours left to study for two exams tomorrow. The relationship between hours of study and test scores is
as follows:
Economics
Sociology
Hours
Score
Hours
Score
1
50
1
75
2
65
2
85
3
75
3
90
4
80
4
93
5
85
5
5
Use the rule for determining optimal purchases to allocate your time, where each point is one “util” of utility.
188. If I use 1,000 gallons of water a month at a price of $.01 a gallon, is my consumer surplus likely to be large or small?
Explain.
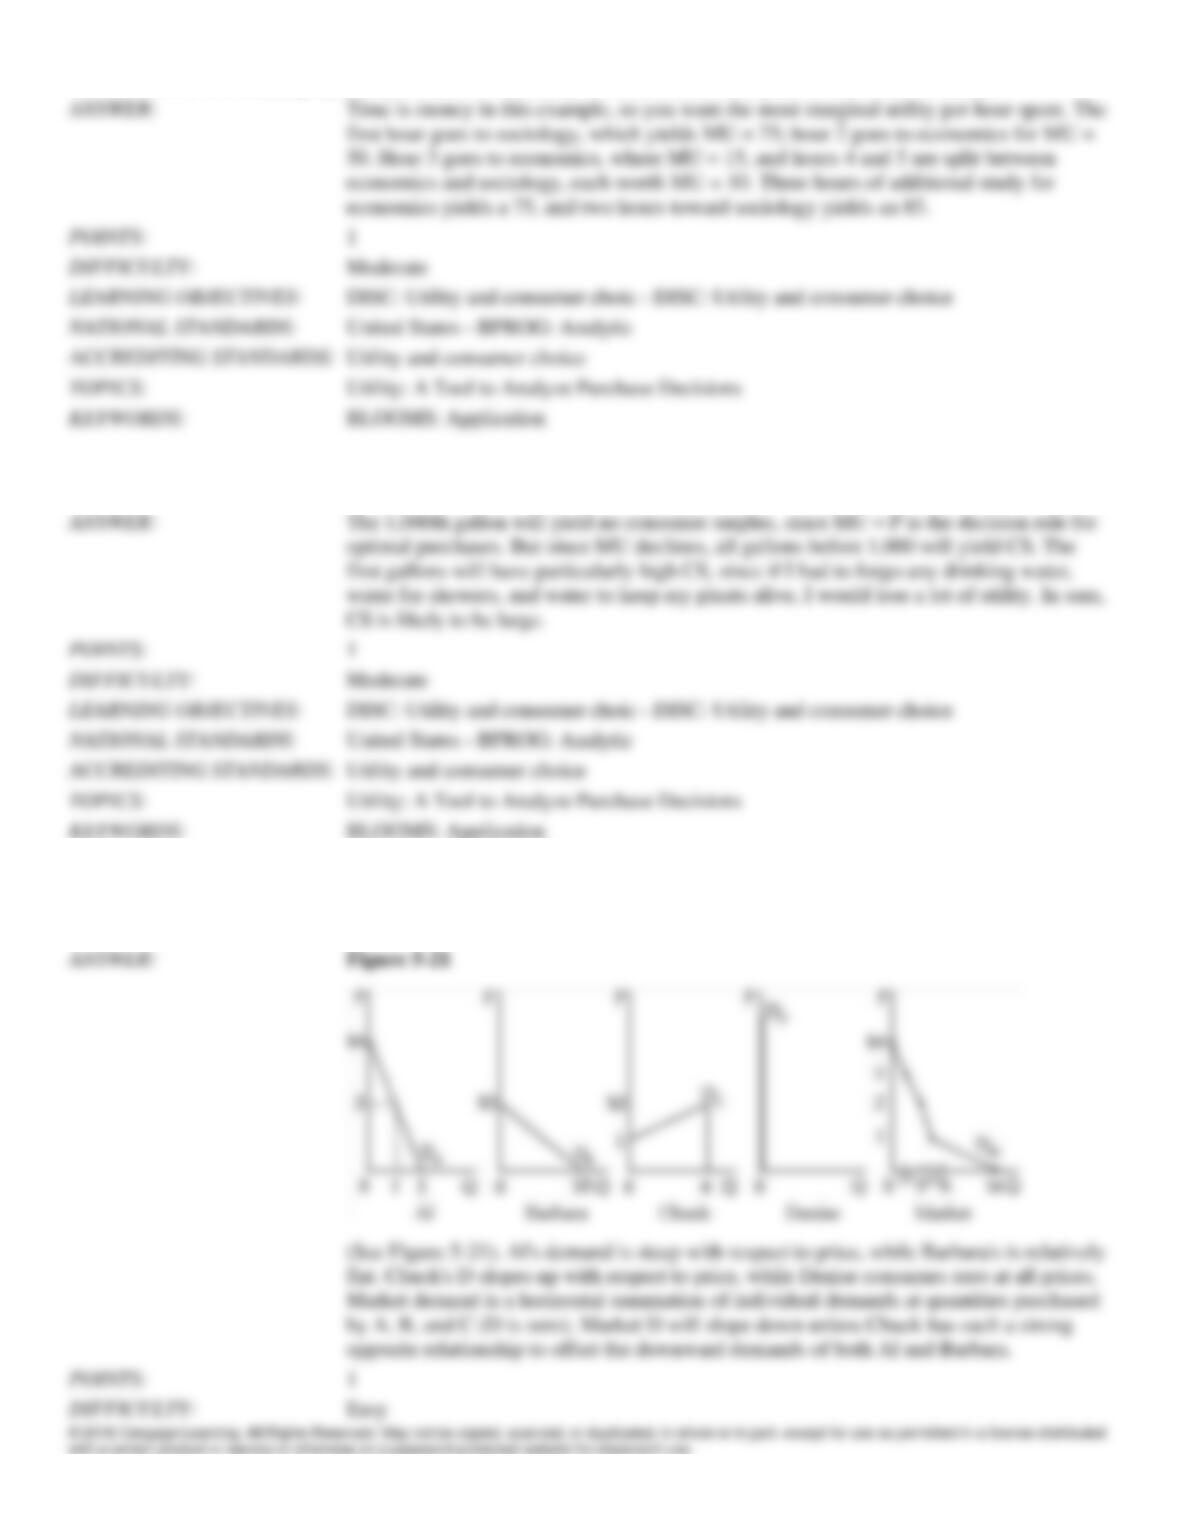
189. Draw individual demands for caviar for Al, Barbara, Chuck, and Denise where Al’s demand is relatively inelastic,
Barbara’s is elastic, Chuck’s is upward sloping, and Denise refuses to eat caviar at any price. Then draw the corresponding
market demand.
190. Bob values the utility of a single scoop of Baskin-Robbins ice cream at $1.50. A double scoop gives total utility of
$2.25, while a triple scoop yields $2.60. Baskin-Robbins charges $1.35 for a single, $1.95 for a double, and $2.35 for a
triple. How many scoops will Bob buy?
191. Alice has $10 to spend on wine and cheese. If wine is $2.50 a glass and cheese $2, draw the corresponding budget
line. Then draw three indifference curves, one showing the amount of wine and cheese Alice would choose, one showing
less preferred combinations of wine and cheese, and the last showing preferred but unaffordable combinations.
192. Draw the point of consumer equilibrium from an indifference map and budget line. Explain why this is the point of
optimization. Be sure your diagram is fully and correctly labeled.
193. Suppose the price of butter falls because milk price supports are removed. Will people’s tastes shift away from
margarine and toward butter?
194. What is marginal analysis?
195. If marginal net utility is positive, the consumer must be buying too small a quantity to maximize total net utility.
Why?
196. Why is it that the consumer can maximize total net utility only if the purchase quantity brings marginal utility as
close as possible to equality with price?
197. What is the relationship between marginal utility and an individual demand curve?
198. Use consumer indifference curves and budget lines to show the optimal consumption curves for a normal good and
for an inferior good. (Use two graphs.) Be sure your graphs are completely and correctly labeled.
199. Use consumer indifference curves and budget lines to illustrate the effects of an increase in income for a normal good
and an inferior good (use two graphs). Be sure your diagrams are fully and correctly labeled.
1
DISC: Utility and consumer choic – DISC: Utility and consumer choice
United States – BPRPOG: Analysis
Utility and consumer choice
Consumer Choice as a Trade-Off: Opportunity Cost
BLOOMS: Application
Table 5-3
Ice Cream Cones
Total Utility
1
50
2
80
3
95
4
95
200. Using Table 5-3, graph the marginal utility curve.
1
DISC: Utility and consumer choic – DISC: Utility and consumer choice
United States – BPROG: Reflective Thinking – BPROG: Analysis
Utility and consumer choice
Output, Price, and Profit: The Importance of Marginal Analysis
BLOOMS: Application
Figure 5-24
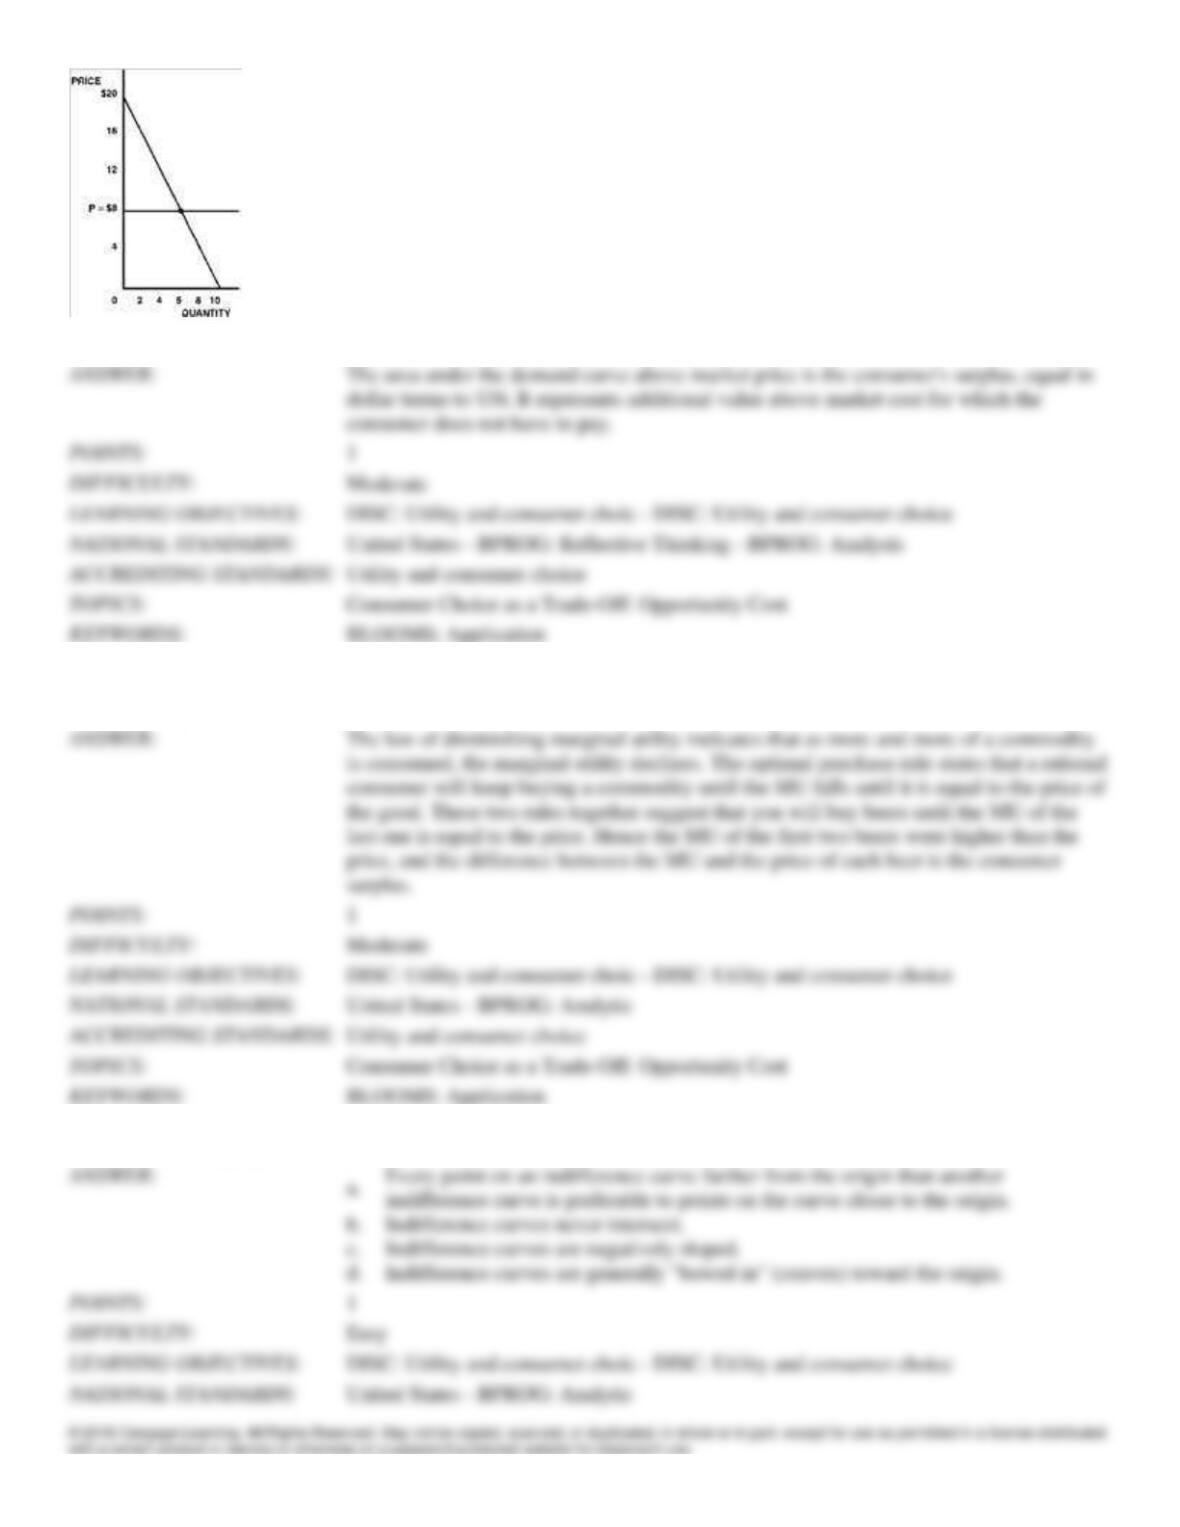
201. Given the demand curve in Figure 5-24, explain how consumer’s surplus is calculated.
202. If you go to a bar tonight and have three beers before going home to study economics, will you likely receive some
consumer surplus? Explain why or why not.
203. What are the properties of indifference curves?
204. Are there ever exceptions to the law of demand?
205. What is a budget line? What does its slope indicate?
206. What is the marginal rate of substitution, and what role does it play in determining the consumer’s optimum choice?