39. Standard Error of the Estimate. Body Fit, Inc., runs a California-based chain of health clubs featuring
aerobic exercise, racket sports, swimming and weight training facilities. An in-house study of monthly sales by
three outlets during the past year (a total of 36 observations) revealed the following (standard errors in
parentheses):
QY
= 450 – 4P + 2PX + 8A + 50T – 5W
(200) (1.3) (0.9) (3) (18) (3)
R2
= 96%
Standard Error of the Estimate = 10
Here QY = membership sales (in units), PY = average membership price (in dollars), PX = average membership price charged by competitors (in
dollars), A = advertising expenditures (in hundreds of dollars), T = time (in months of continuous operation), W = weather (in average monthly
temperature).
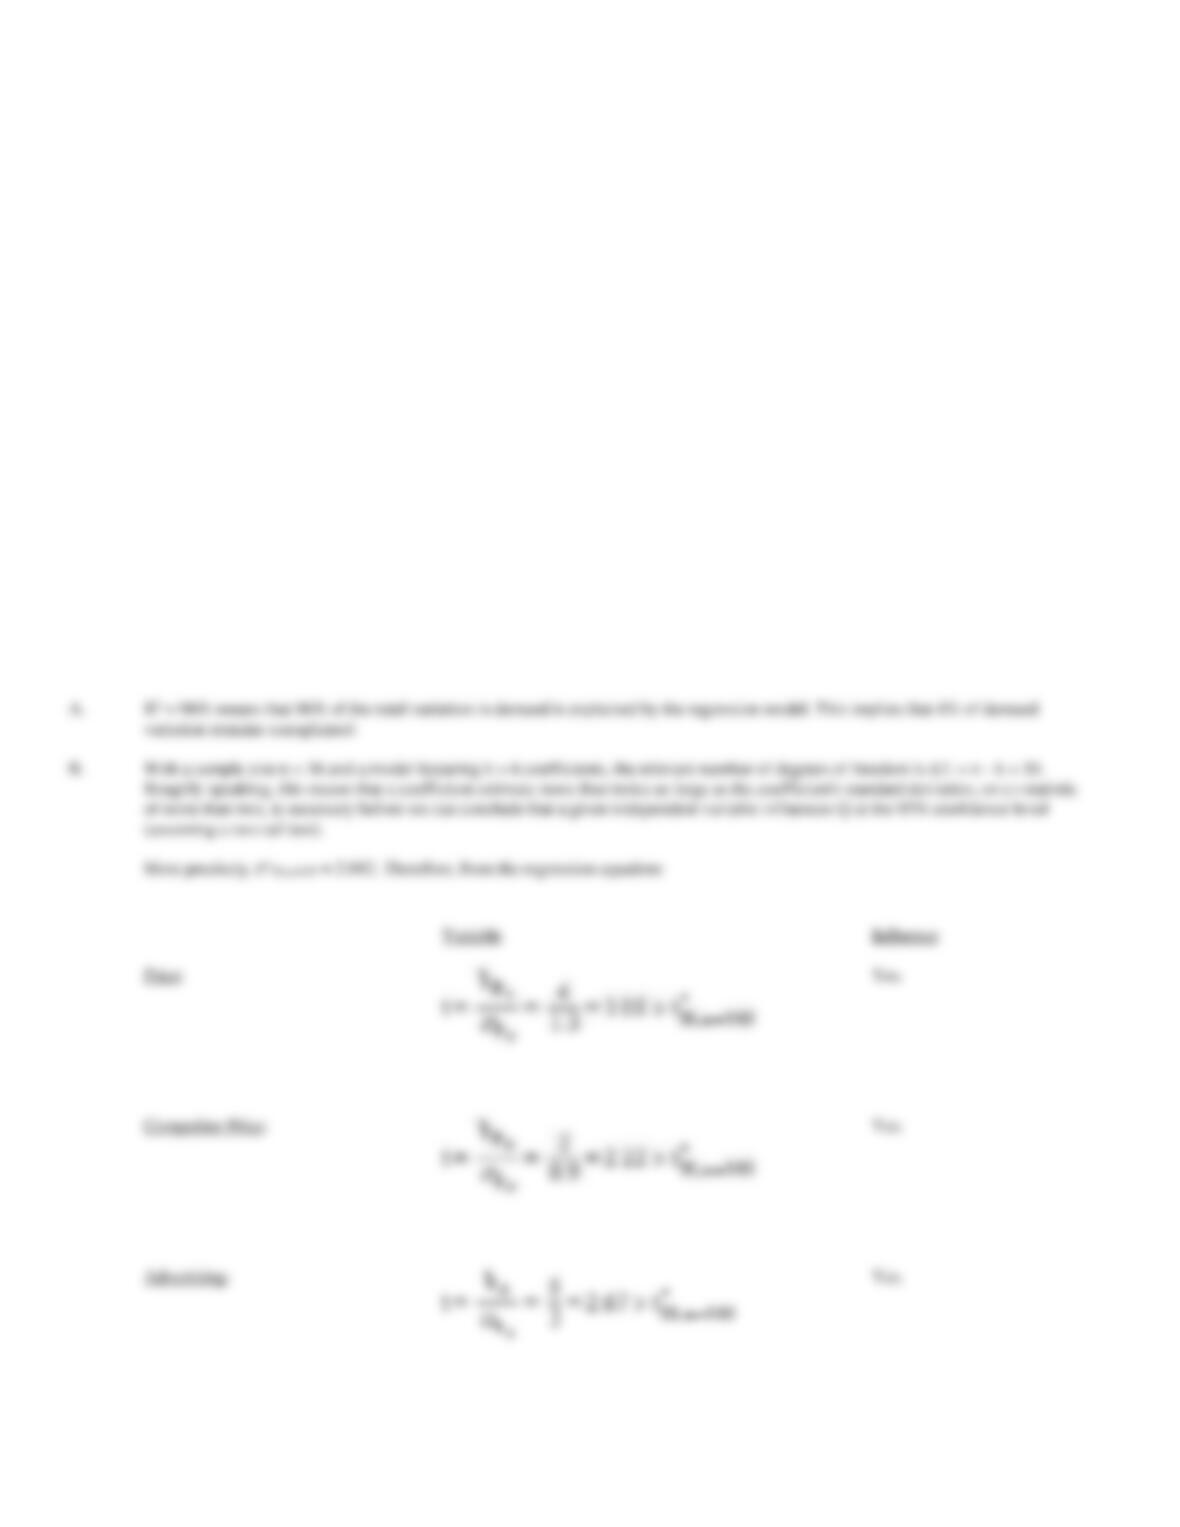
A.
What share of overall variation in membership sales is explained by the regression equation? What share is left unexplained?
B.
Using a 95% confidence level criterion, which independent factors have an influence on membership sales?
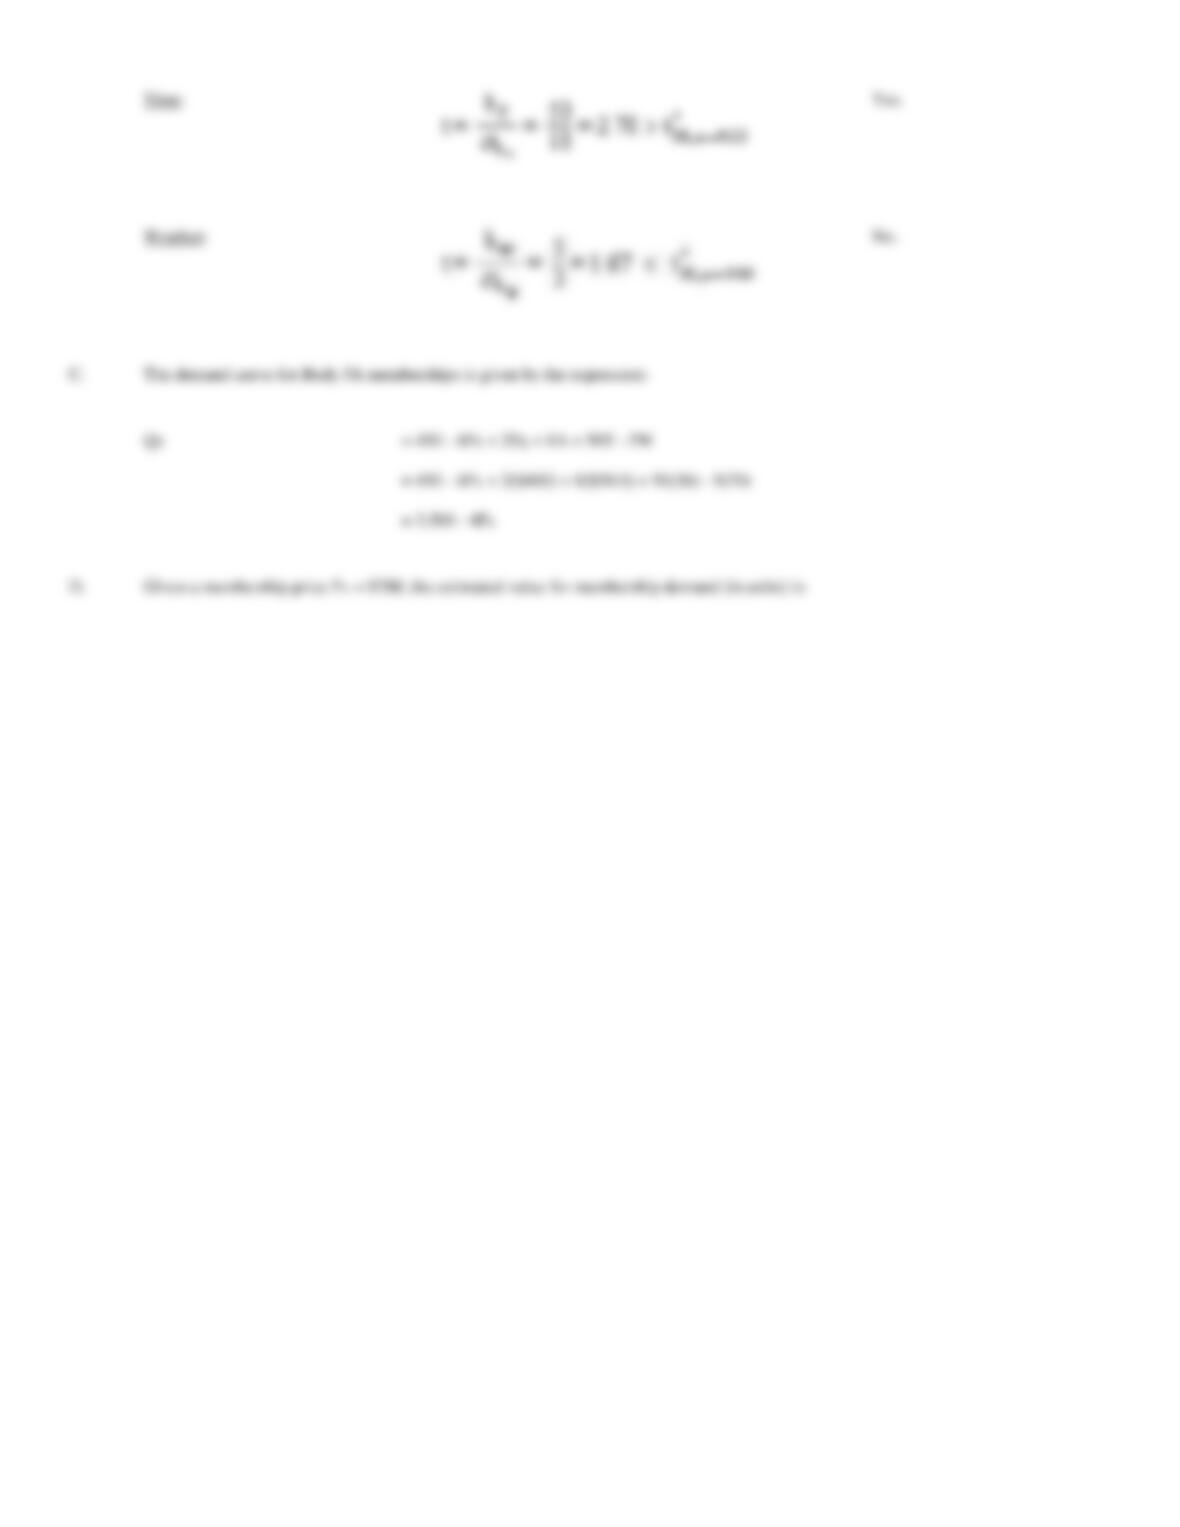
C.
During a recent month, the San Diego outlet’s average price was $700, the average competitor price was $600, advertising was $5,000,
the outlet had been in operation for 3 years, and the average monthly temperature was 70º. Assuming this was a typical observation
included in the study, derive the relevant demand curve for Body Fit memberships.
D.
Assume the model and data given above are relevant for the coming period. Calculate the range within which you would expect to find
actual monthly sales revenue with 95% confidence.
(assuming a two-tail test).
More precisely, t*30,a=0.05 = 2.042. Therefore, from the regression equation:
Variable
Influence

40. Demand Curve Estimation. The Real Kool Toys Company manufactures and sells educational toys. An
empirical demand function for one of the firm’s products has been estimated over the last 21 quarters using
regression analysis. The estimated demand function is:
QY
= -8,000 – 5,000PY + 192A + 120I + 2,000PX
(6,000) (1,000) (120) (80) (800)
R2
= 91%
Standard Error of the Estimate = 1,000
Here QY is quantity (measured in units) of Product Y demanded in the current period, A is hundreds of dollars of advertising ($00), I is thousands of
dollars of disposable income per capita ($000), and PX is the price ($) of another toy manufactured by a competitor, ABC Toys. The terms in
parentheses are the standard errors of the coefficients.
A.
How would you characterize the ability of this empirical demand function to explain demand for product Y?
B.
Currently, PY is $8, advertising is $25,000, disposable income per capita is $50,000 and PX is $7. What are expected sales of Y in this
period, and what range of sales would you specify for the current period if you wanted to establish a 99% confidence interval?
C.
What is the demand curve currently facing Real Kool for Product Y? (Note: Be careful to properly account for the units in which
advertising and income appear in the estimated demand function.)
D.
What is the point price elasticity of demand for Y at the current price?
E.
Given the current price elasticity of demand, would a price reduction increase Real Kool profits? Explain.
F.
What demand curve would Real Kool face for Product Y if it raised advertising expenditures to $37,500?
Note that:
= 20,000 units
41. One-Tail t-tests. Martin’s Footwear, Inc., of Boston, Massachusetts has retained you to aid the firm in an
evaluation of its marketing strategy. Martin’s “Happy Feet” running shoes are marketed through local retail
outlets in the eastern United States. A move to extend Martin’s market to Midwestern and western states is
currently being contemplated.
A marketing research group conducted an empirical analysis of demand for Martin’s “Happy Feet” during 2008
in thirty-six regional markets and found the following (standard errors in parentheses):
Q
= -518 – 10P + 12.5I + 5W – 0.5CA + 5A
(240) (1.3) (8.6) (2.8) (0.4) (2.5)
R2
= 85%
Standard error of the estimate = 200
cov(I,W)
= 3.5, cov(I,CA) = 8.6, cov(I,A) = 2.8
where Q = quantity sold (in pairs of shoes), P = price (in dollars), I = disposable income in relevant market (in millions of dollars), W = weather
measured by average temperature (in degrees), CA = competitor advertising (in thousands of dollars), A = Martin’s “own” advertising (in thousands
of dollars).
A.
Fully
evaluate
and
interpret the
empirical
results
reported
above on an
overall
basis.
Include in
your
analysis a
discussion
of:
(i)
R2
(ii)
(iii)
F-statistic
(iv)
Standard error of the estimate
B.
Will a
recession
hurt sales?
C.
Is demand
more
dependent
on local
income
than on
weather
conditions?
controlled for.
42. z-Statistics. Fantastic Footwear, Inc., of Freeport, Maine, has retained you to aid the firm in an evaluation
of its marketing strategy. Fantastic Footwear shoes are marketed through “factory outlet” malls located along
the eastern seaboard. A move to extend the company’s market to Midwestern and Western states is currently
being contemplated.
A marketing research group conducted an empirical analysis of demand for the company’s shoes during 2008 in
twenty regional markets and found the following (standard errors in parentheses):
Q
= -1,000P + 500PX + 200M
(800) (125) (80)
R2
= 94%
Standard error of the estimate = 500
where Q = quantity sold (in pairs of shoes), P = price (in dollars), PX is the average price of shoes in competitor stores, and M is the distance in miles
to the nearest competing factory outlet mall.
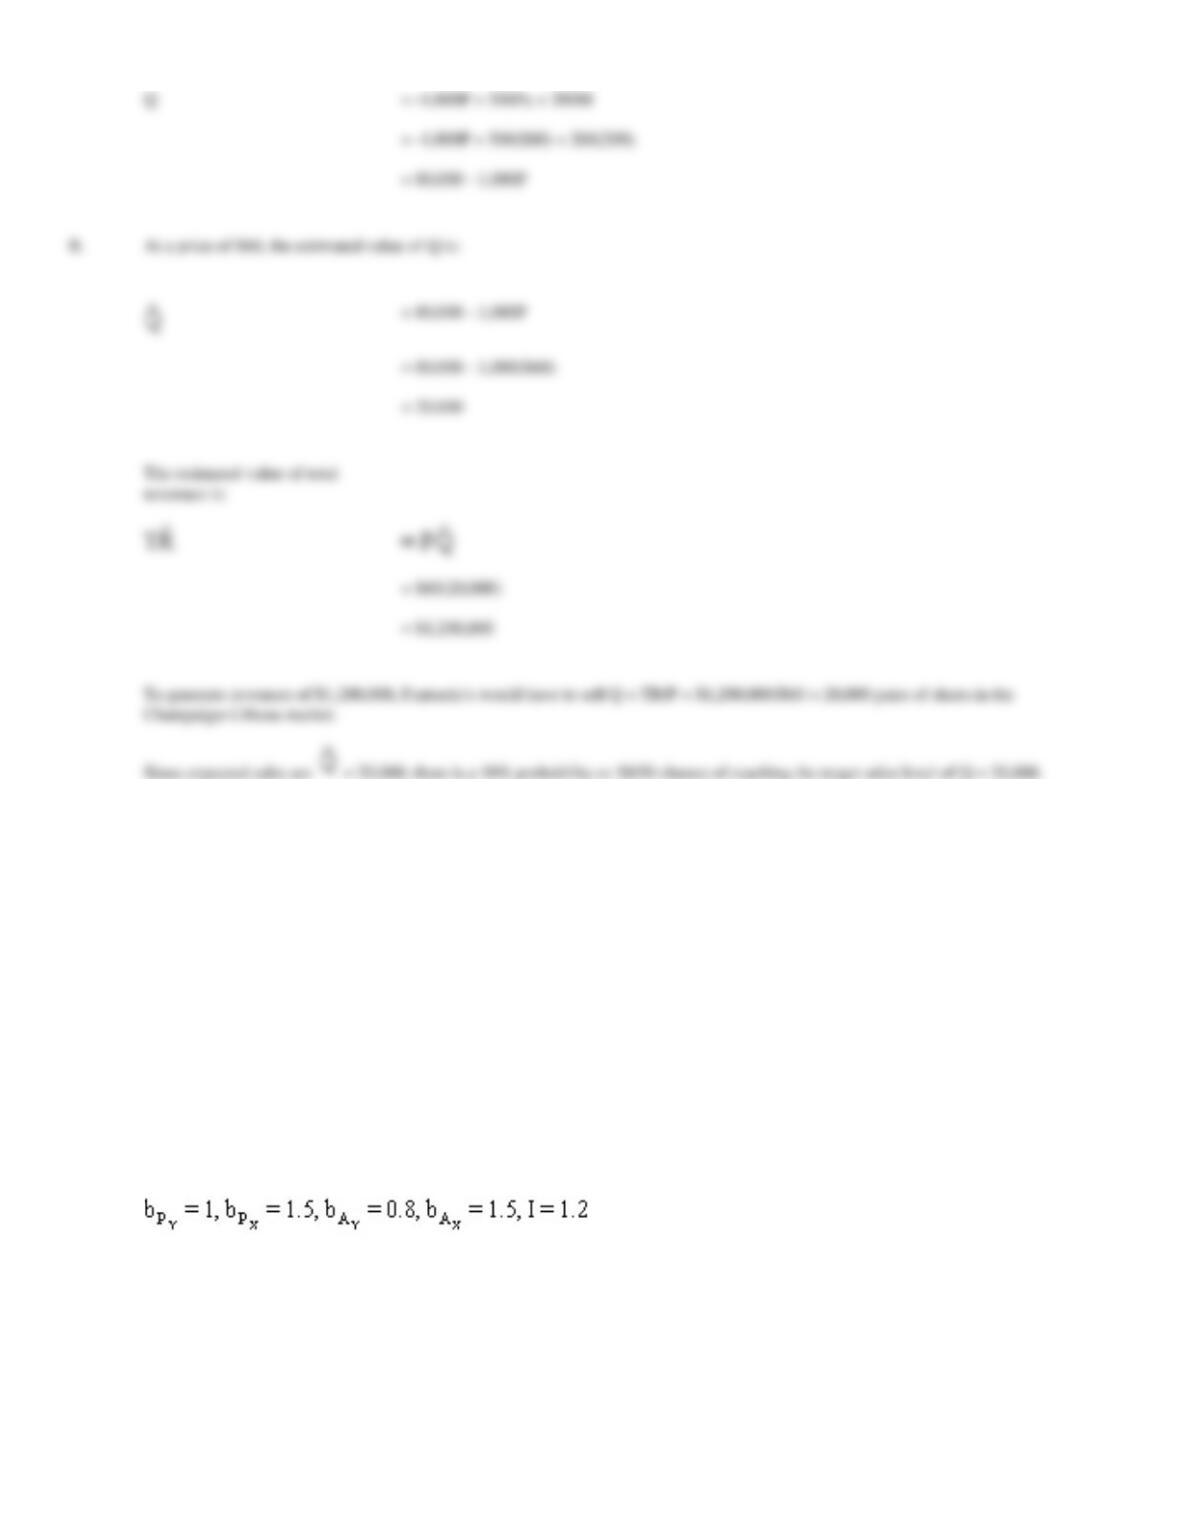
Champaign-Urbana, Illinois is a potential Midwestern market with economic characteristics typical of those eastern markets included in the empirical
analysis. In Champaign-Urbana, expected levels are: P = $60, PX = $80 and M = 200 miles.
A.
Derive the demand curve for the Champaign-Urbana market.
B.
Calculate the probability of Martin’s generating at least $1.2 million in revenues in the Champaign-Urbana market given a wholesale
price of $60 per pair.
where,
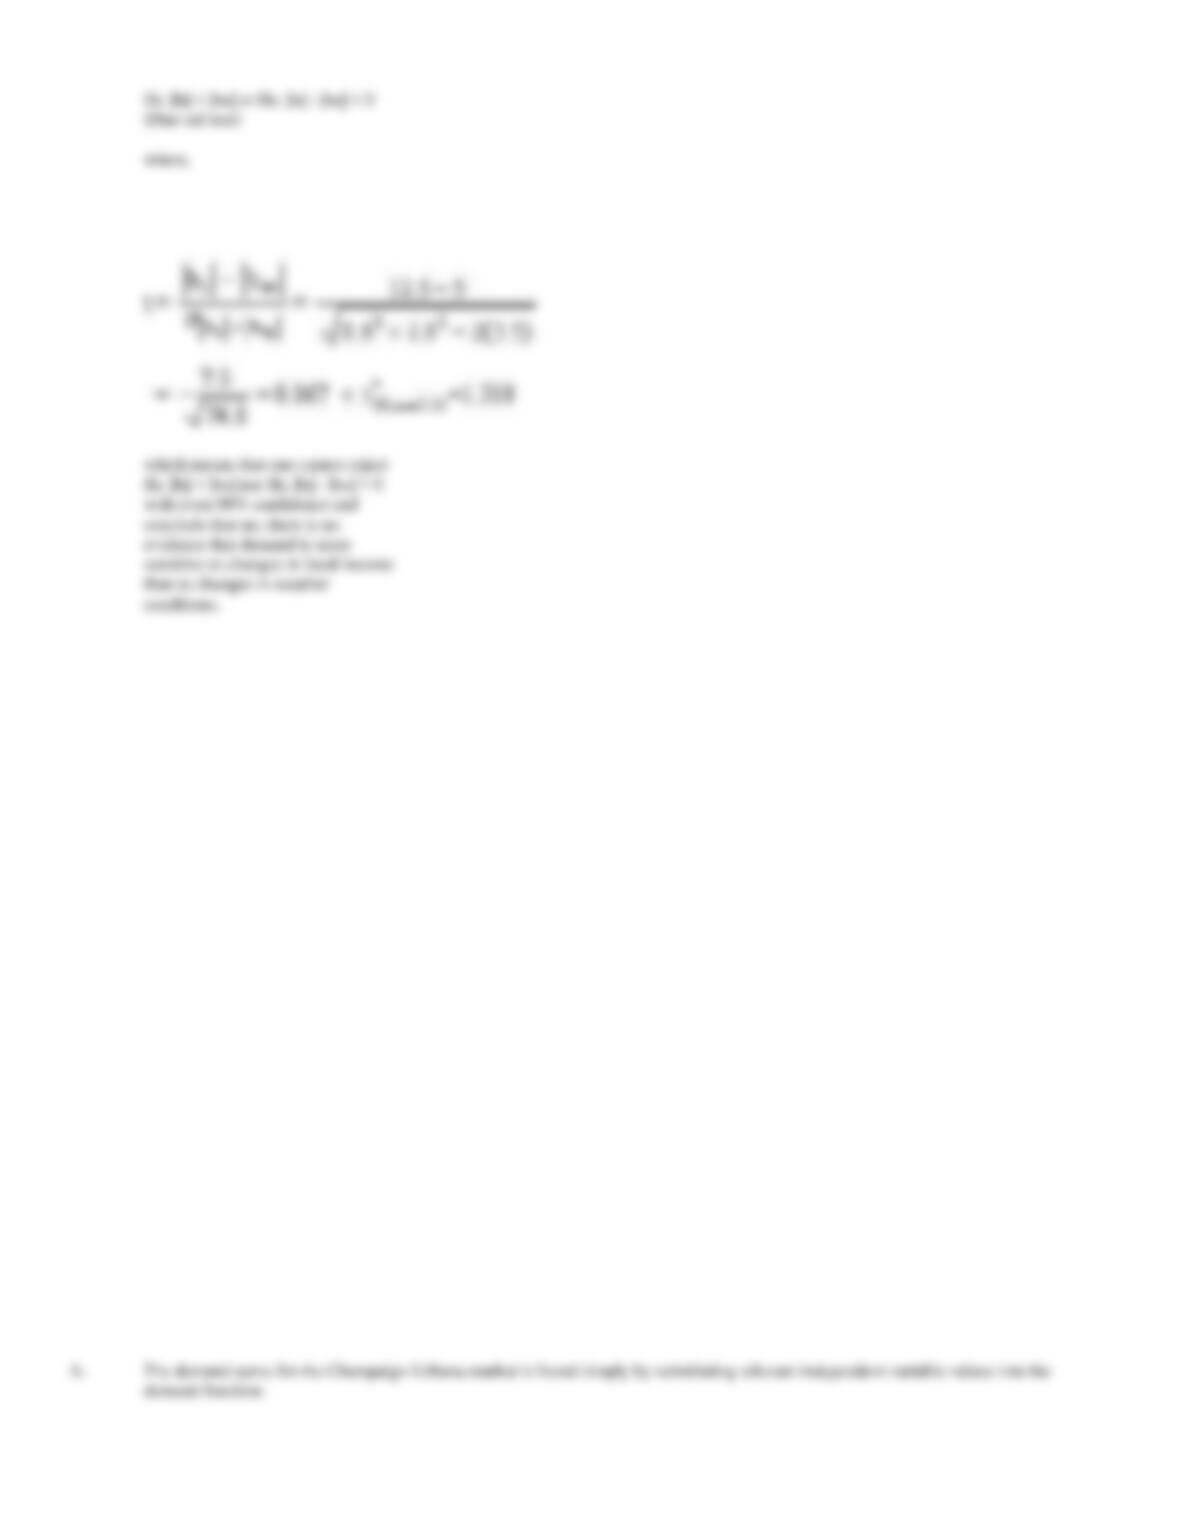
43. One-tail t tests. A study of the demand for imported motorcycles recently appeared in an industry
newsletter. According to the study, demand for motorcycle imports is described by the function:
QY
= 1.5PY-4PX3AY2AX2I3
R2
= 95%
Standard error of the estimate = 30
Here QY is the quantity of motorcycles imported (000), PY is average motorcycle price ($), PX is the average price of imported compact cars, AY is
motorcycle industry advertising ($000,000), AX is industry advertising of compact cars ($000,000), and I is average disposable family income ($000).
The standard errors of the exponents in the multiplicative demand function above are:
And finally, this demand function was estimated using two years of monthly data (24 observations).
A.
Is the demand for imported motorcycles elastic with respect to price?
B.
Are imported motorcycles a normal good?
C.
Are motorcycles and compact cars substitutes?
D.
Given your answer to part A, can you explain why the coefficients for both AY and AX are positive?
Q
= 80,000 – 1,000P
At a price of $60, the estimated value of Q is:
= 80,000 – 1,000($60)
= 20,000
= $60(20,000)
= $1,200,000
Since expected sales are = 20,000, there is a 50% probability or 50/50 chance of reaching the target sales level of Q = 20,000.