Name:
Class:
Date:
Chapter 05: Elasticity of Demand and Supply
a.
Demand is elastic.
b.
Demand is inelastic.
c.
Demand is unit elastic.
d.
Demand is perfectly inelastic.
e.
Demand is perfectly elastic.
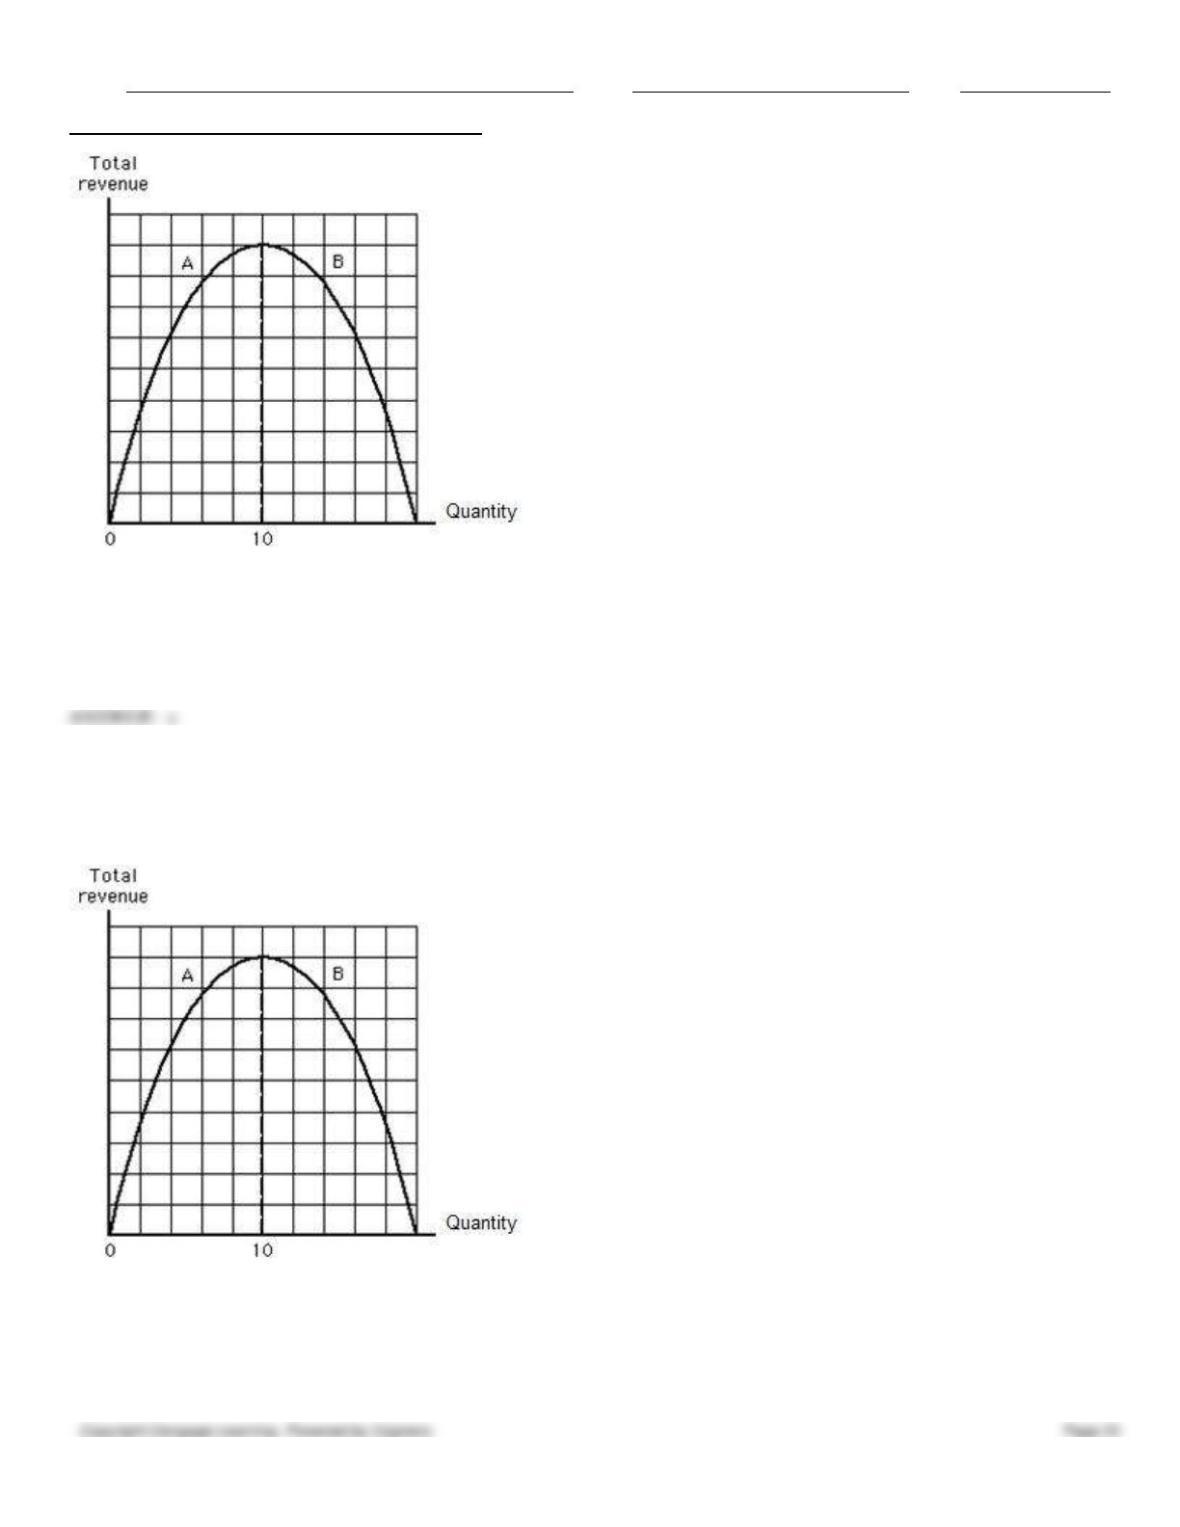
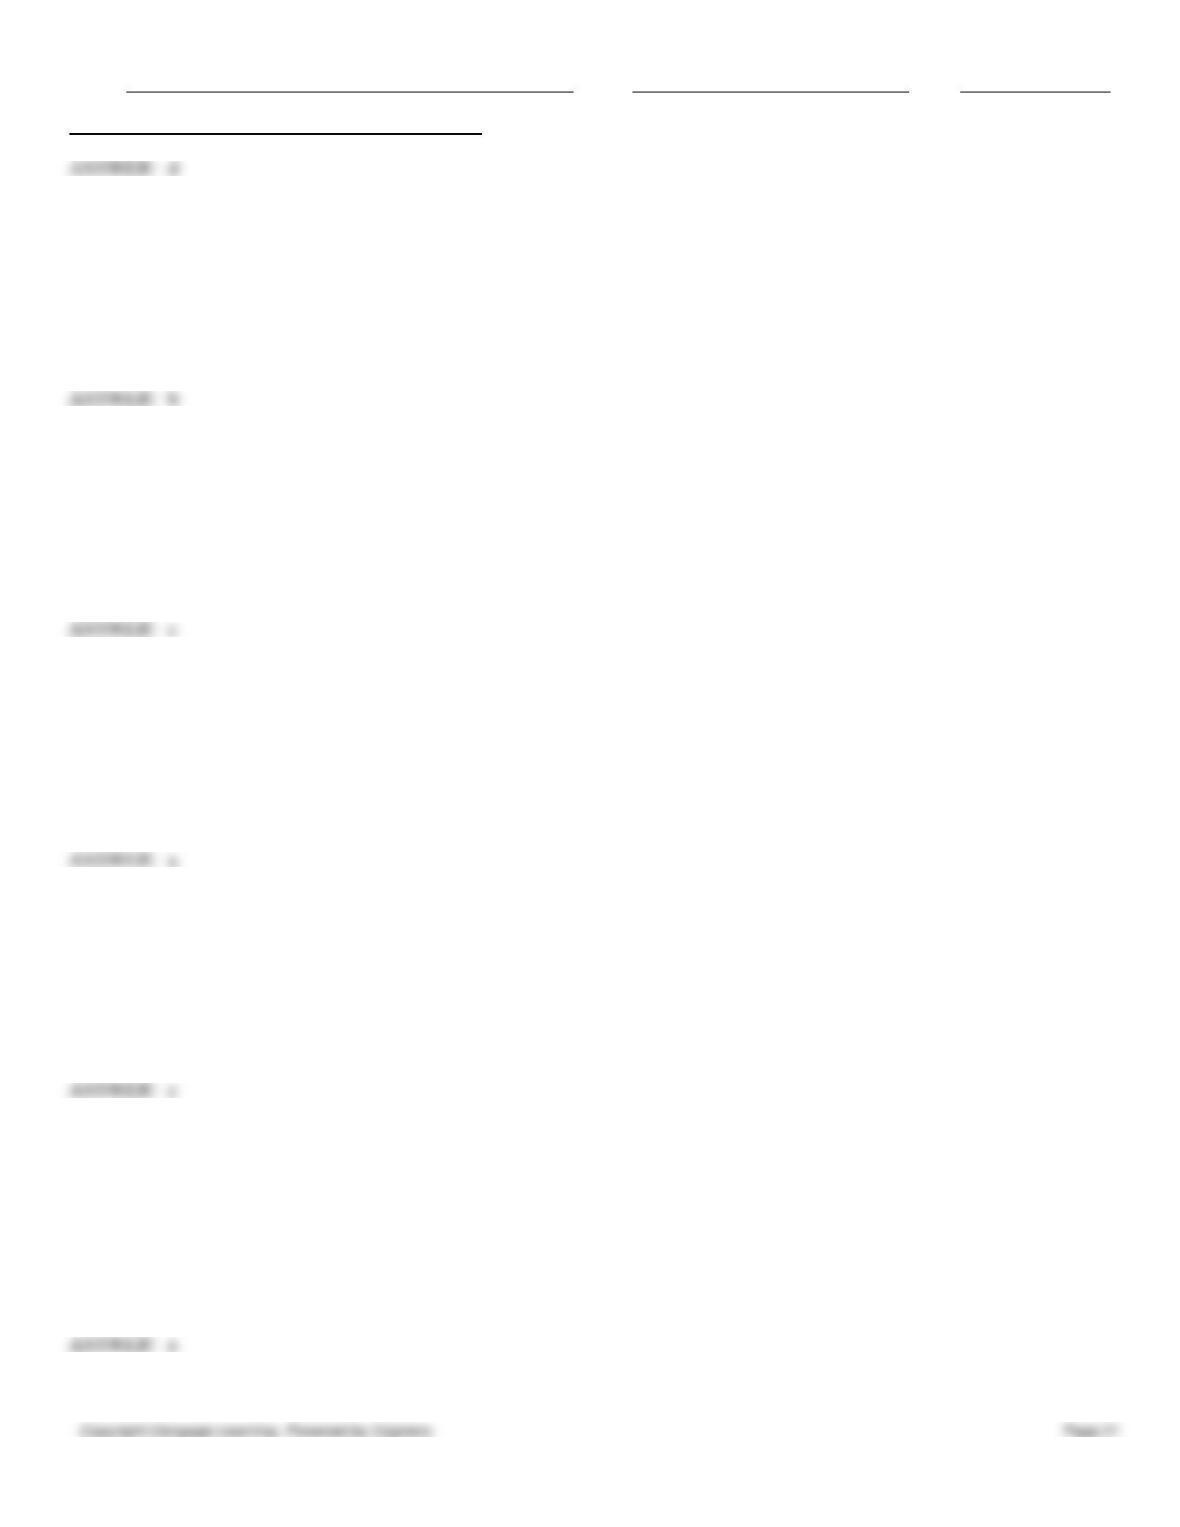
82. Figure 5.5 shows the total revenue curve for a firm. Which of the following is not true in the range of the total revenue
curve labeled A?
Figure 5.5
a.
Demand is inelastic.
b.
Total revenue is increasing.
c.
Total revenue is positive.
d.
Demand is elastic.
e.
Demand elasticity decreases as total revenue increases.
Name:
Class:
Date:
Chapter 05: Elasticity of Demand and Supply
83. A perfectly elastic demand curve is:
a.
a vertical straight line.
b.
a horizontal straight line.
c.
a downward-sloping straight line.
d.
an upward-sloping straight line.
e.
u-shaped.
84. If a firm facing a perfectly elastic demand curve raises its price, then:
a.
it will still sell exactly the same amount of output as it did at the lower price.
b.
it will lose some, but not all, of its sales.
c.
its sales will fall to zero.
d.
its sales will increase.
e.
it will lose its market share.
c
85. A perfectly inelastic demand curve is:
a.
a vertical straight line.
b.
a horizontal straight line.
c.
a downward-sloping straight line.
d.
an upward-sloping straight line.
e.
a u-shaped curve.
a
86. For which of the following products is the consumer’s demand curve most likely to be vertical?
a.
Lobster, for a seafood lover.
b.
Cars, for high school students.
c.
Insulin, for a diabetic.
d.
Compact disks, for a music lover.
e.
Beef, for a food lover.
c
87. John spends exactly the same dollar amount on candy bars each week, regardless of their price. John’s demand curve
for candy bars is:
a.
downward-sloping.
b.
backward-bending.
c.
perfectly inelastic.
d.
perfectly elastic.
e.
unit elastic.
e
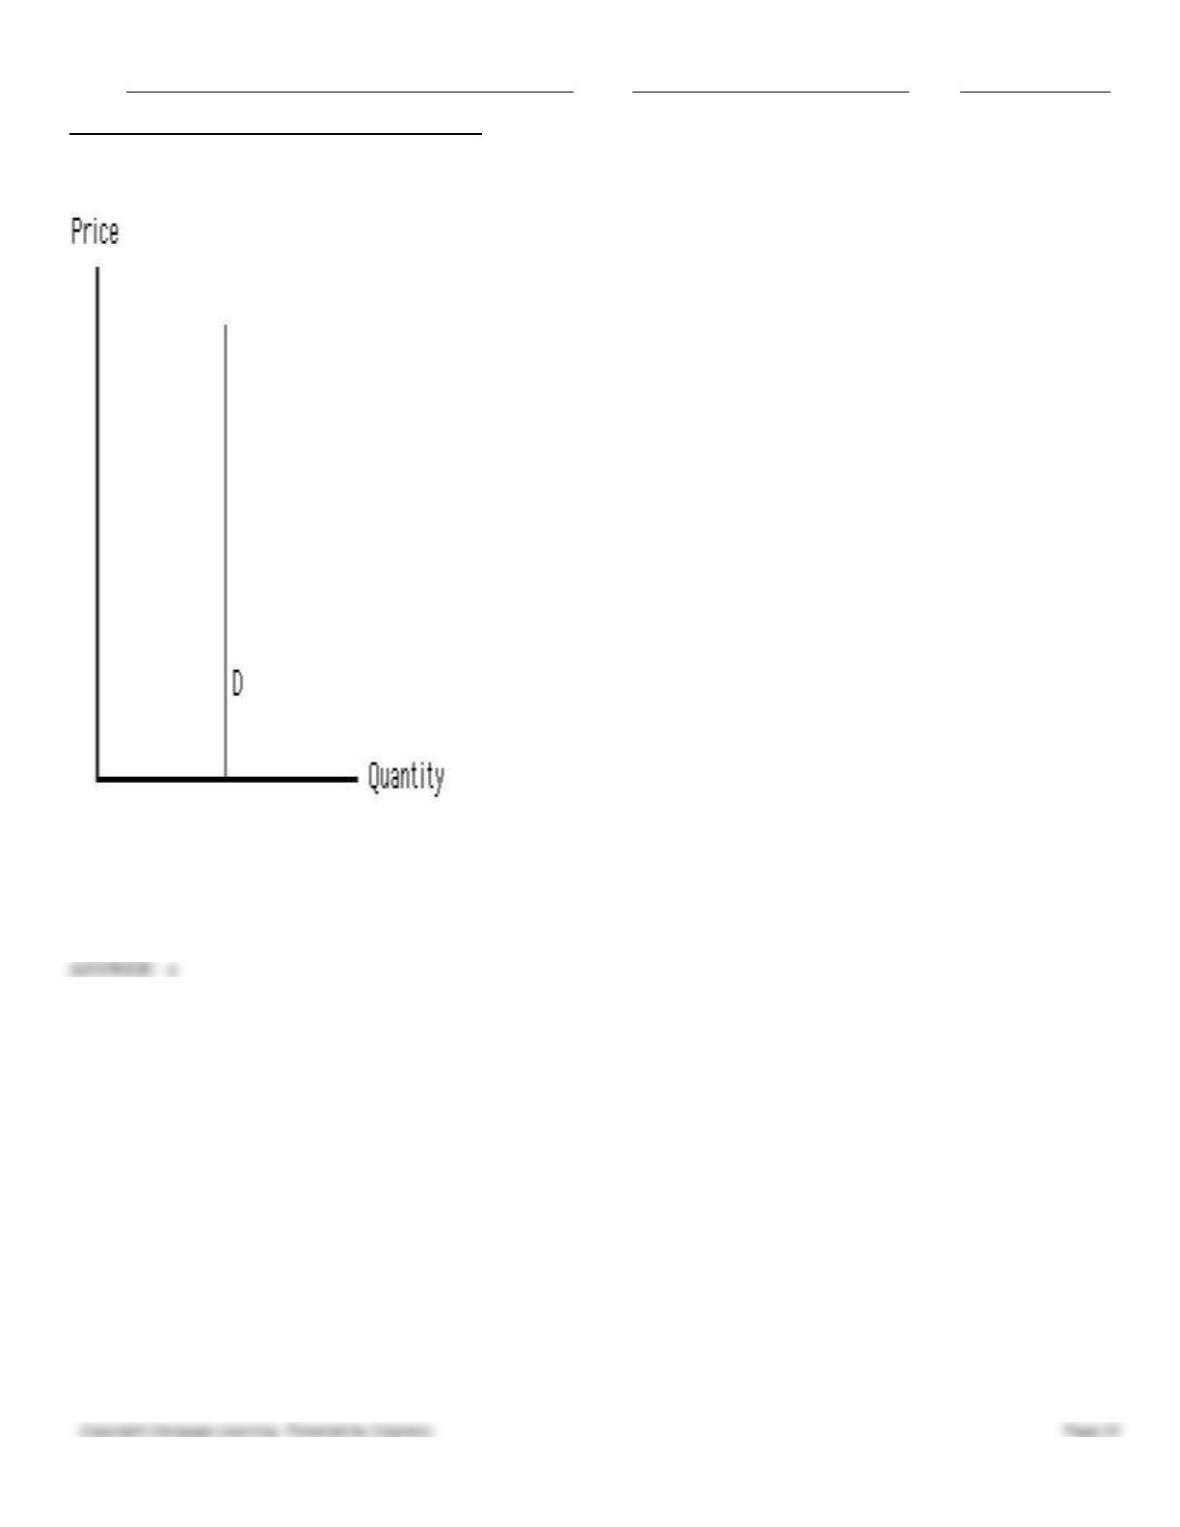
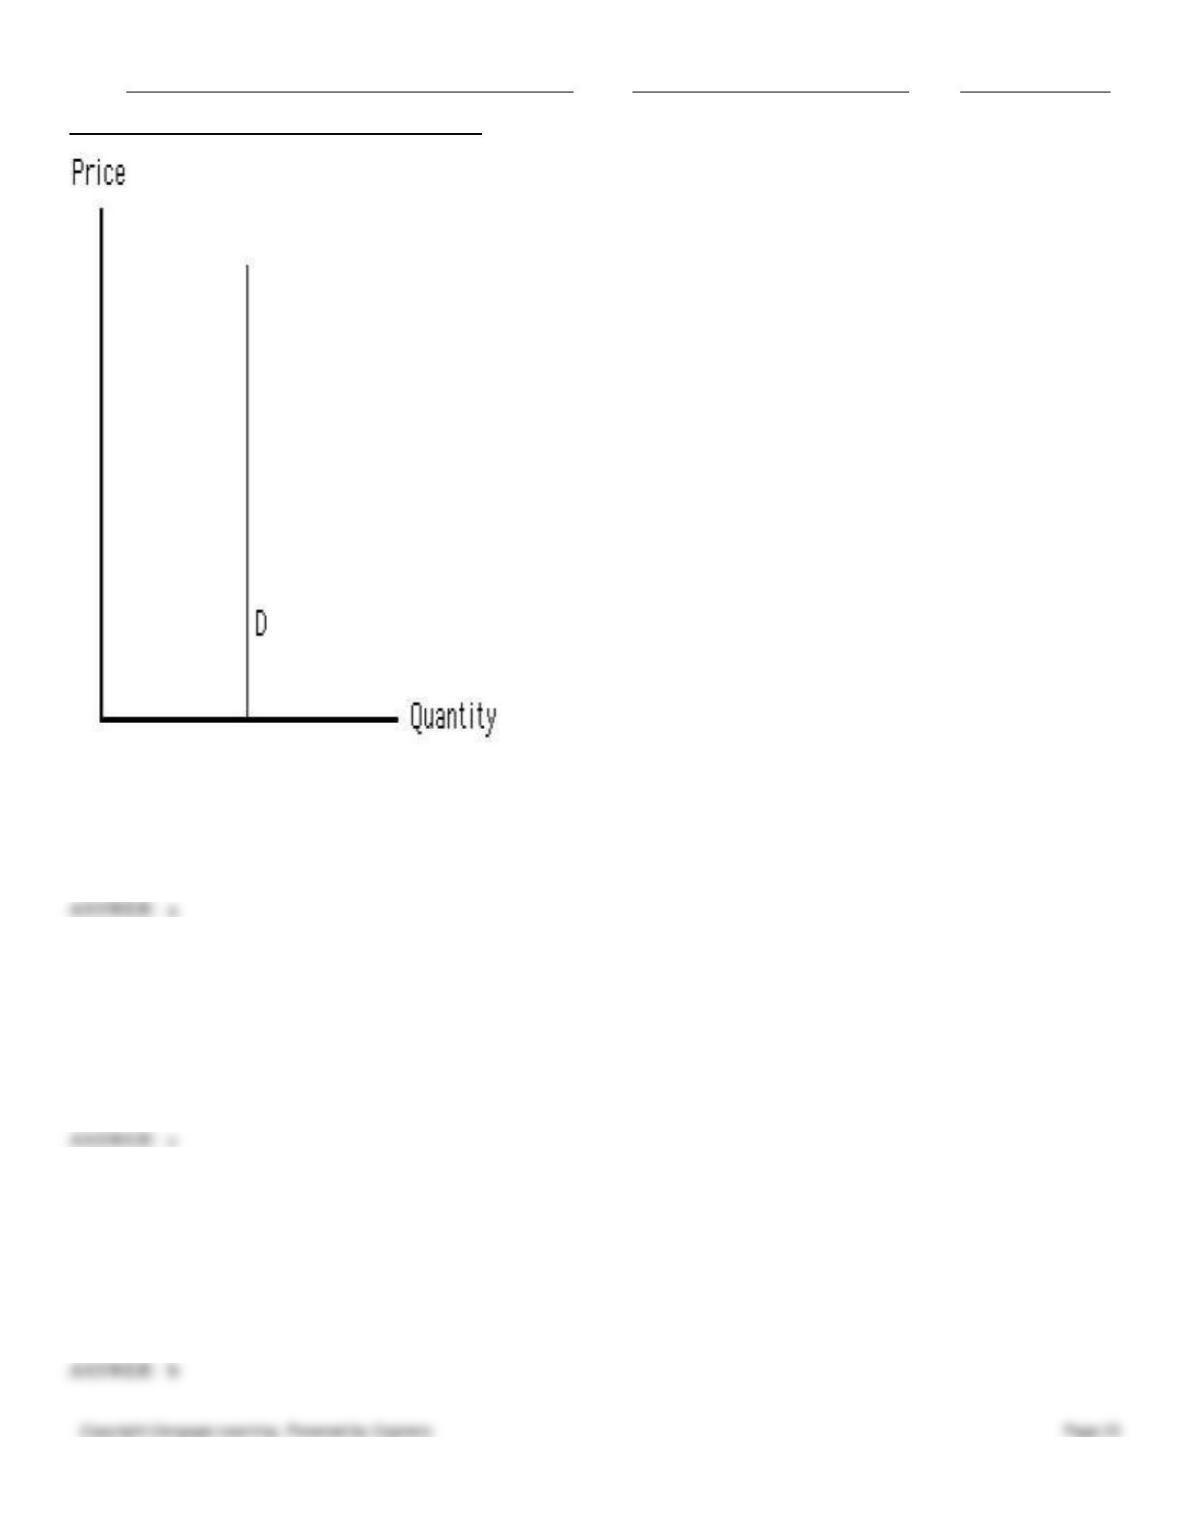
88. Figure 5.6 shows a vertical demand curve. The demand in the figure below is:
Name:
Class:
Date:
Chapter 05: Elasticity of Demand and Supply
Figure 5.6
a.
unit elastic.
b.
relatively elastic.
c.
perfectly elastic.
d.
relatively inelastic.
e.
perfectly inelastic.
89. Figure 5.6 shows a vertical demand curve. The price elasticity of demand in the figure below is _____.
Figure 5.6
Name:
Class:
Date:
Chapter 05: Elasticity of Demand and Supply
a.
0
b.
−1
c.
infinity
d.
1
e.
−100
a
90. If Joe says that nothing comes close to a Pepsi, his demand for Pepsi is likely to be:
a.
relatively price elastic.
b.
relatively income elastic.
c.
relatively price inelastic.
d.
unit elastic.
e.
perfectly elastic.
c
91. Given the availability of California oranges, the demand for Florida oranges will:
a.
be less elastic than if there were no California oranges.
b.
be more elastic than if there were no California oranges.
c.
have the same elasticity as it would if there were no California oranges.
d.
be perfectly elastic.
e.
be perfectly inelastic.
b
Name:
Class:
Date:
Chapter 05: Elasticity of Demand and Supply
92. The value of the price elasticity of demand for a good with no close substitutes tends to be:
a.
greater than −1.
b.
less than −1.
c.
equal to −1.
d.
equal to 0.
e.
equal to 1.
a
93. Demand is more elastic:
a.
in the short run than in the long run.
b.
for necessities than for luxuries.
c.
for goods with no substitutes.
d.
for goods with many substitutes than for goods with only a few.
e.
for broadly defined goods than for narrowly defined ones.
94. Which of the following does not determine a good’s price elasticity of demand?
a.
The time interval considered
b.
The number of substitutes available for the good
c.
Expenditure on the good as a percentage of the total consumer budget
d.
The slope of the demand curve
e.
The more of a luxury a particular good is
95. Which of the following is a possible reason for the price elasticity of demand for cigarettes being large for young
smokers?
a.
They have large discretionary incomes.
b.
The price of cigarettes has increased recently.
c.
They are no longer permitted to smoke in public.
d.
Cigarette advertising on television has been banned.
e.
The proportion of income a young smoker spends on cigarettes is usually quite large.
e
96. For which of the following is demand most likely to be perfectly inelastic?
a.
BMW automobiles.
b.
Pepsi Cola.
c.
Hot dogs.
d.
Insulin.
e.
Tylenol.
97. A good that is defined broadly has:
a.
more substitutes and a more elastic demand.
b.
fewer substitutes and a more elastic demand.

Name:
Class:
Date:
Chapter 05: Elasticity of Demand and Supply
c.
more substitutes and a less elastic demand.
d.
fewer substitutes and a less elastic demand.
e.
more complements and a more elastic demand.
98. The demand for Olin skis is likely to be:
a.
less elastic than the demand for skis in general. See 5-2: Determinants of the Price Elasticity of Demand
b.
more elastic than the demand for skis in general. See 5-2: Determinants of the Price Elasticity of Demand
c.
unit elastic relative to the demand for skis in general. See 5-2: Determinants of the Price Elasticity of Demand
d.
as elastic as the demand for skis in general. See 5-2: Determinants of the Price Elasticity of Demand
e.
greater than the demand for skis in general. See 5-2: Determinants of the Price Elasticity of Demand
99. The demand curve for a good that has many perfect substitutes is likely to be:
a.
upward sloping.
b.
steep.
c.
backward-bending.
d.
horizontal.
e.
vertical.
100. A successful advertising campaign is most likely to:
a.
increase the price elasticity of demand by stressing upon the uniqueness of the product.
b.
reduce the price elasticity of demand by stressing upon the uniqueness of the product.
c.
reduce the price elasticity of demand by informing consumers about the availability of substitutes.
d.
have no effect on the demand curve.
e.
make the demand curve shift inward.
101. As DVDs become popular substitutes for video cassettes, demand for video cassettes is likely to:
a.
become less price elastic.
b.
become more price elastic.
c.
increase.
d.
stay the same.
e.
become unit elastic.
102. Luis wonders why commercials appear more frequently at the end of a TV movie than at the beginning. Carol says
that this pattern can be explained by the:
a.
amount of time Luis spends watching TV.
b.
length of the adjustment period.
c.
cost of supplying additional minutes of the movie.
d.
high elasticity of demand for watching the end of a TV movie.
e.
availability of substitutes for the TV movie.

Name:
Class:
Date:
Chapter 05: Elasticity of Demand and Supply
e
103. A good that takes up a very large percentage of a consumer’s budget will tend to have:
a.
an elastic demand.
b.
a perfectly elastic demand.
c.
an inelastic demand.
d.
an upward-sloping demand curve.
e.
many close substitutes.
a
104. All other things constant, if a _____ proportion of a consumer’s budget is spent on a good, the demand for the good
will be more _____ and a consumer will purchase a substitute instead.
a.
greater; price elastic
b.
smaller; unit elastic
c.
smaller; price elastic
d.
greater; price inelastic
e.
greater; stable
a
105. Given the proportion of a consumer’s income spent on various goods, the demand for _____ is likely to be the most
price inelastic.
a.
furniture
b.
automobiles
c.
hotel rooms
d.
airline travel
e.
candy bars
e
106. The demand for flour is:
a.
inelastic because there are few substitutes for flour and it represents a large percentage of a consumer’s budget.
b.
inelastic because there are many substitutes for flour and it represents a large percentage of a consumer’s
budget.
c.
inelastic because there are few substitutes for flour and it represents a small percentage of a consumer’s
budget.
d.
elastic because there are no substitutes for flour and it represents a large percentage of a consumer’s budget.
e.
elastic because there are many substitutes for flour and it represents a large percentage of a consumer’s budget.
c
107. Which of the following goods will have a higher price elasticity of demand?
a.
A good with few substitutes.
b.
A good with many substitutes.
c.
A good that represents a small proportion of the consumer’s budget.
d.
A good that is broadly defined.
e.
A good that is a necessity.
Name:
Class:
Date:
Chapter 05: Elasticity of Demand and Supply
108. If people have more time to adjust to a price change, the price elasticity of demand for that good is likely to:
a.
increase.
b.
decrease.
c.
fall to zero.
d.
be equal to −1.
e.
remain unchanged.
a
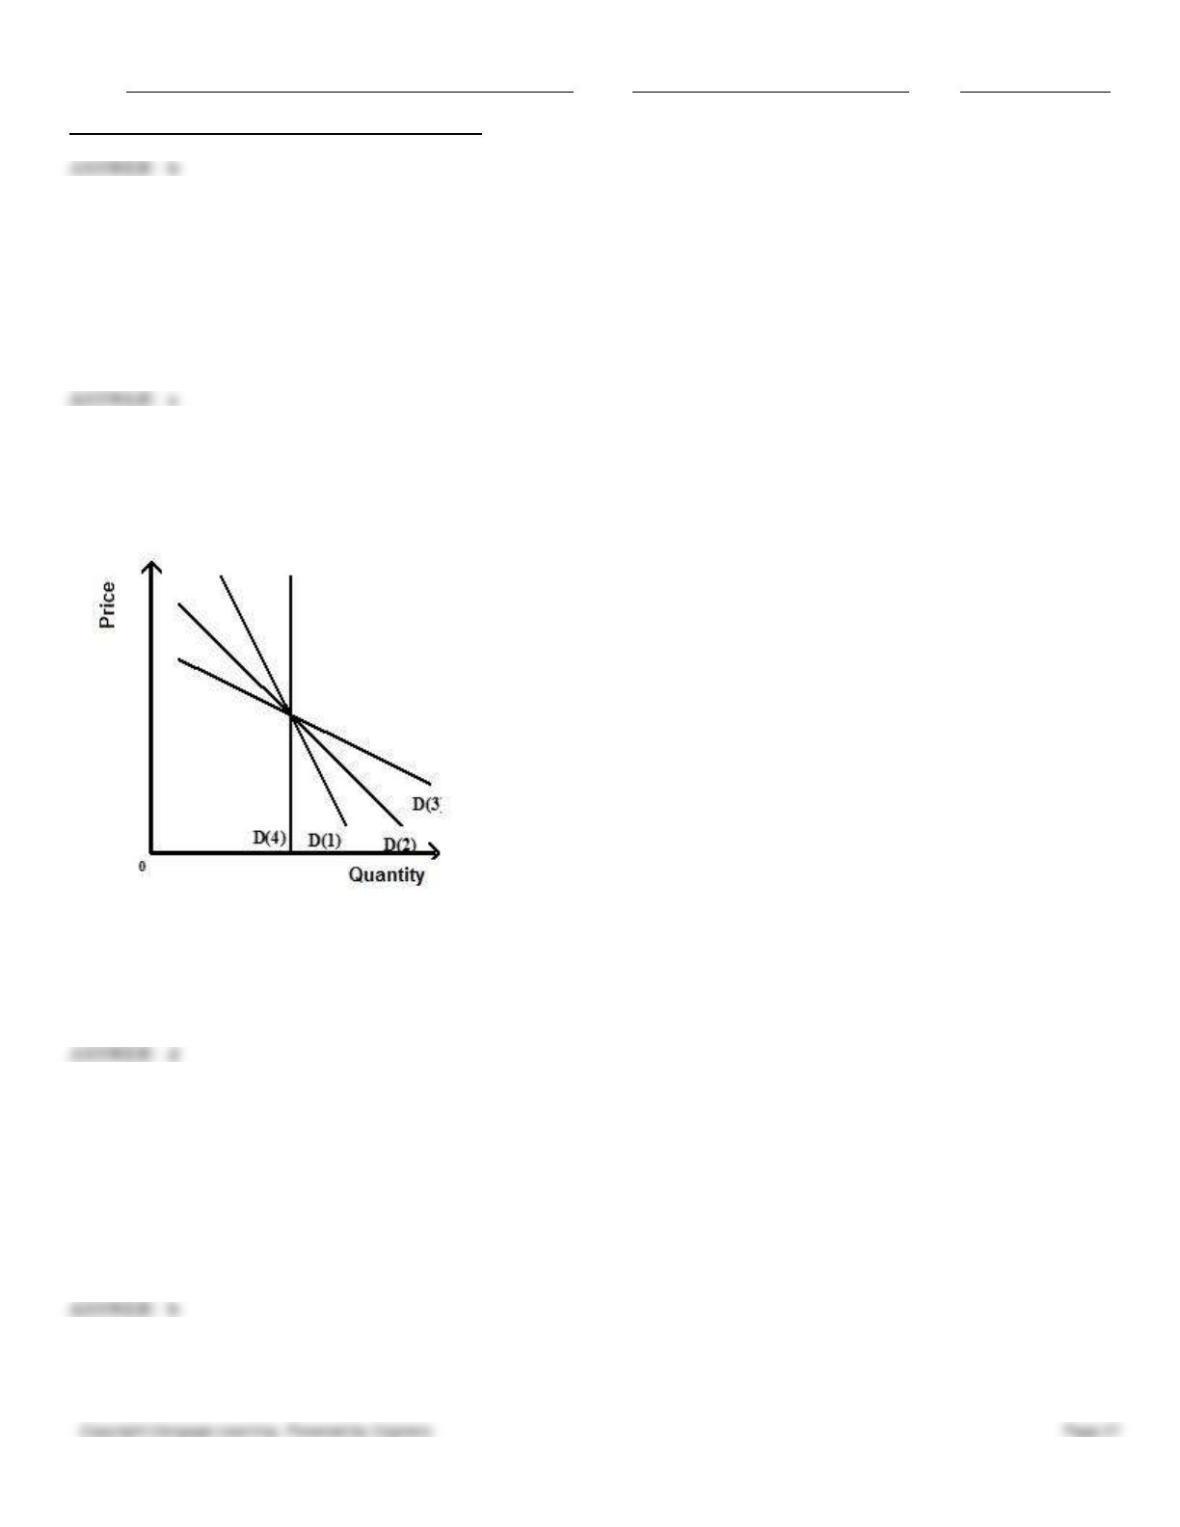
109. Figure 5.7 shows four demand curves. The demand curve that best illustrates how consumers will respond to a
change in price over a very long time period is:
Figure 5.7
a.
curve D(1).
b.
curve D(2).
c.
curve D(4).
d.
curve D(3).
e.
curve D(1) or curve D(4).
110. If an increase in price from $1 to $2 per unit leads to an increase in quantity supplied from 20 to 100 units, then the
value of the price elasticity of supply is:
a.
0.38.
b.
2.
c.
2.67.
d.
4.
e.
8.
111. If price increases from $45 to $55, the market quantity supplied increases from 20 units per week to 30 units per
week. The price elasticity of supply is:
Name:
Class:
Date:
Chapter 05: Elasticity of Demand and Supply
a.
0.5.
b.
1.
c.
1.8333.
d.
2.25.
e.
2.
e
112. If the price elasticity of supply in the kiwi fruit industry equals 1, supply is:
a.
perfectly elastic.
b.
relatively elastic.
c.
unit elastic.
d.
relatively inelastic.
e.
perfectly inelastic.
c
113. If an increase in price from $1.20 to $2 per unit leads to an increase in quantity supplied from 20 to 100 units, then:
a.
supply is perfectly elastic.
b.
supply is perfectly inelastic.
c.
supply is unit elastic.
d.
supply is elastic.
e.
supply is inelastic.
114. The supply of paintings by Van Gogh is most likely to be:
a.
relatively elastic because supply is limited.
b.
relatively inelastic because supply is limited.
c.
perfectly elastic because the paintings are luxury goods.
d.
perfectly inelastic because supply is limited.
e.
unit elastic.
115. The supply of a product will be more elastic if:
a.
the good has few substitutes.
b.
the time the producer has to adjust to a price change is long.
c.
the time frame for adjusting to price changes is short.
d.
demand is elastic.
e.
demand is inelastic.
116. Table 5.5 shows the quantity supplied and the quantity demanded for restaurant meals at different prices. Use the
information in the table below to calculate the price elasticity of supply for restaurant meals.
Table 5.5
Table 5.5
Table 5.5
Quantity
Name:
Class:
Date:
Chapter 05: Elasticity of Demand and Supply
demanded
Price
Table 5.5
200
$10
Table 5.5
150
$20
a.
7
b.
2
c.
1/2
d.
3/5
e.
5/3
d
117. A common determinant of both the price elasticity of demand and the price elasticity of supply for a product is:
a.
the availability of close substitutes for the product.
b.
the proportion of the consumer’s budget spent on the product.
c.
the length of the adjustment period considered.
d.
the additional cost of increasing production.
e.
the availability of substitutes in production for the product.
c
118. One determinant of the price elasticity of supply is:
a.
the price elasticity of demand.
b.
how rapidly costs increase when a firm increases its output.
c.
whether the production process relies heavily on capital or on labor.
d.
the number and closeness of available substitutes.
e.
whether the product is a normal good or an inferior good.
b
119. If supply is perfectly elastic, the supply curve is:
a.
vertical.
b.
horizontal.
c.
downward sloping.
d.
upward sloping.
e.
u-shaped.
b
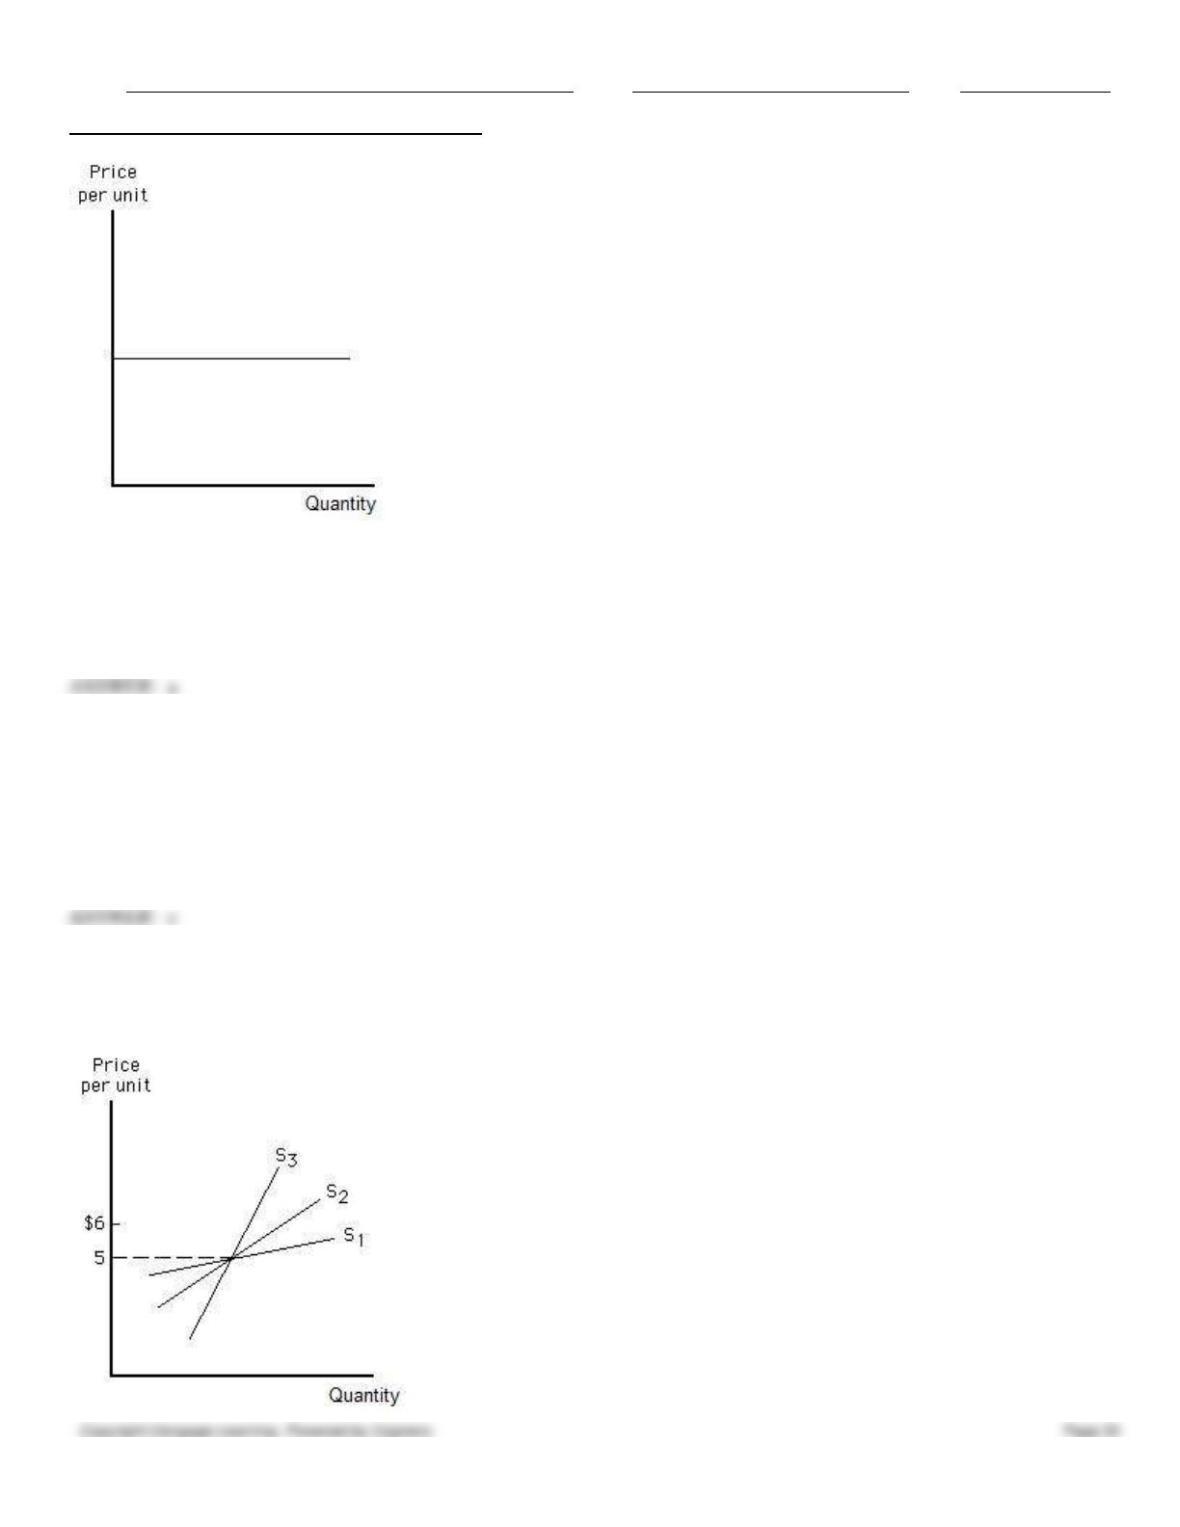
120. Figure 5.8 shows a horizontal line. The curve shown in the figure below could represent a:
Figure 5.8
Name:
Class:
Date:
Chapter 05: Elasticity of Demand and Supply
a.
perfectly elastic demand or supply curve.
b.
perfectly inelastic supply curve or a perfectly elastic demand curve.
c.
perfectly elastic supply curve or a perfectly inelastic demand curve.
d.
perfectly inelastic supply or demand curve.
e.
perfectly inelastic supply curve or a demand that is unit elastic.
a
121. The supply curve for dorm rooms on a university campus is likely to be:
a.
downward sloping.
b.
relatively flat.
c.
vertical.
d.
horizontal.
e.
upward sloping.
c
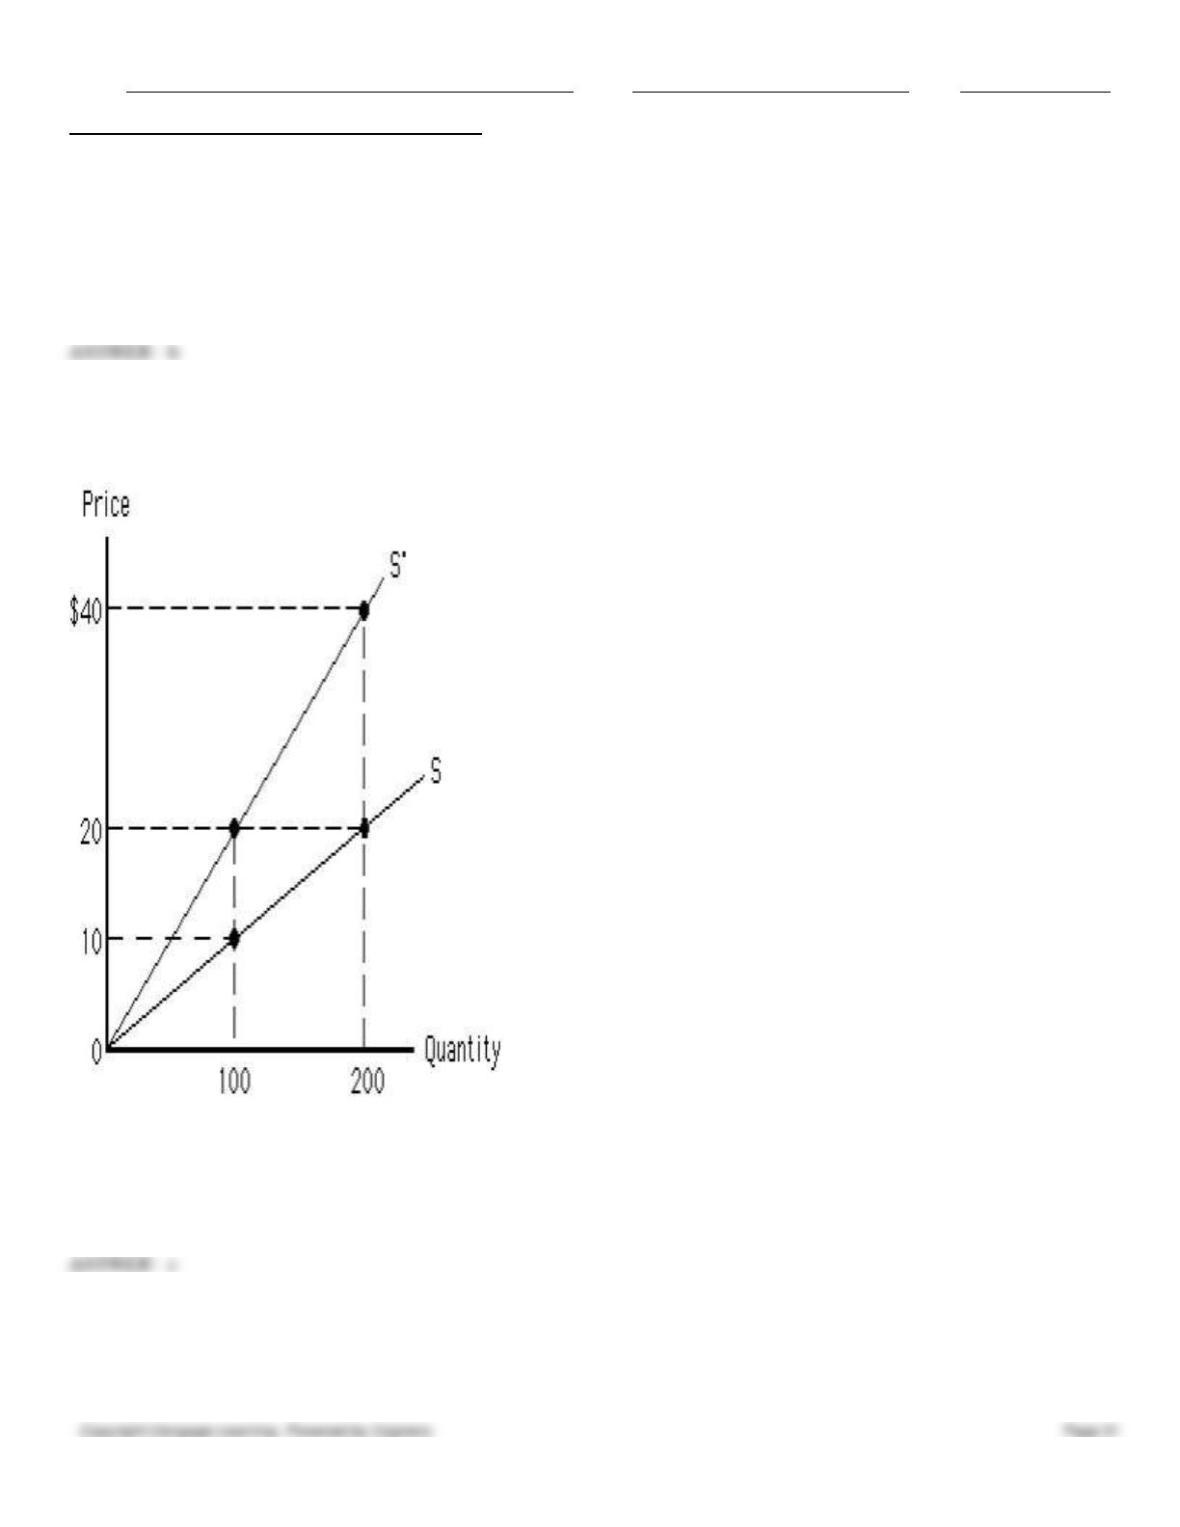
122. Figure 5.9 shows three upward-sloping linear supply curves. Which of the following supply curves is the most elastic
and which is the least elastic between the prices of $5 and $6?
Figure 5.9
Name:
Class:
Date:
Chapter 05: Elasticity of Demand and Supply
a.
S1 is the most elastic; S2 is the least elastic.
b.
S1 is the most elastic; S3 is the least elastic.
c.
S3 is the most elastic; S1 is the least elastic.
d.
S3 is the most elastic; S2 is the least elastic.
e.
S2 is the most elastic; S3 is the least elastic.
b
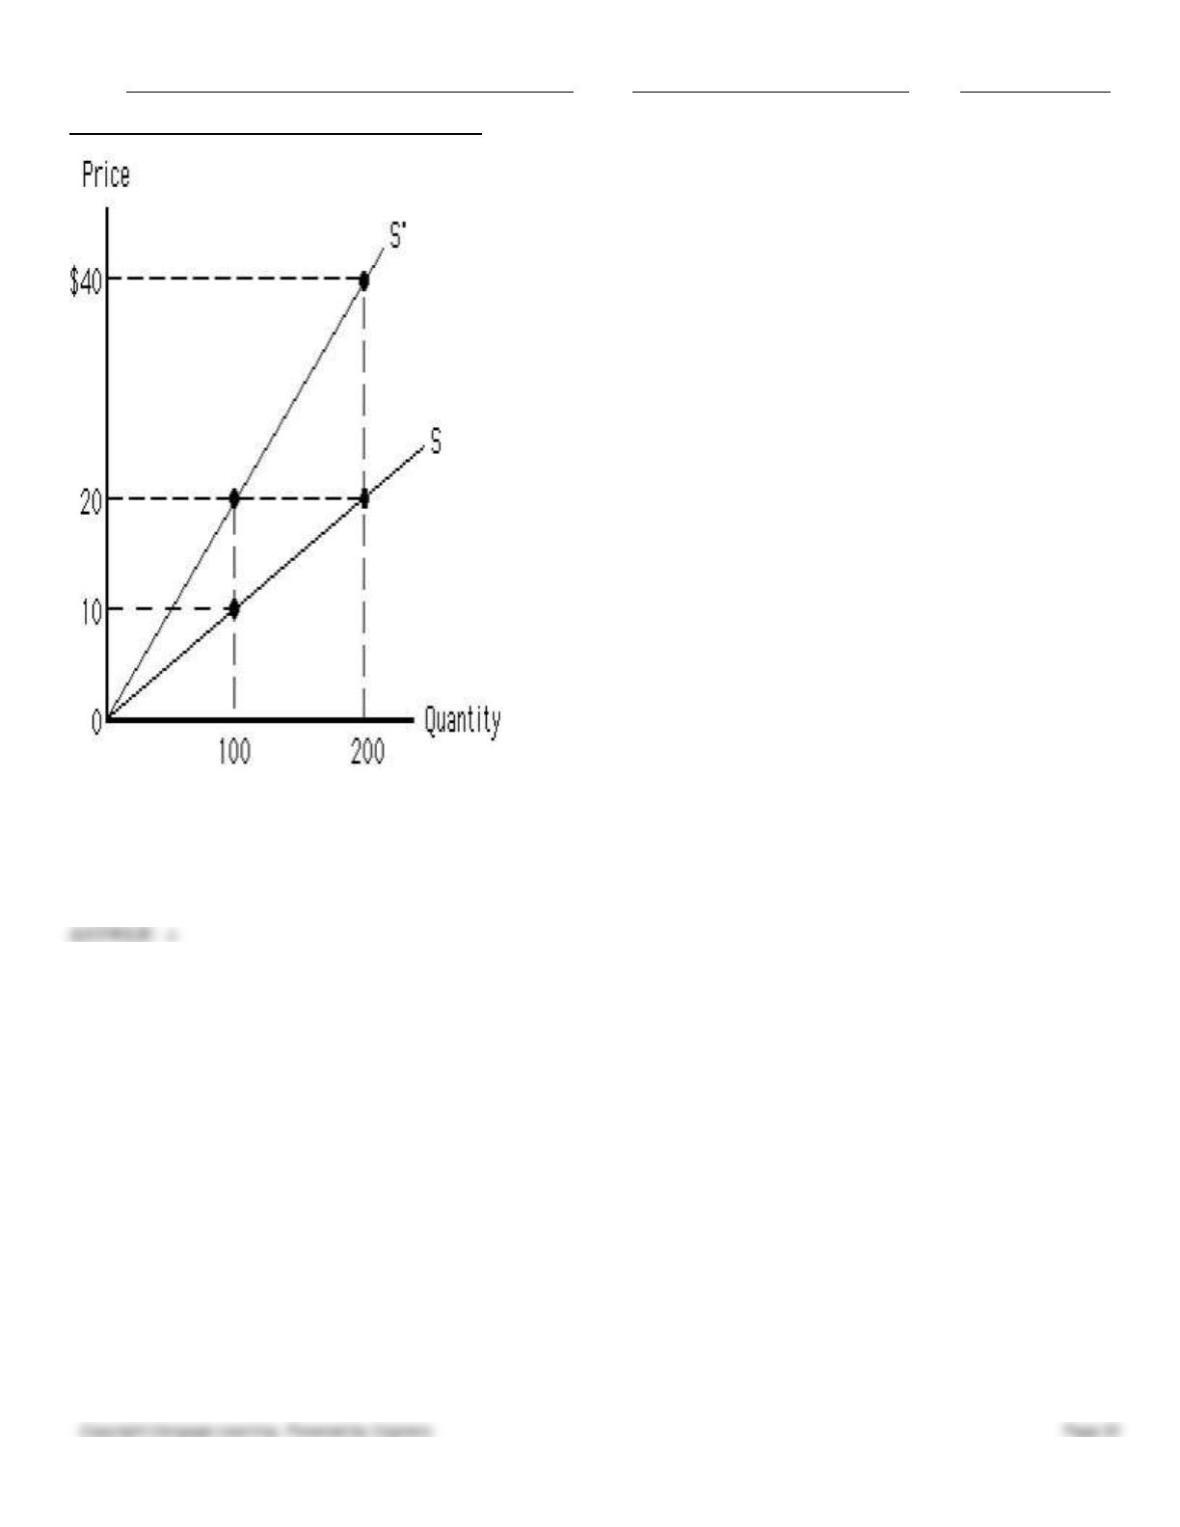
123. Figure 5.10 shows two upward-sloping linear supply curves that pass through the origin. The price elasticity of
supply between $10 and $20 on the supply curve S is _____.
Figure 5.10
a.
0
b.
infinity
c.
1
d.
2
e.
10
c
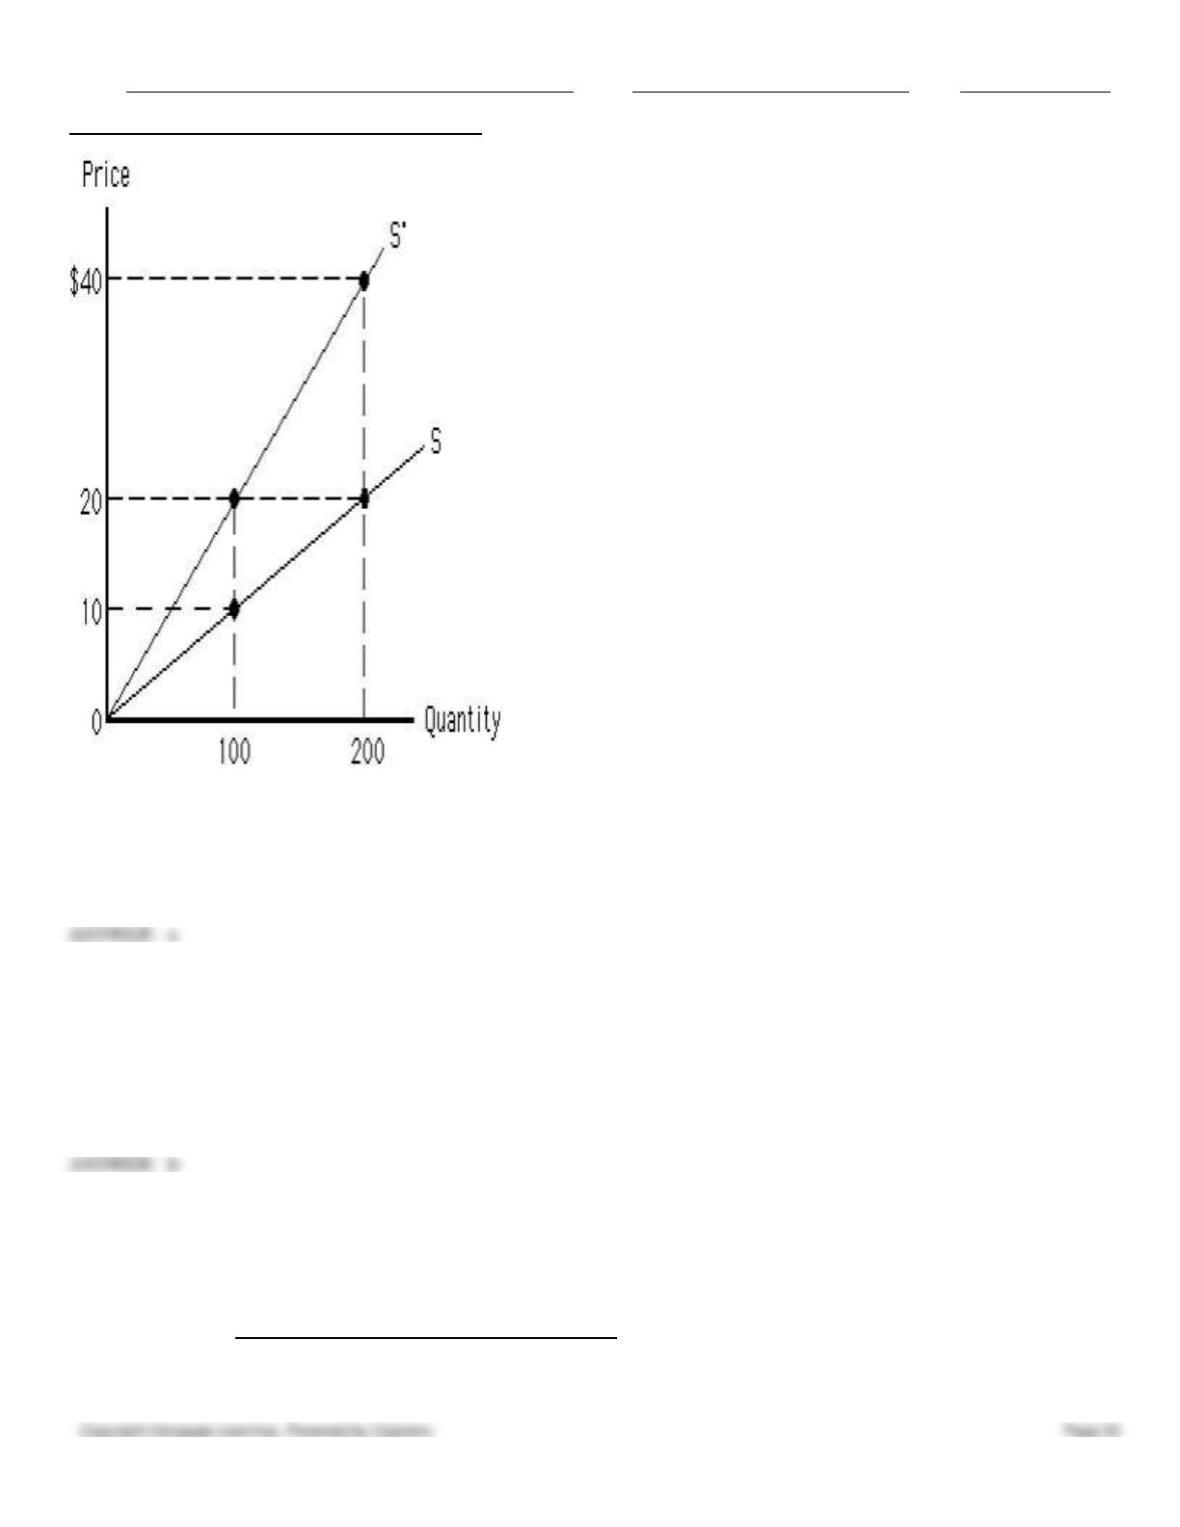
124. Figure 5.10 shows two upward-sloping linear supply curves that pass through the origin. The price elasticity of
supply between $20 and $40 on the supply curve S’ is _____.
Figure 5.10
Name:
Class:
Date:
Chapter 05: Elasticity of Demand and Supply
a.
0
b.
infinity
c.
1
d.
2
e.
10
c
125. Figure 5.10 shows two upward-sloping linear supply curves that pass through the origin. Which supply curve is more
elastic in the figure below?
Figure 5.10
Name:
Class:
Date:
Chapter 05: Elasticity of Demand and Supply
a.
Both S and S’ have the same elasticity.
b.
S is more elastic at lower prices, and S’ is more elastic at higher prices.
c.
S is more elastic at higher prices, and S’ is more elastic at lower prices.
d.
S is more elastic than S’.
e.
S’ is more elastic than S.
a
126. Inferior goods have an income elasticity of demand that is:
a.
positive.
b.
negative.
c.
zero.
d.
greater than 1 in absolute value.
e.
equal to 1 in absolute value.
127. Table 5.6 shows the change in the quantity demanded for Good A and Good B as a result of a change in income. Use
the information in the table below to calculate the value of the income elasticity of demand for Good A.
Table 5.6
Quantity
Income
Good A
100
$1,000
120
$2,000
Name:
Class:
Date:
Chapter 05: Elasticity of Demand and Supply
Good B
200
$20
140
$35
a.
1
b.
2/9
c.
3/11
d.
11/3
e.
9/2
c
128. Table 5.6 shows the change in the quantity demanded for Good A and Good B as a result of a change in income. Use
the information in the table below to calculate the value of the income elasticity of demand for Good B.
Table 5.6
Quantity
Income
Good A
100
$1,000
120
$2,000
Good B
200
$20
140
$35
a.
-11/17
b.
17/9
c.
10/3
d.
-3/10
e.
1
a
129. Goods with an income elasticity of demand greater than 1 are called:
a.
necessities.
b.
inferior goods.
c.
substitutes.
d.
luxuries.
e.
complements.
d
130. As the economy recovers from a recession, we should expect that the:
a.
demand for inferior goods will fall and the demand for normal goods will rise.
b.
demand for both inferior and normal goods will rise.
c.
demand for inferior goods will rise and the demand for normal goods will fall.
d.
demand for both inferior and normal goods will fall.
e.
demand for inferior goods and normal goods will remain the same.
a
131. Demand for a necessity, such as food, is:
a.
both income and price inelastic.
b.
income inelastic and price elastic.

Name:
Class:
Date:
Chapter 05: Elasticity of Demand and Supply
c.
income elastic and price inelastic.
d.
both income and price elastic.
e.
income elastic and perfectly price inelastic.
132. Income elasticity of demand is greater than zero for all of the following except:
a.
restaurant meals.
b.
beer.
c.
owner-occupied housing.
d.
food items.
e.
rental housing.
133. For which of the following goods is the value of income elasticity most likely to be negative?
a.
Macaroni and cheese.
b.
Champagne.
c.
Airline tickets.
d.
Clothes.
e.
Toothpaste.
a
134. An inferior good is:
a.
any good of low quality.
b.
one that consumers buy less of as the price rises.
c.
one that consumers buy less of as their income rises.
d.
one that has few substitutes.
e.
any good made with inexpensive inputs.
c
135. In order to prove that macaroni is an inferior good, we could test the _____ of macaroni and get a _____.
a.
cross-price elasticity; negative number.
b.
income elasticity; number less than 1.
c.
income elasticity; positive number.
d.
price elasticity of demand; number greater than negative 1.
e.
income elasticity; negative number.
e
136. A 5 percent increase in income leads to a 10 percent increase in the quantity demanded for a service. This service is
a(n) _____ good, and the demand is _____.
a.
normal; elastic
b.
normal; inelastic
c.
normal; unit elastic
d.
inferior; elastic
e.
inferior; inelastic

Name:
Class:
Date:
Chapter 05: Elasticity of Demand and Supply
a
137. If the income elasticity of demand for a service is 0.6, then a 5 percent increase in income will generate a _____ in
quantity demanded.
a.
3 percent decrease
b.
3 percent increase
c.
8.33 percent decrease
d.
8.33 percent increase
e.
0.12 percent decrease
138. Economists distinguish between normal and inferior goods using:
a.
the price elasticity of demand.
b.
the price elasticity of supply.
c.
the income elasticity of demand.
d.
the cross-price elasticity of demand.
e.
tax incidence.
c
139. Luxury goods are:
a.
price inelastic.
b.
income inelastic.
c.
income elastic.
d.
goods with negative income elasticity.
e.
goods with positive price elasticity.
c
140. The value of the cross-price elasticity of demand between golf balls and golf clubs is:
a.
negative.
b.
positive.
c.
zero.
d.
greater than 1 but less than 3.
e.
equal to 1.
a
141. The cross-price elasticity of demand measures the:
a.
elasticity of demand at the intersection of the supply and demand curves.
b.
elasticity of supply at the intersection of supply and demand curves.
c.
relative elasticity of supply and demand at the intersection of the two curves.
d.
relationship between the demand for one good and the price of another.
e.
relationship between the demand for one good and the supply of another.
142. The cross-price elasticity of demand between milk and soft drinks is likely to be:

Name:
Class:
Date:
Chapter 05: Elasticity of Demand and Supply
a.
negative, because the goods are complements.
b.
positive, because the goods are complements.
c.
negative, because the goods are substitutes.
d.
positive, because the goods are substitutes.
e.
zero, because the goods are not usually consumed by the same person at one time.
143. If the cross-price elasticity of demand is −3, then:
a.
the goods are substitutes.
b.
the goods are unrelated.
c.
one of the two goods is an inferior good
d.
one of the two goods is a luxury.
e.
the goods are complements.
144. If an increase in the price of peanut butter causes a decline in the demand for jelly, then:
a.
the goods are substitutes.
b.
jelly is an inferior good.
c.
the goods are complements.
d.
both goods are necessities.
e.
peanut butter is an inferior good.
145. A 10 percent increase in the price of root beer causes a 5 percent increase in the quantity demanded of orange soda.
This means that:
a.
root beer and orange soda are substitutes.
b.
root beer and orange soda are complements.
c.
the cross-price elasticity of demand is 1.
d.
the cross-price elasticity of demand is equal to 2.
e.
the cross-price elasticity of demand is equal to −2.
146. The cross-price elasticity of demand is used to determine whether:
a.
a product is an inferior or normal good.
b.
a product is a necessity or a luxury.
c.
two products are substitutes or complements.
d.
price and total revenue are directly or inversely related.
e.
the product’s demand curve is linear.
147. The percentage change in the demand for film divided by the percentage change in the price of cameras indicates:
a.
the cross-price elasticity of demand between film and cameras.
b.
the cross-price elasticity of demand for photographs.
c.
the price elasticity of demand for film.

Name:
Class:
Date:
Chapter 05: Elasticity of Demand and Supply
d.
the price elasticity of demand for cameras.
e.
the income elasticity of demand between film and camera.
148. The cross-price elasticity of demand between pancakes and waffles is positive. This indicates all of the following
except one. Which is the exception?
a.
Pancakes and waffles are substitutes.
b.
An increase in the price of pancakes will shift the demand curve for waffles to the right.
c.
An increase in the price of waffles will shift the demand curve for pancakes to the right.
d.
A decrease in the supply of waffles will shift the demand curve for pancakes to the right.
e.
The demand for pancakes and the demand for waffles are price elastic.
149. In order to prove that Coca Cola and 7-Up are substitutes, one should test the _____ and get a _____.
a.
price elasticity of demand; number less than −1
b.
income elasticity; positive number
c.
cross-price elasticity; negative number
d.
price elasticity of demand; number greater than −1
e.
cross-price elasticity; positive number
150. If the cross-price elasticity of demand between Good x and Good y is 0.4, then:
a.
the demand for good x is highly responsive to changes in the price of good y.
b.
a 10 percent increase in the price of good y leads to a 0.4 percent increase in the quantity demanded of good x.
c.
a 10 percent decrease in the price of good y leads to a 4 percent decrease in the demand for good y.
d.
good x and good y are complements.
e.
good x is a normal good and good y is an inferior good.