92 ❖ Chapter 5/Elasticity and Its Application
11. Necessities tend to have inelastic demands, whereas luxuries tend to have elastic demands.
12. The demand for desserts tends to be more inelastic than the demand for red velvet cake.
13. Demand is inelastic if the price elasticity of demand is greater than 1.
14. Demand for a good is said to be inelastic if the quantity demanded increases substantially when the price falls
by a small amount.
15. Demand for a good is said to be inelastic if the quantity demanded increases slightly when the price falls by a
large amount.
16. The demand for gasoline will respond more to a change in price over a period of five weeks than over a period
of five years.
17. Even the demand for a necessity such as gasoline will respond to a change in price, especially over a longer
time horizon.
18. Suppose that when the price rises by 20% for a particular good, the quantity demanded of that good falls by
10%. The price elasticity of demand for this good is equal to 2.0.
19. Suppose that when the price rises by 10% for a particular good, the quantity demanded of that good falls by
20%. The price elasticity of demand for this good is equal to 2.0.
20. If the price of calculators increases by 15 percent and the quantity demanded per week falls by 45 percent as a
result, then the price elasticity of demand is 3.
Chapter 5/Elasticity and Its Application/ ❖ 93
21. If we observe that when the price of chocolate increases by 10%, quantity demanded falls by 5%, then the de-
mand for chocolate is price inelastic.
22. If we observe that when the price of chocolate decreases by 10%, quantity demanded increases by 25%, then
the demand for chocolate is price elastic.
23. The flatter the demand curve that passes through a given point, the more inelastic the demand.
24. The flatter the demand curve that passes through a given point, the more elastic the demand.
25. A linear, downward-sloping demand curve has a constant elasticity but a changing slope.
26. Price elasticity of demand along a linear, downward-sloping demand curve increases as price falls.
27. Price elasticity of demand along a linear, downward-sloping demand curve decreases as price falls.
28. The midpoint method is used to calculate elasticity between two points because it gives the same answer re-
gardless of the direction of the change.
29. An advantage of using the midpoint method to calculate the price elasticity of demand is that it uses the metric
system.
30. If demand is perfectly elastic, the demand curve is horizontal, and the price elasticity of demand equals 1.
94 ❖ Chapter 5/Elasticity and Its Application
31. If demand is perfectly inelastic, the demand curve is vertical, and the price elasticity of demand equals 0.
32. If the price elasticity of demand is equal to 0, then demand is unit elastic.
33. If the price elasticity of demand is equal to 1, then demand is unit elastic.
34. If we observe that when the price of chocolate increases by 10%, total revenue increases by 10%, then the de-
mand for chocolate is unit price elastic.
35. Along the elastic portion of a linear demand curve, total revenue rises as price rises.
36. If a firm is facing elastic demand, then the firm should decrease price to increase revenue.
37. If a firm is facing inelastic demand, then the firm should decrease price to increase revenue.
38. When demand is inelastic, a decrease in price increases total revenue.
39. The income elasticity of demand is defined as the percentage change in quantity demanded divided by the per-
centage change in income.
40. The income elasticity of demand is defined as the percentage change in quantity demanded divided by the per-
centage change in price.
Chapter 5/Elasticity and Its Application/ ❖ 95
41. Normal goods have negative income elasticities of demand, while inferior goods have positive income elastici-
ties of demand.
42. If the income elasticity of demand for a good is negative, then the good must be an inferior good.
43. If we observe that when consumers’ incomes rise by 10%, the quantity demanded of ice cream increases by
5%, then ice cream is an inferior good.
44. If the cross-price elasticity of demand for two goods is negative, then the two goods are substitutes.
45. If the cross-price elasticity of demand for two goods is negative, then the two goods are complements.
46. Cross-price elasticity of demand measures how the quantity demanded of one good changes as the price of
another good changes.
47. Cross-price elasticity is used to determine whether goods are inferior or normal goods.
48. Cross-price elasticity is used to determine whether goods are substitutes or complements.
49. The cross-price elasticity of garlic salt and onion salt is -2, which indicates that garlic salt and onion salt are
substitutes.
50. The cross-price elasticity of demand for bacon and eggs likely would be negative because bacon and eggs are
complements for many people.
96 ❖ Chapter 5/Elasticity and Its Application
51. Supply and demand both tend to be more elastic in the long run and more inelastic in the short run.
52. Price elasticity of supply measures how much the quantity supplied responds to changes in the price.
53. If the price elasticity of supply is 2 and the quantity supplied decreases by 6%, then the price must have de-
creased by 3%.
54. Supply is said to be inelastic if the quantity supplied responds substantially to changes in the price and elastic
if the quantity supplied responds only slightly to price.
55. Supply tends to be more elastic in the short run and more inelastic in the long run.
56. When the price of knee braces increased by 25 percent, the Brace Yourself Company increased its quantity
supplied of knee braces per week by 75 percent. BYC’s price elasticity of supply of knee braces is 0.33.
57. If a supply curve is horizontal, then supply is said to be perfectly elastic, and the price elasticity of supply ap-
proaches infinity.
58. If we observe that when the price of ice cream rises by 10%, ice cream manufacturers increase the quantity
supplied of ice cream by 20%, then the price elasticity of supply is 2.
59. If a t-shirt manufacturer supplies 1,000 t-shirts per week when the price of t-shirts is $10 and supplies 1,200 t–
shirts per week when the price of t-shirts is $12, the price elasticity of supply is 2.
60. A government program that reduces land under cultivation hurts farmers but helps consumers.
Chapter 5/Elasticity and Its Application/ ❖ 97
61. A government program that pays farmers not to plant corn on part of their land can help farmers not only
through the subsidy payments to farmers who participate in the program but also by raising the market price of
corn.
62. A discovery that increases wheat yields per acre hurts farmers by increasing supply and lowering their total
revenues.
63. A discovery that increases wheat yields per acre helps farmers by increasing both supply and total revenues.
64. OPEC failed to maintain a high price of oil in the long run, partly because both the supply of oil and the de-
mand for oil are more elastic in the long run than in the short run.
65. The OPEC oil cartel has difficulty maintaining high prices in the long run because the supply of oil is more
inelastic in the long run than in the short run.
66. Drug interdiction, which reduces the supply of drugs, may decrease drug-related crime because the demand for
drugs is inelastic.
67. Drug interdiction, which reduces the supply of drugs, will likely be a less effective policy than educating con-
sumers to reduce their demand for drugs because the drug interdiction policy will lower drug prices and reduce
the quantity of drugs demanded.
68. A “Just Say No” drug education policy that successfully educates consumers to reduce their demand for drugs
will lower drug prices and reduce the quantity of drugs demanded.
98 ❖ Chapter 5/Elasticity and Its Application
SHORT ANSWER
1. Consider the following pairs of goods. For which of the two goods would you expect the demand to be more
price elastic? Why?
a.
water or diamonds
b.
insulin or nasal decongestant spray
c.
food in general or breakfast cereal
d.
gasoline over the course of a week or gasoline over the course of a year
e.
personal computers or IBM personal computers
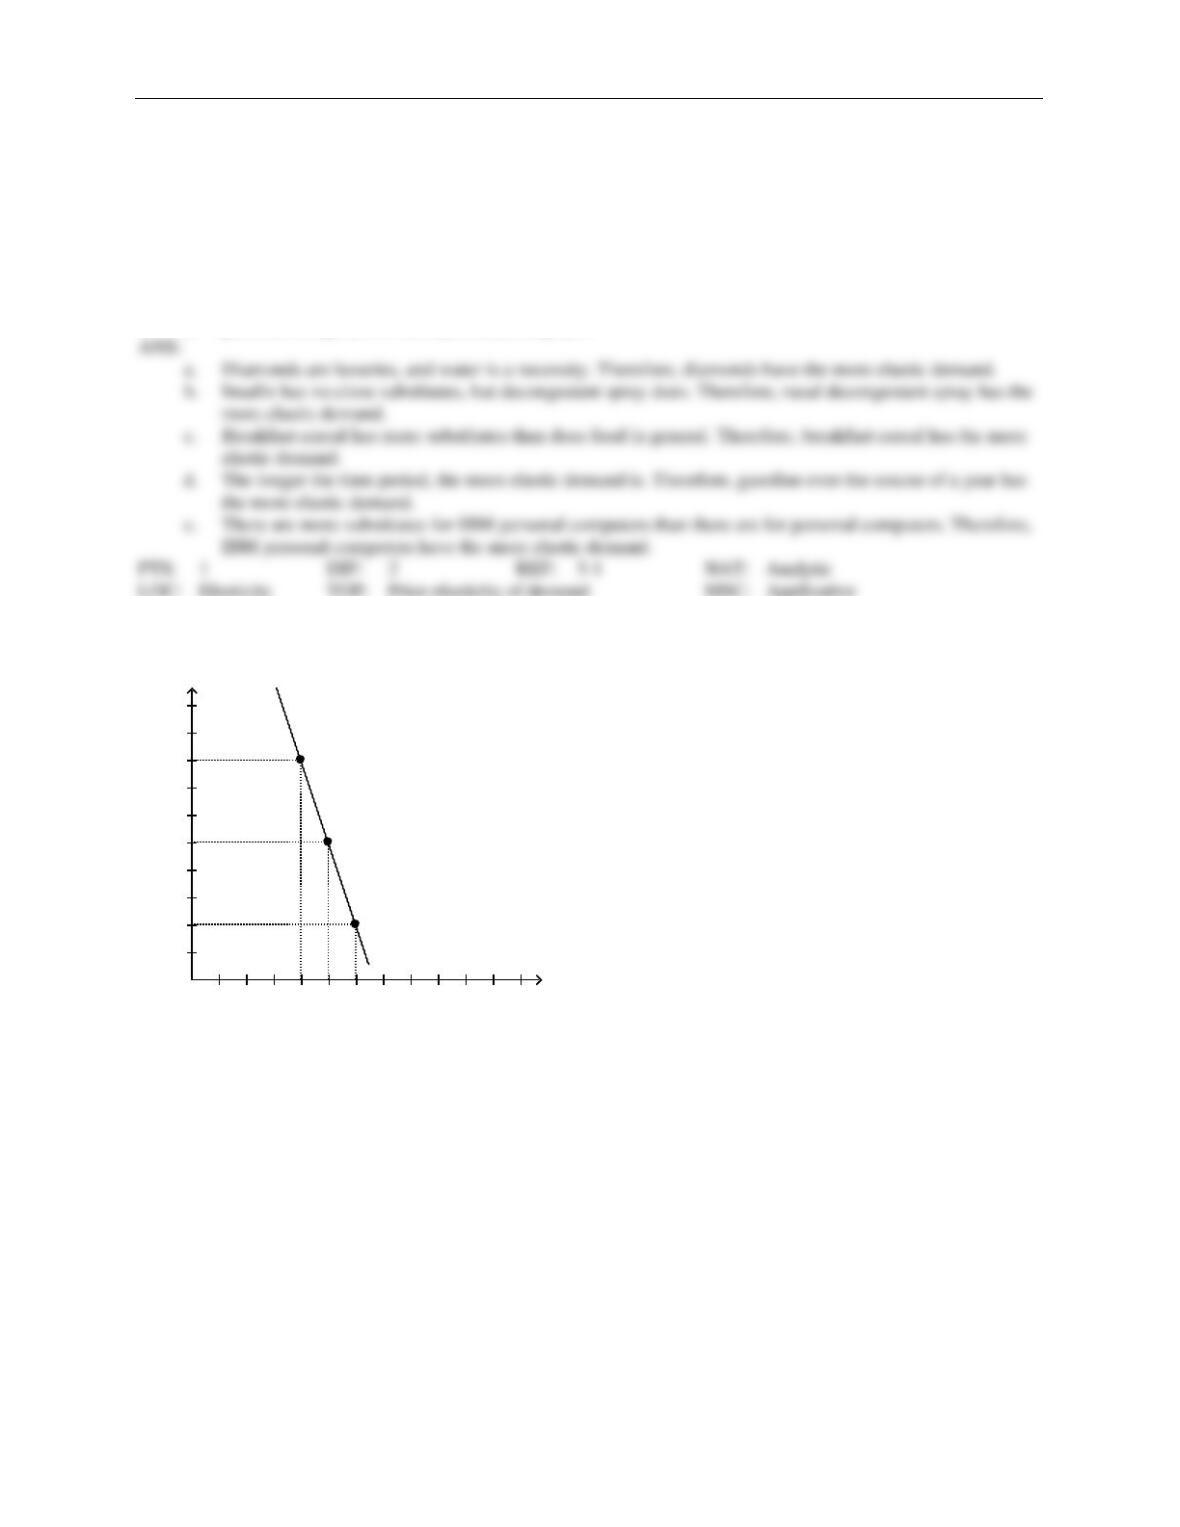
2. You own a small town movie theatre. You currently charge $5 per ticket for everyone who comes to your
movies. Your friend who took an economics course in college tells you that there may be a way to increase
your total revenue. Given the demand curves shown, answer the following questions.
Adult Demand
10 20 30 40 50 60 70 80 90 100 Quantity
1
2
3
4
5
6
7
8
9
10 Price
a.
Diamonds are luxuries, and water is a necessity. Therefore, diamonds have the more elastic demand.
Chapter 5/Elasticity and Its Application/ ❖ 99
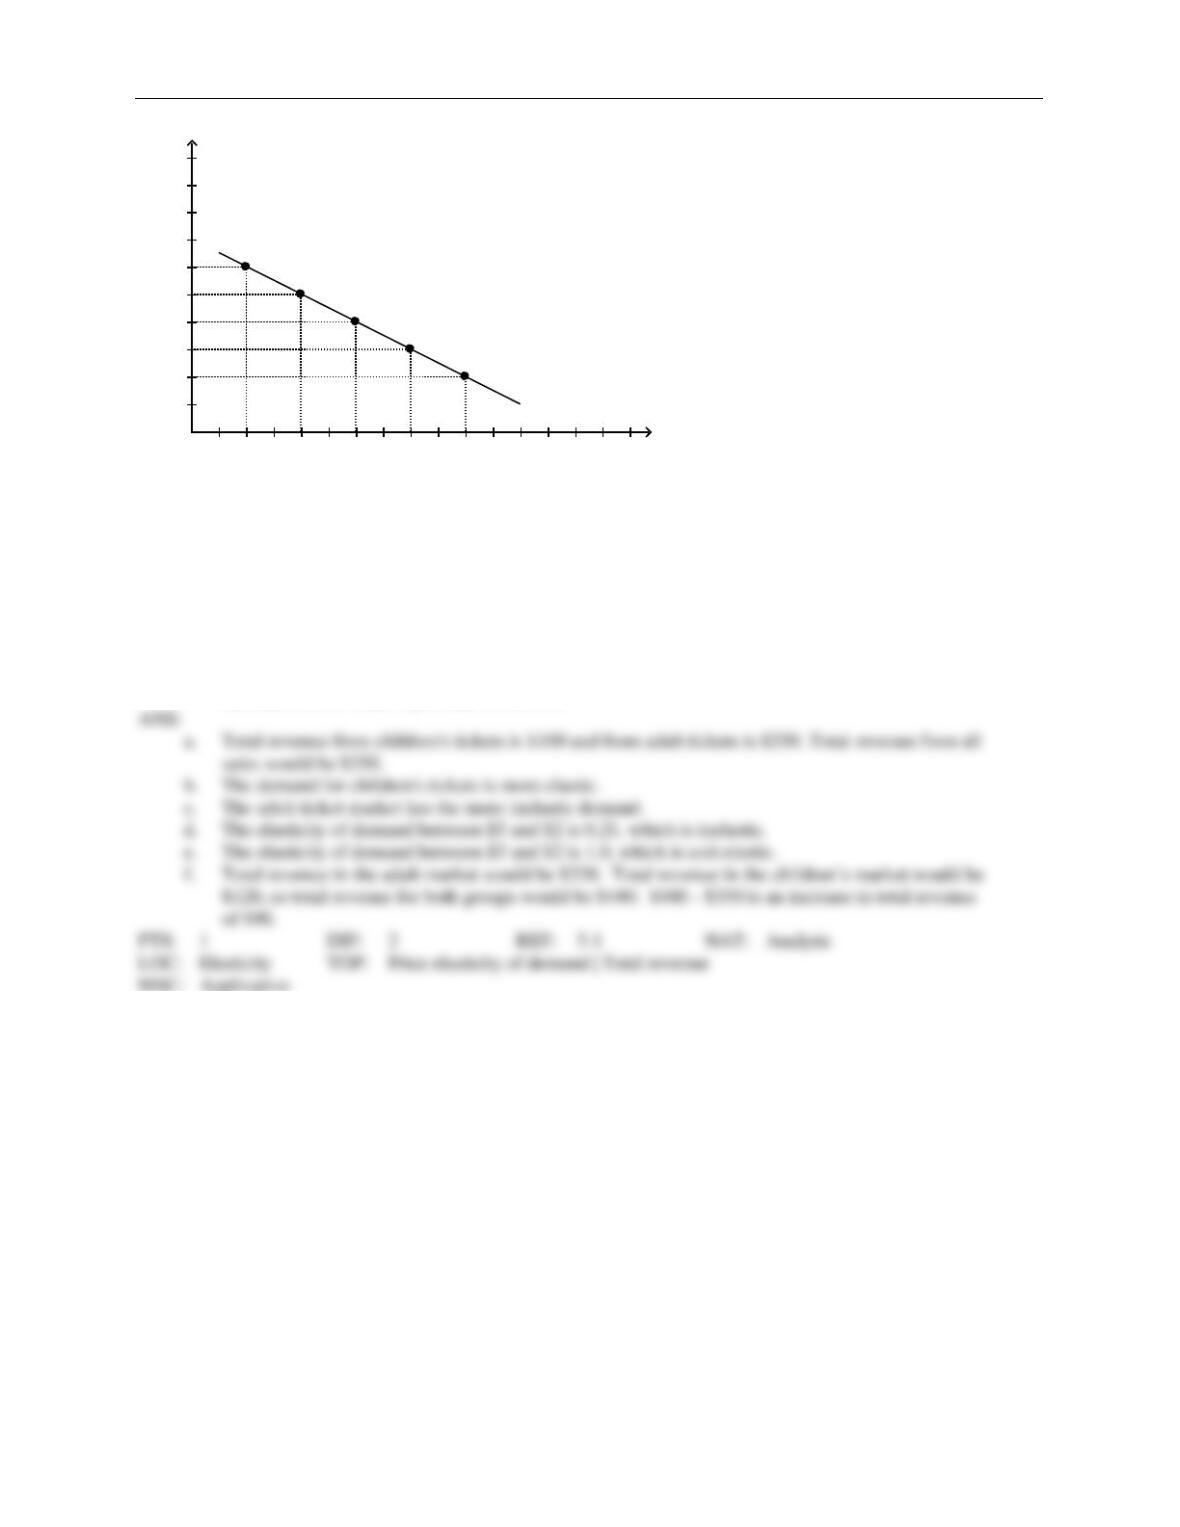
Child Demand
510 15 20 25 30 35 40 45 50 55 60 65 70 Quantity
1
2
3
4
5
6
7
8
9
10 Price
a.
What is your current total revenue for both groups?
b.
The elasticity of demand is more elastic in which market?
c.
Which market has the more inelastic demand?
d.
What is the elasticity of demand between the prices of $5 and $2 in the adult market? Is this
elastic or inelastic?
e.
What is the elasticity of demand between $5 and $2 in the children’s market? Is this elastic or
inelastic?
f.
Given the graphs and what your friend knows about economics, he recommends you increase the
price of adult tickets to $8 each and lower the price of a child’s ticket to $3. How much could you
increase total revenue if you take his advice?
Total revenue from children’s tickets is $100 and from adult tickets is $250. Total revenue from all
sales would be $350.
b.
The demand for children’s tickets is more elastic.
c.
The adult ticket market has the more inelastic demand.
d.
The elasticity of demand between $5 and $2 is 0.21, which is inelastic.
e.
The elasticity of demand between $5 and $2 is 1.0, which is unit elastic.
f.
Total revenue in the adult market would be $320. Total revenue in the children’s market would be
100 ❖ Chapter 5/Elasticity and Its Application
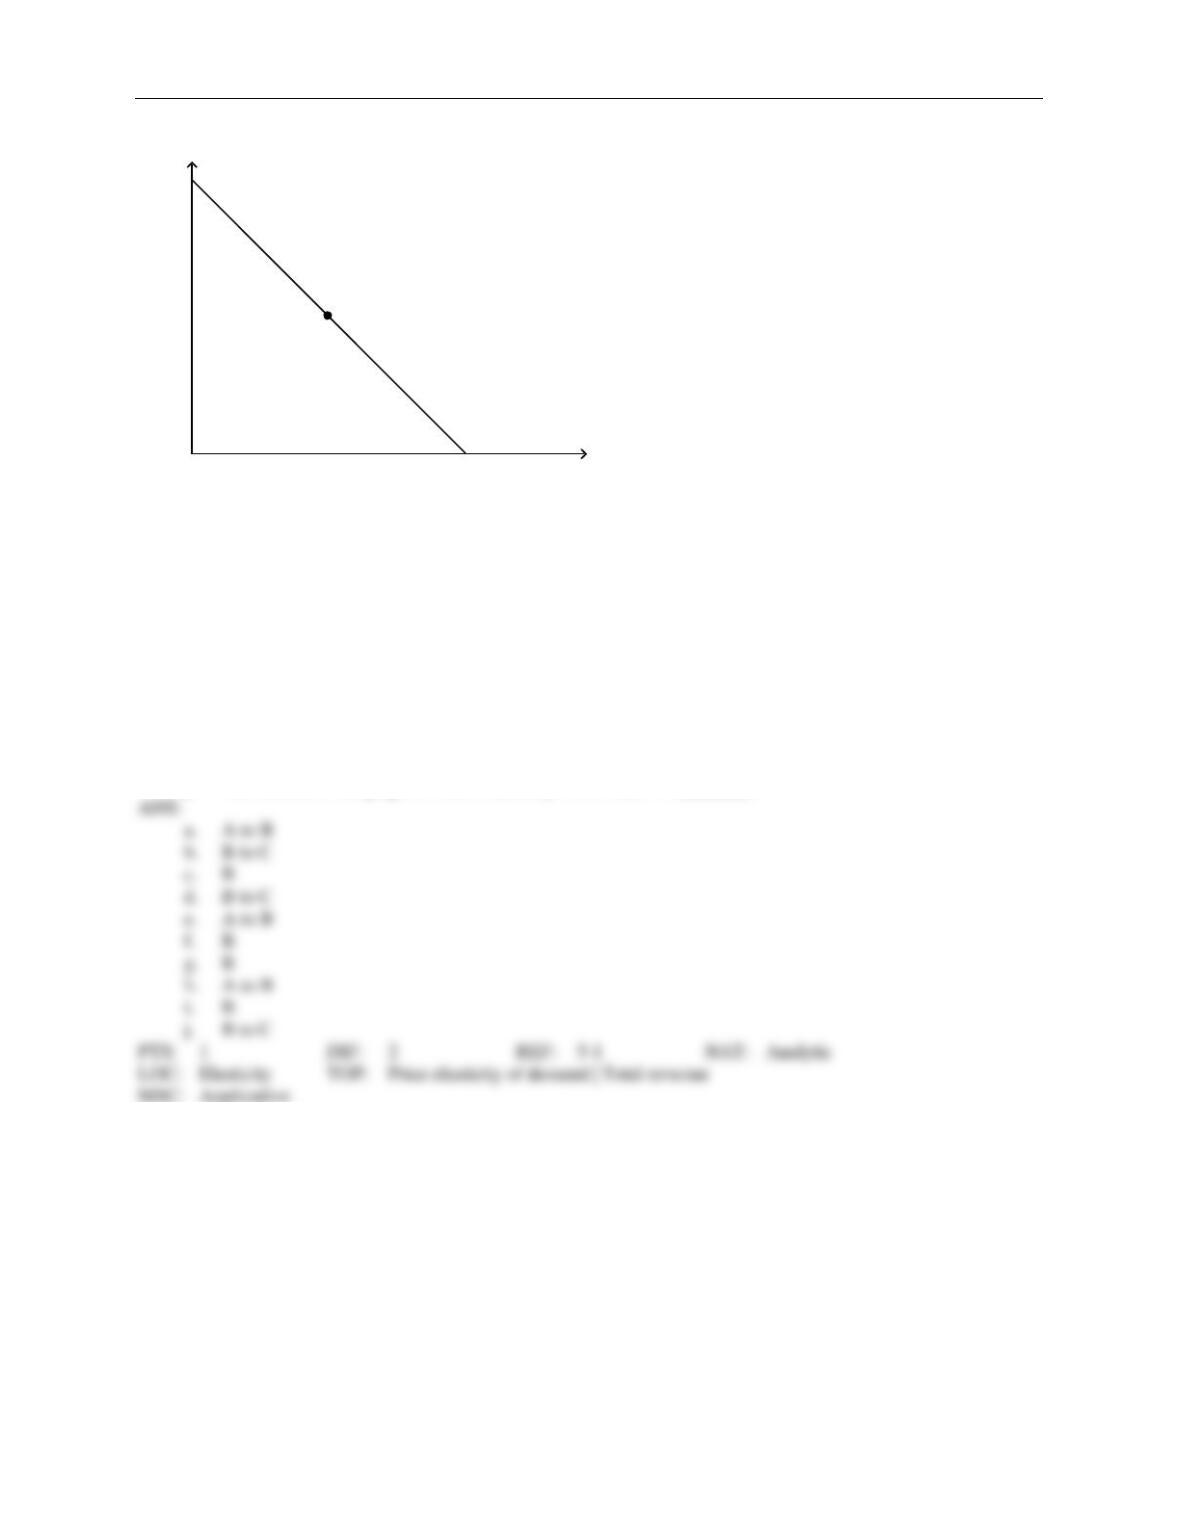
3. Use the graph shown to answer the following questions. Put the correct letter(s) in the blank.
Demand
A
B
C
Quantity
Price
a.
The elastic section of the graph is represented by section from _______.
b.
The inelastic section of the graph is represented by section from _______.
c.
The unit elastic section of the graph is represented by section _______.
d.
The portion of the graph in which a decrease in price would cause total revenue to fall would be
from _________.
e.
The portion of the graph in which a decrease in price would cause total revenue to rise would be
from _________.
f.
The portion of the graph in which a decrease in price would not cause a change in total revenue
would be _________.
g.
The section of the graph in which total revenue would be at a maximum would be _______.
h.
The section of the graph in which elasticity is greater than 1 is _______.
i.
The section of the graph in which elasticity is equal to 1 is ______.
j.
The section of the graph in which elasticity is less than 1 is _______.
a.
A to B
b.
B to C
c.
B
d.
B to C
e.
A to B
B
g.
B
h.
A to B
i.
B
j.
B to C
Chapter 5/Elasticity and Its Application/ ❖ 101
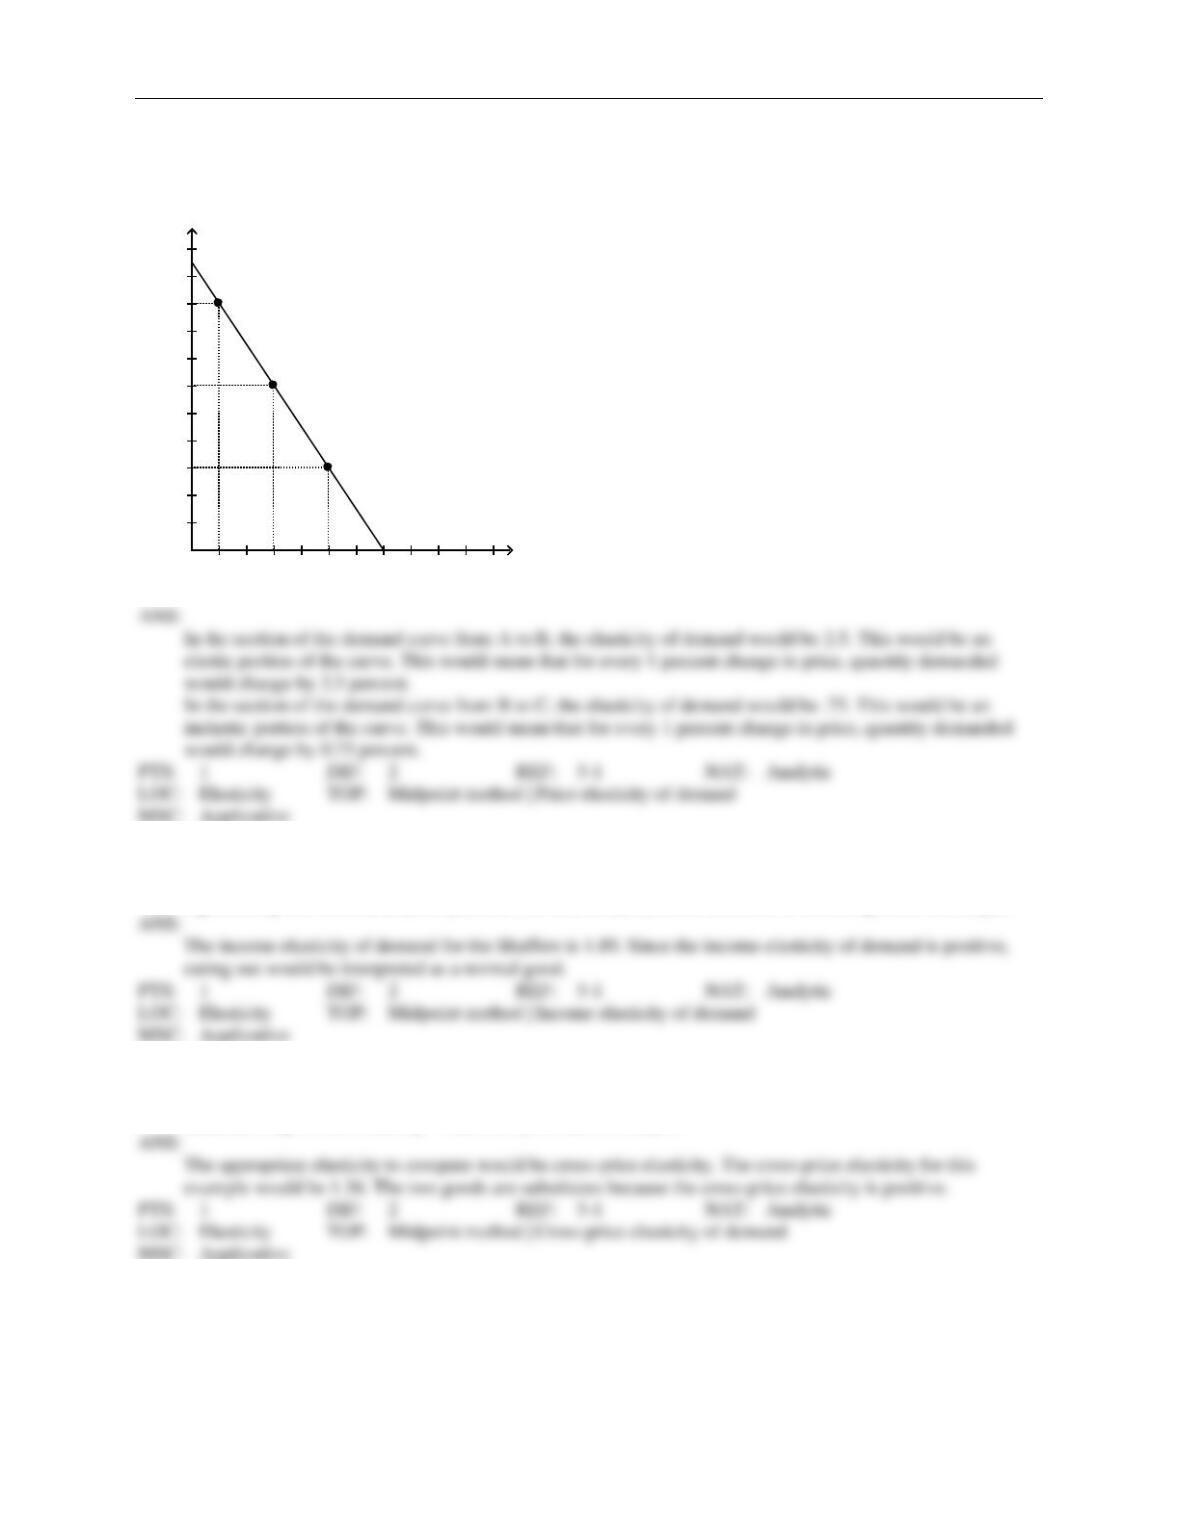
4. Using the midpoint method, compute the elasticity of demand between points A and B. Is demand along this
portion of the curve elastic or inelastic? Interpret your answer with regard to price and quantity demanded.
Now compute the elasticity of demand between points B and C. Is demand along this portion of the curve elas-
tic or inelastic?
A
B
C
Demand
100 200 300 400 500 600 700 800 900 Quantity
2
4
6
8
10
12
14
16
18
20
22
Price
5. When the Shaffers had a monthly income of $4,000, they usually ate out 8 times a month. Now that the couple
makes $4,500 a month, they eat out 10 times a month. Compute the couple’s income elasticity of demand us-
ing the midpoint method. Explain your answer. Is a restaurant meal a normal or inferior good to the couple?
6. Recently, in Smalltown, the price of Twinkies fell from $0.80 to $0.70. As a result, the quantity demanded of
Ho-Ho’s decreased from 120 to 100. What would be the appropriate elasticity to compute? Using the midpoint
method, compute this elasticity. What does your answer tell you?