Chapter 5/Elasticity and Its Application/ ❖ 41
198. Moving downward and to the right along a linear demand curve, we know that total revenue
a.
first increases, then decreases.
b.
first decreases, then increases.
c.
always increases.
d.
always decreases.
199. Total revenue will be at its largest value on a linear demand curve at the
a.
top of the curve, where prices are highest.
b.
midpoint of the curve.
c.
low end of the curve, where quantity demanded is highest.
d.
None of the above is correct.
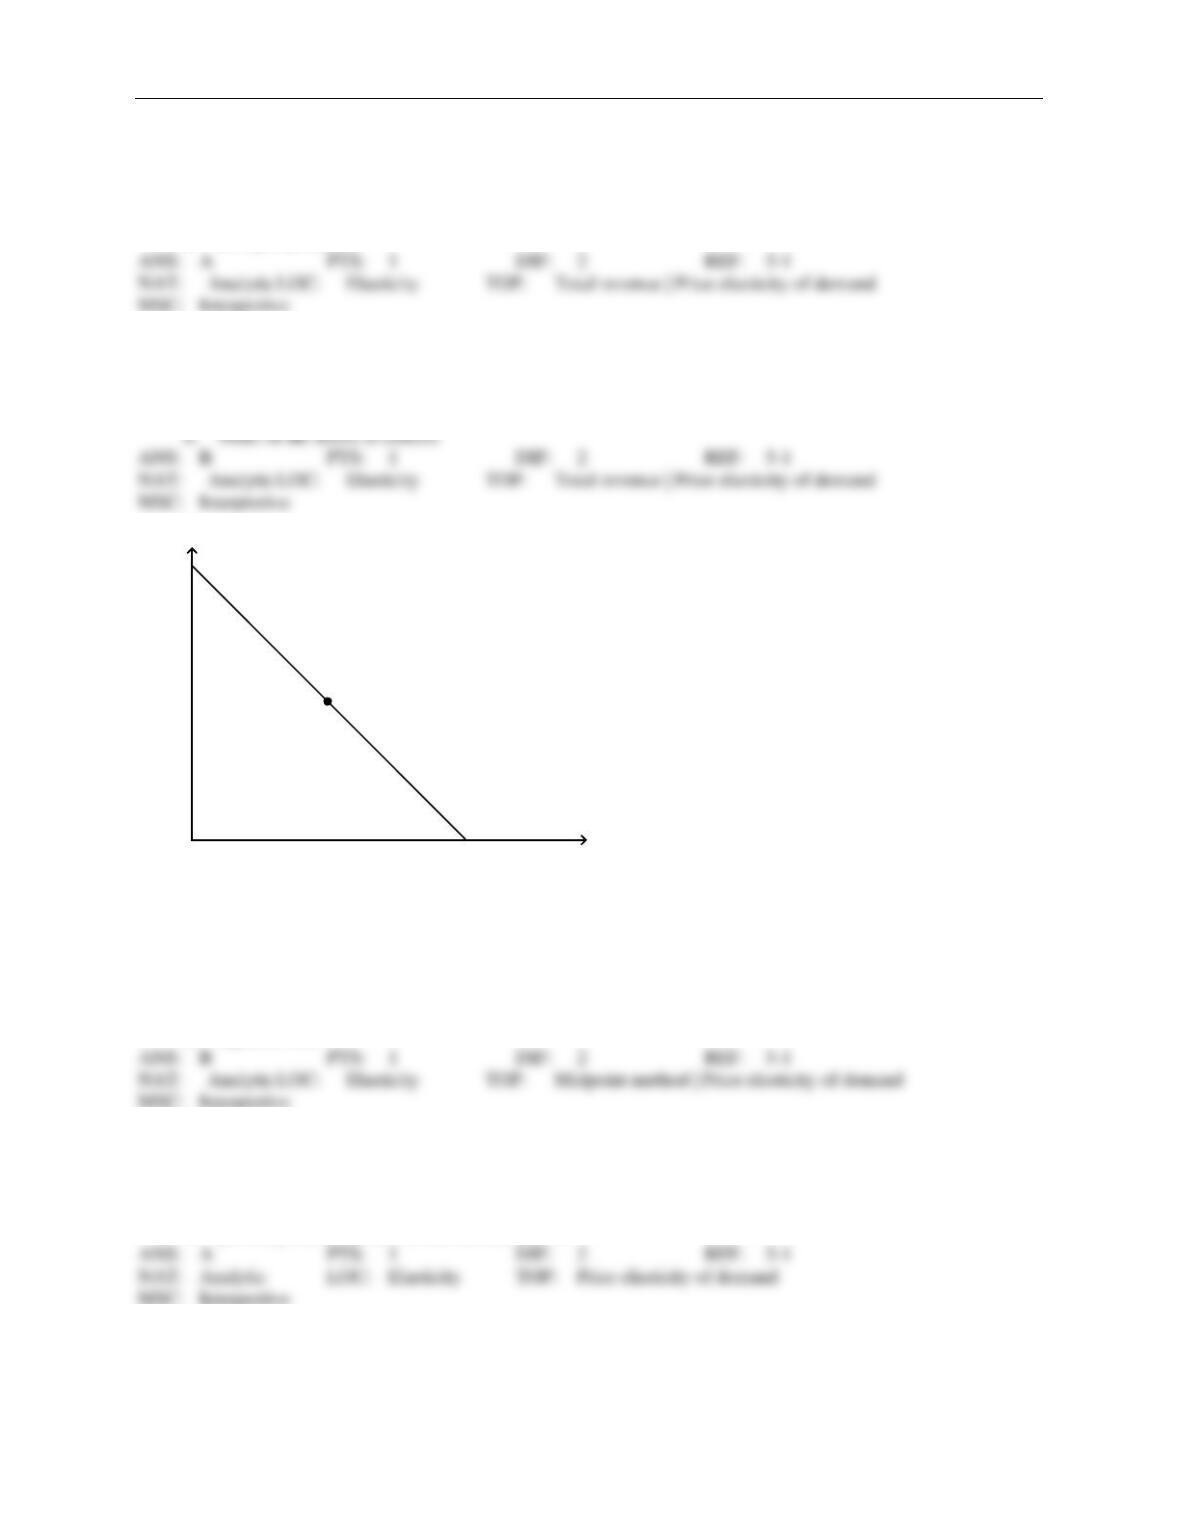
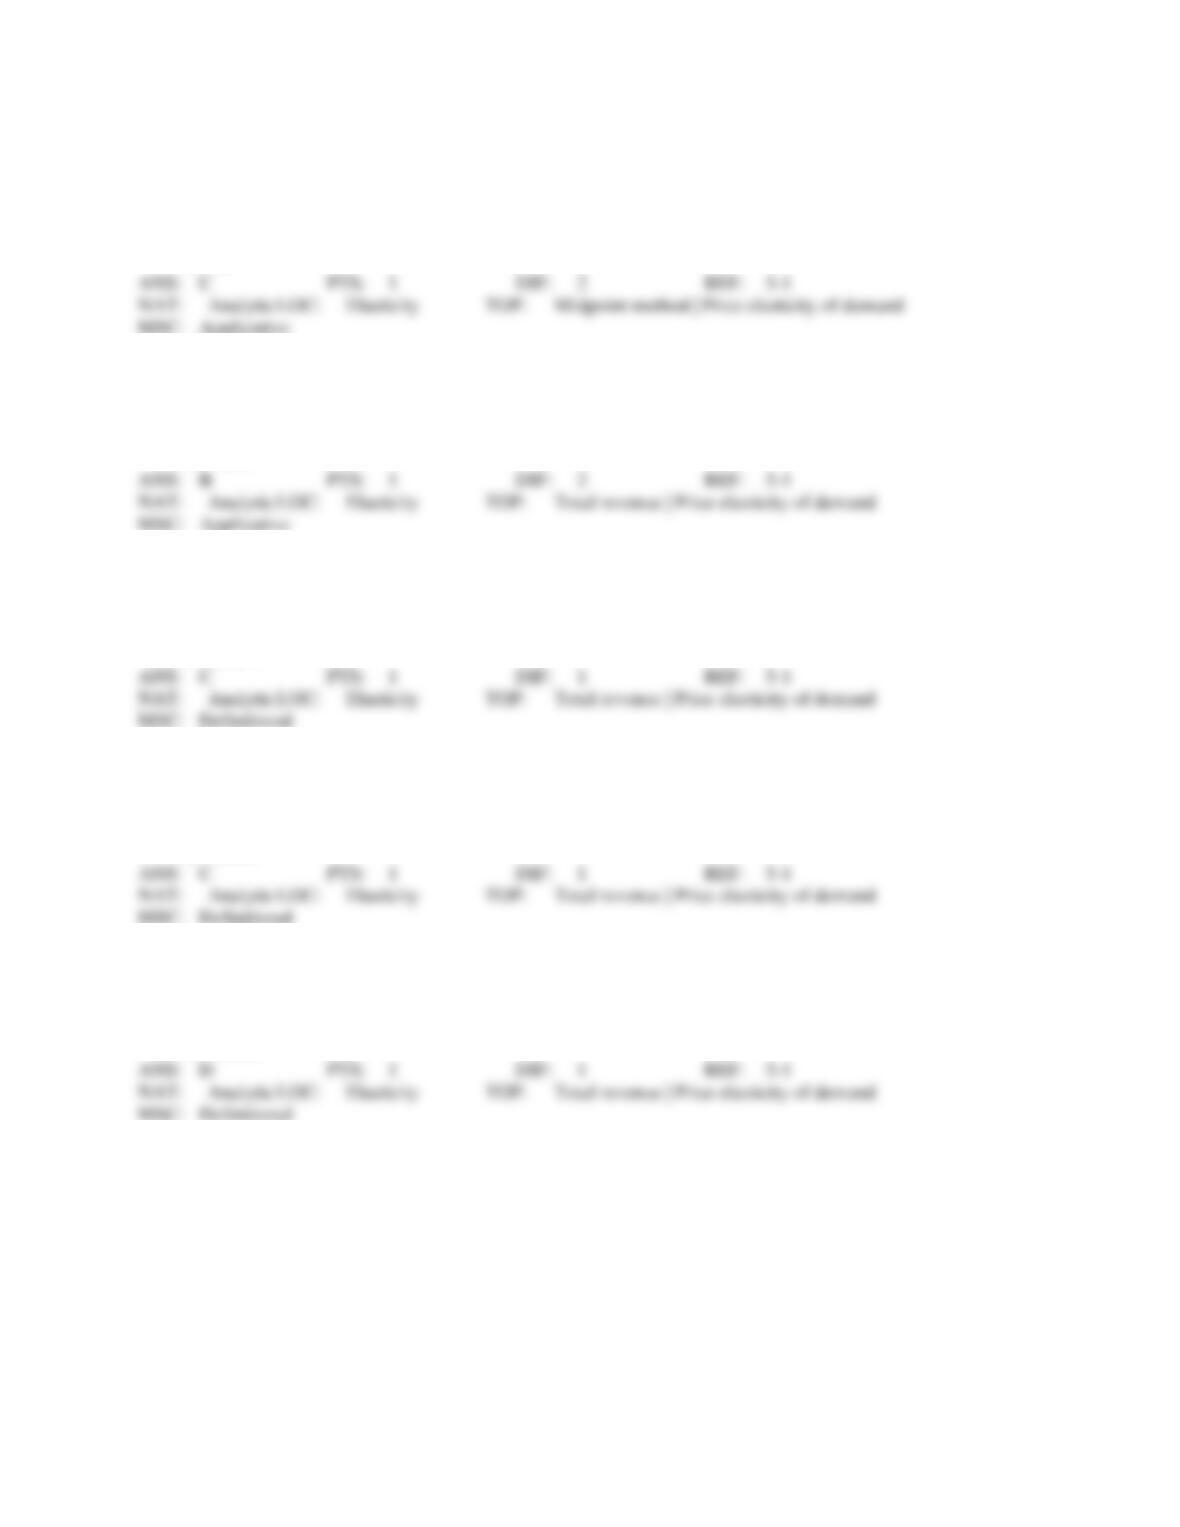
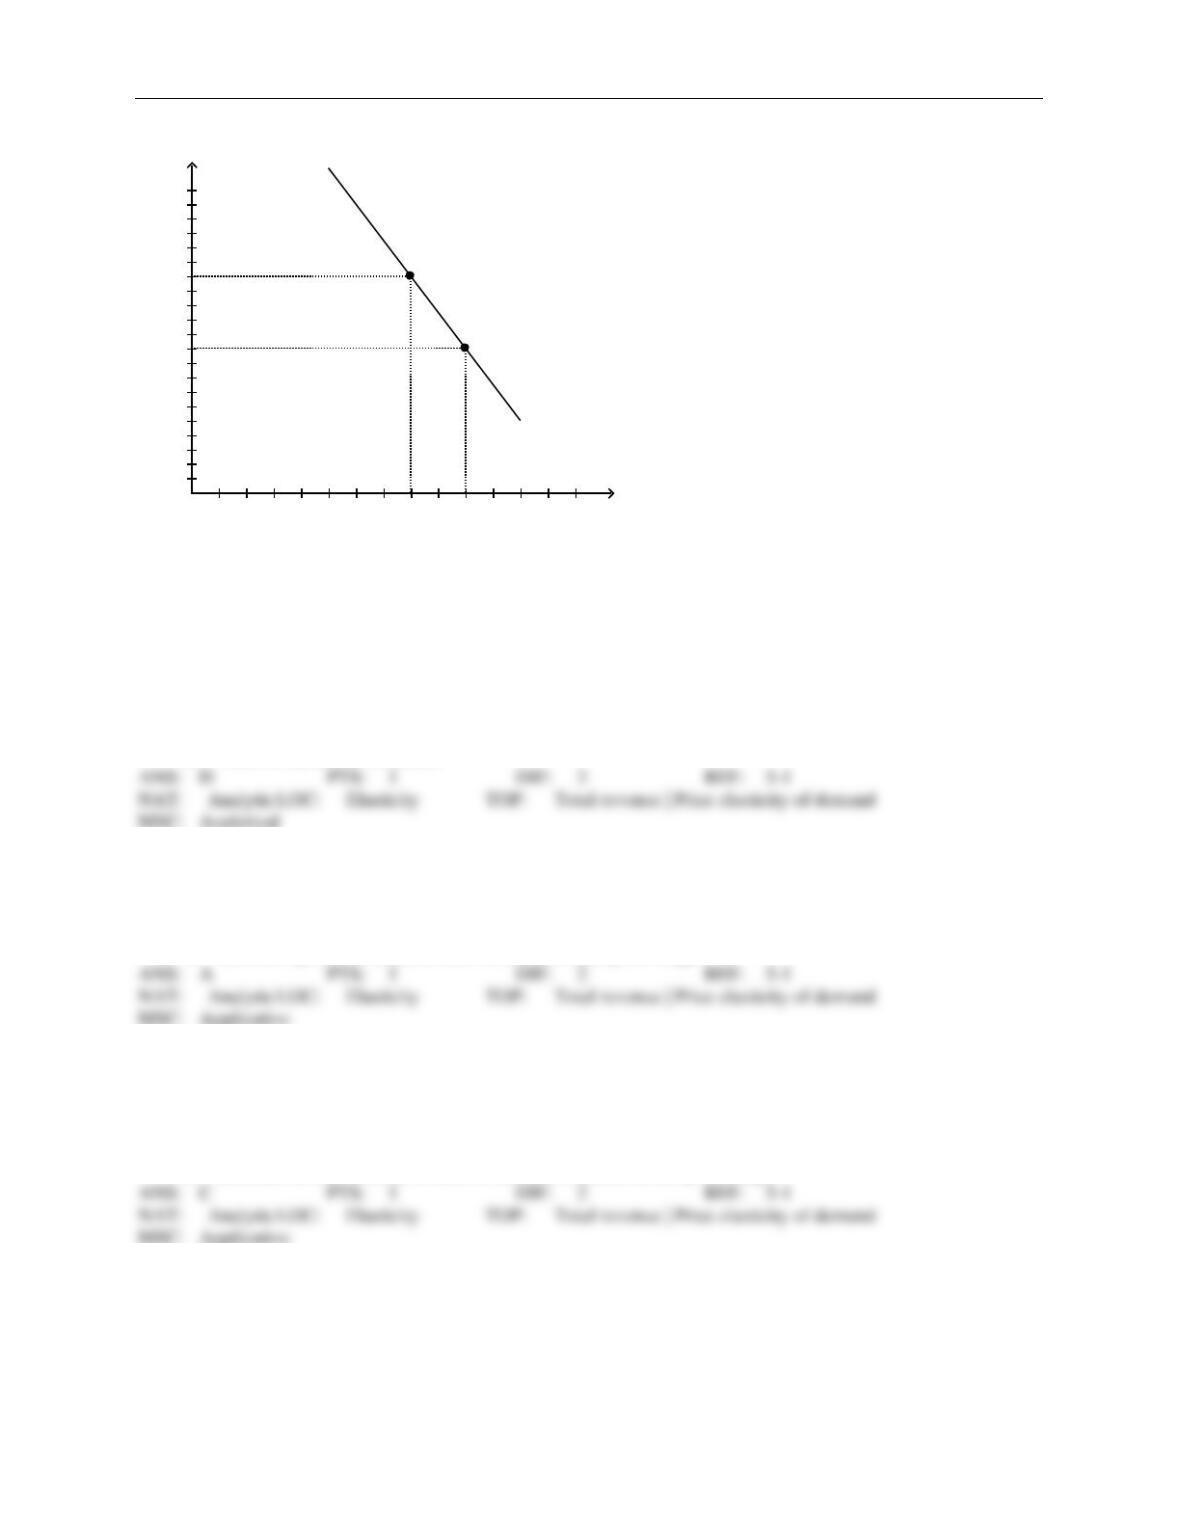
Figure 5-4
Demand
A
B
C
Quantity
Price
200. Refer to Figure 5-4. Suppose the point labeled B is the “halfway point” on the demand curve and it corre-
sponds to a price of $5.00. Then, between prices of $4.99 and $5.01, the price elasticity of demand is
a.
less than 1 but greater than zero.
b.
equal to 1.
c.
greater than 1.
d.
equal to zero.
201. Refer to Figure 5-4. The section of the demand curve from A to B represents the
a.
elastic section of the demand curve.
b.
inelastic section of the demand curve.
c.
unit elastic section of the demand curve.
d.
perfectly elastic section of the demand curve.
42 ❖ Chapter 5/Elasticity and Its Application
202. Refer to Figure 5-4. The section of the demand curve from B to C represents the
a.
elastic section of the demand curve.
b.
inelastic section of the demand curve.
c.
unit elastic section of the demand curve.
d.
perfectly elastic section of the demand curve.
203. Refer to Figure 5-4. The section of the demand curve at point B represents the
a.
elastic section of the demand curve.
b.
inelastic section of the demand curve.
c.
unit elastic section of the demand curve.
d.
perfectly elastic section of the demand curve.
204. Refer to Figure 5-4. Assume the section of the demand curve from A to B corresponds to prices between $8
and $16. Then, when the price changes between $9 and $10,
a.
quantity demanded changes proportionately less than the price.
b.
quantity demanded changes proportionately more than the price.
c.
quantity demanded changes the same amount proportionately as price.
d.
the price elasticity of demand equals 1.
205. Refer to Figure 5-4. Assume the section of the demand curve from A to B corresponds to prices between $6
and $12. Then, when the price increases from $8 to $10,
a.
the percent decrease in the quantity demanded exceeds the percent increase in the price.
b.
the percent increase in the price exceeds the percent decrease in the quantity demanded.
c.
sellers’ total revenue increases as a result.
d.
it is possible that the quantity demanded fell from 550 to 500 as a result.
206. Refer to Figure 5-4. Assume, for the good in question, two specific points on the demand curve are (Q =
1,000, P = $40) and (Q = 1,500, P = $30). Then which of the following scenarios is possible?
a.
Both of these points lie on the section of the demand curve from B to C.
b.
The vertical intercept of the demand curve is the point (Q = 0, P = $60).
c.
The horizontal intercept of the demand curve is the point (Q = 1,800, P = $0).
d.
Any of these scenarios is possible.
207. Refer to Figure 5-4. The section of the demand curve from B to C represents the
a.
elastic section of the demand curve.
b.
perfectly elastic section of the demand curve.
c.
unit elastic section of the demand curve.
d.
inelastic section of the demand curve.
Chapter 5/Elasticity and Its Application/ ❖ 43
208. Refer to Figure 5-4. Assume the section of the demand curve from B to C corresponds to prices between $0
and $15. Then, when the price changes between $7 and $9,
a.
quantity demanded changes proportionately less than the price.
b.
quantity demanded changes proportionately more than the price.
c.
quantity demanded changes the same amount proportionately as price.
d.
the price elasticity of demand equals zero.
209. Refer to Figure 5-4. Assume, for the good in question, two specific points on the demand curve are (Q =
2,000, P = $15) and (Q = 2,400, P = $12). Then which of the following scenarios is possible?
a.
Both of these points lie on section BC of the demand curve.
b.
The vertical intercept of the demand curve is the point (Q = 0, P = $22).
c.
The horizontal intercept of the demand curve is the point (Q = 5,000, P = $0).
d.
Any of these scenarios is possible.
210. Refer to Figure 5-4. If the price decreases in the region of the demand curve between points A and B, we can
expect total revenue to
a.
increase.
b.
stay the same.
c.
decrease.
d.
first decrease, then increase until total revenue is maximized.
211. Refer to Figure 5-4. If the price increases in the region of the demand curve between points A and B, we can
expect total revenue to
a.
increase.
b.
stay the same.
c.
decrease.
d.
first increase, then decrease until total revenue is maximized.
212. Refer to Figure 5-4. If the price decreases in the region of the demand curve between points B and C, we can
expect total revenue to
a.
increase.
b.
stay the same.
c.
decrease.
d.
first increase, then decrease until total revenue is maximized.
213. Refer to Figure 5-4. If the price increases in the region of the demand curve between points B and C, we can
expect total revenue to
a.
increase.
b.
stay the same.
c.
decrease.
d.
first decrease, then increase until total revenue is maximized.
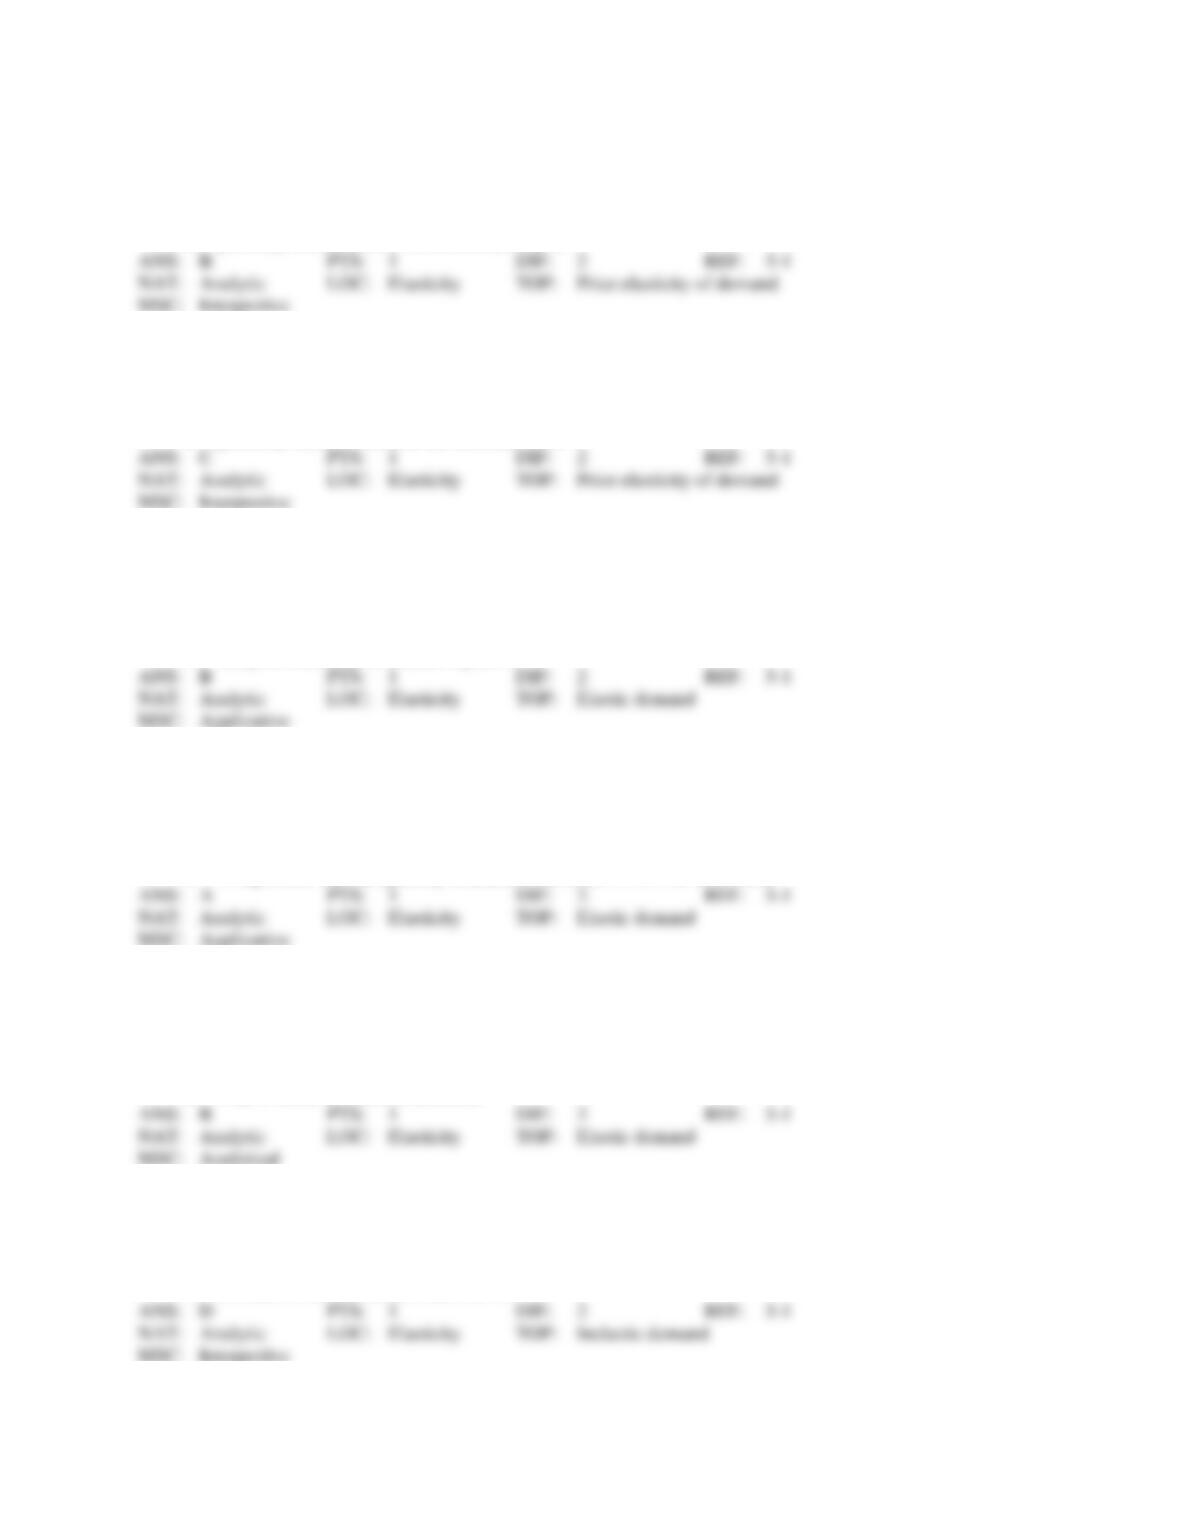
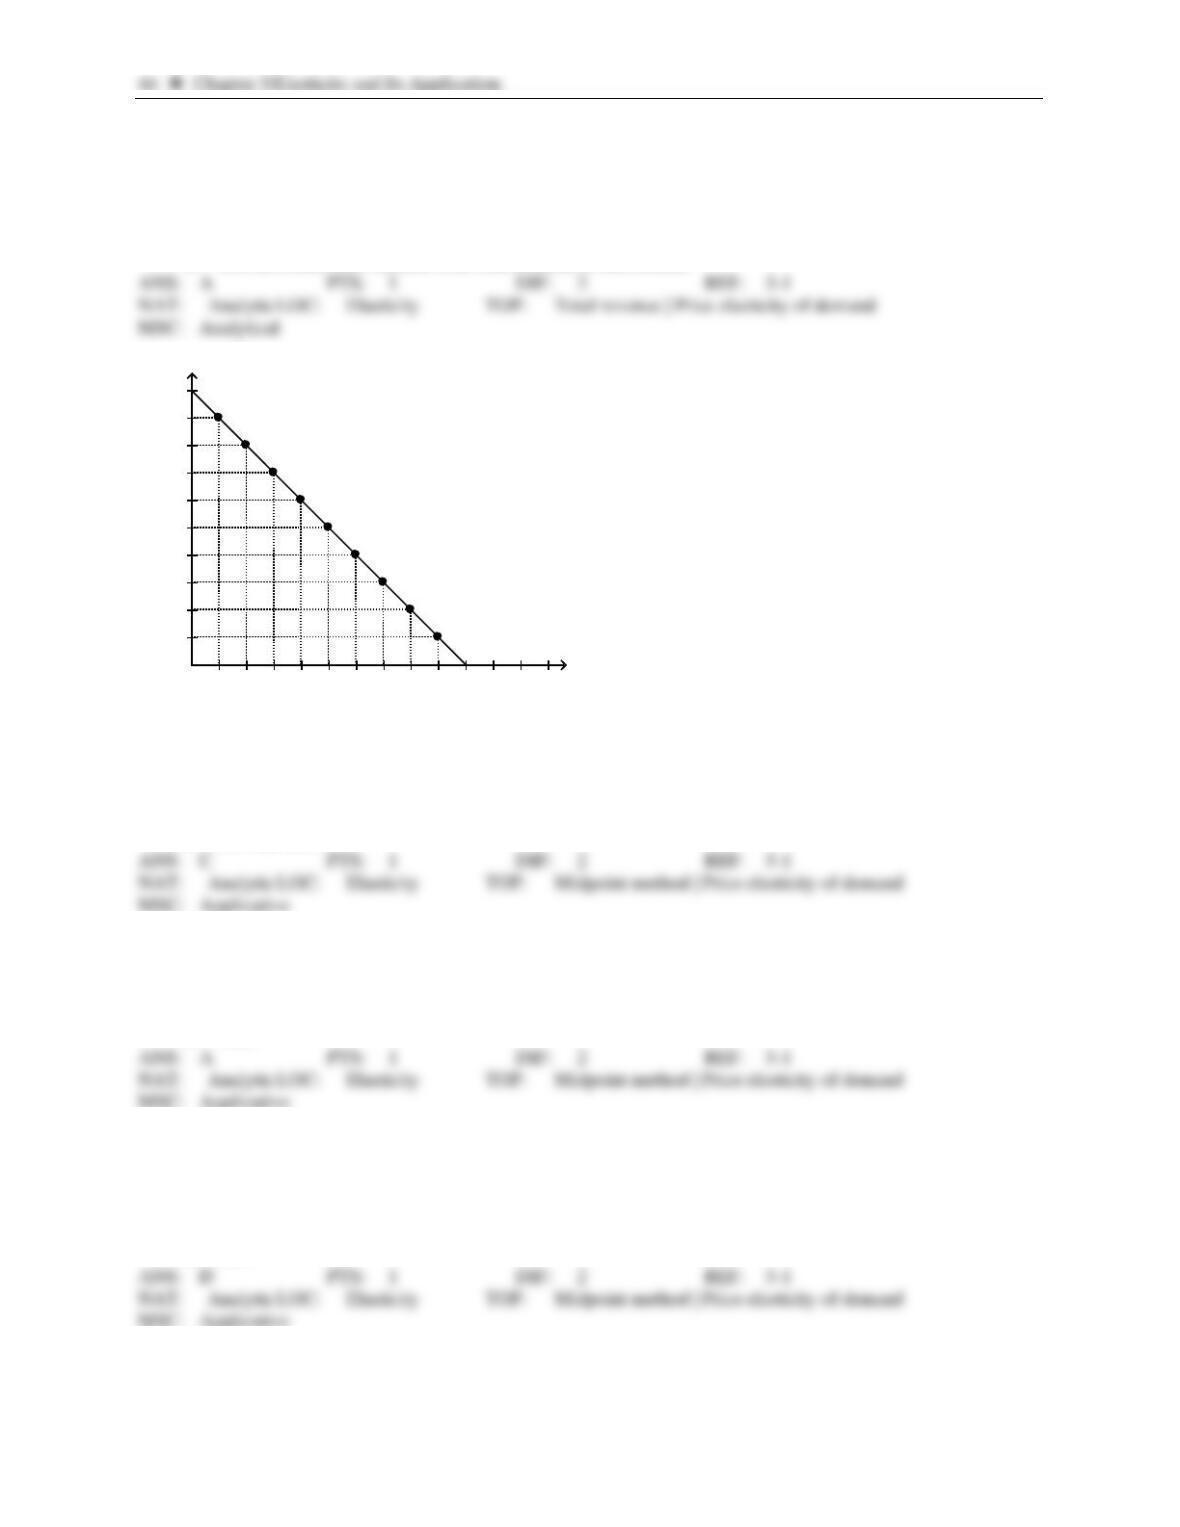
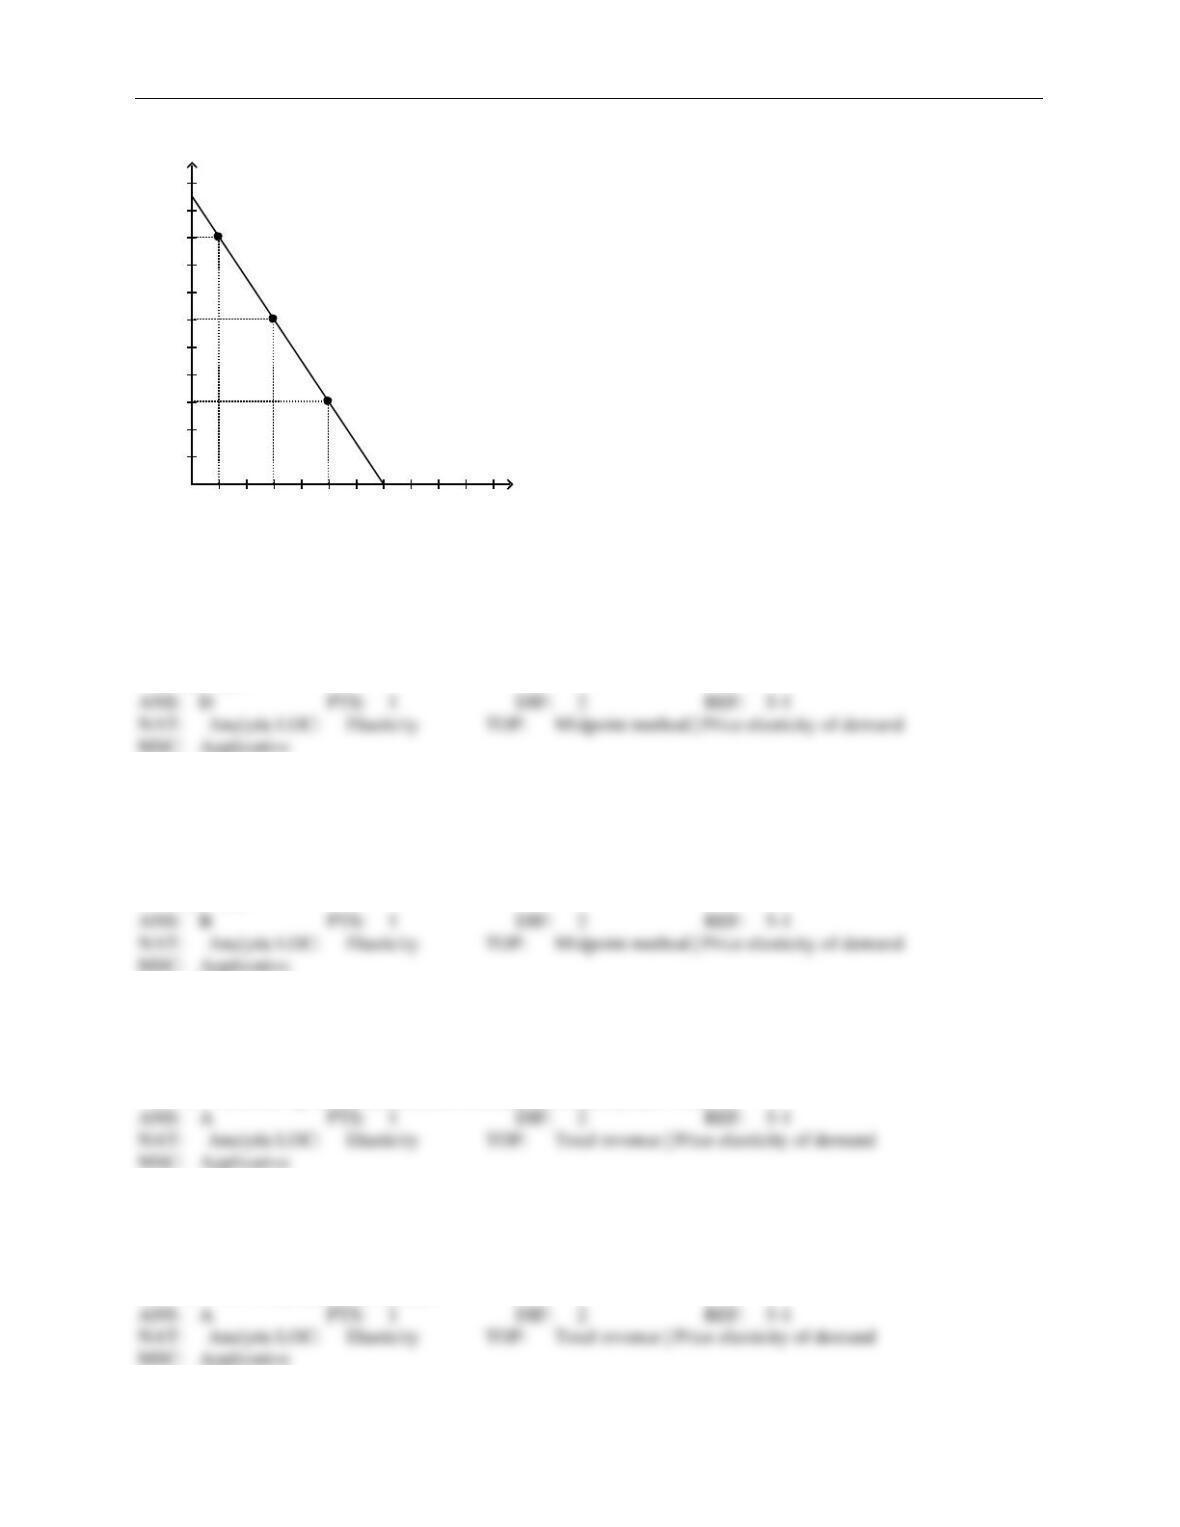
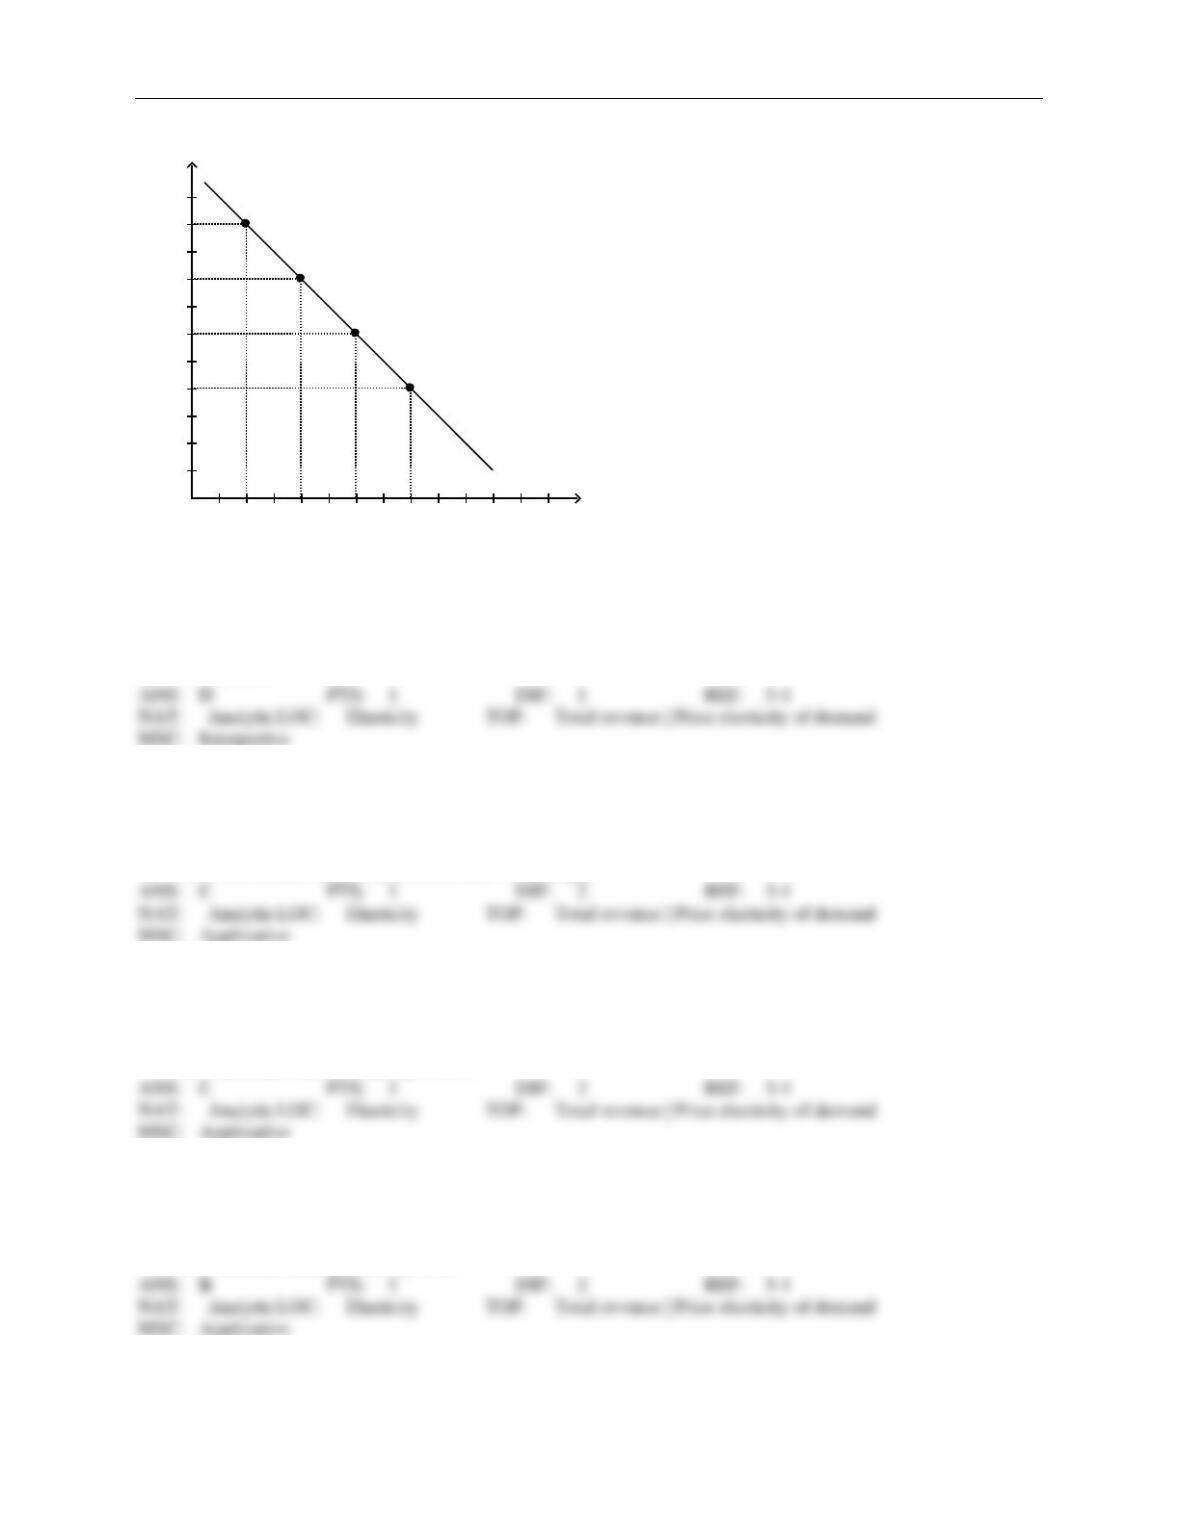
Figure 5-5
Demand
36912 15 18 21 24 27 30 33 Quantity
6
12
18
24
30
36
42
48
54
60 Price
214. Refer to Figure 5-5. Using the midpoint method, demand is unit elastic between prices of
a.
$18 and $24.
b.
$24 and $30.
c.
$24 and $36.
d.
$30 and $36.
215. Refer to Figure 5-5. Using the midpoint method, between prices of $12 and $18, price elasticity of demand is
a.
0.33.
b.
0.67.
c.
1.33.
d.
1.89.
216. Refer to Figure 5-5. Using the midpoint method, between prices of $48 and $54, price elasticity of demand is
about
a.
0.92.
b.
3.89.
c.
4.33.
d.
5.67.
Chapter 5/Elasticity and Its Application/ ❖ 45
217. Refer to Figure 5-5. Using the midpoint method, between prices of $30 and $36, price elasticity of demand is
about
a.
0.5.
b.
0.82.
c.
1.22.
d.
2.
218. Refer to Figure 5-5. The maximum value of total revenue corresponds to a price of
a.
$18.
b.
$30.
c.
$42.
d.
$48.
219. Refer to Figure 5-5. At a price of $48 per unit, sellers’ total revenue equals
a.
$150.
b.
$200.
c.
$288.
d.
$364.
220. Refer to Figure 5-5. At a price of $12 per unit, sellers’ total revenue equals
a.
$150.
b.
$200.
c.
$288.
d.
$364.
221. Refer to Figure 5-5. At a price of $30 per unit, sellers’ total revenue equals
a.
$150.
b.
$200.
c.
$288.
d.
$450.
46 ❖ Chapter 5/Elasticity and Its Application
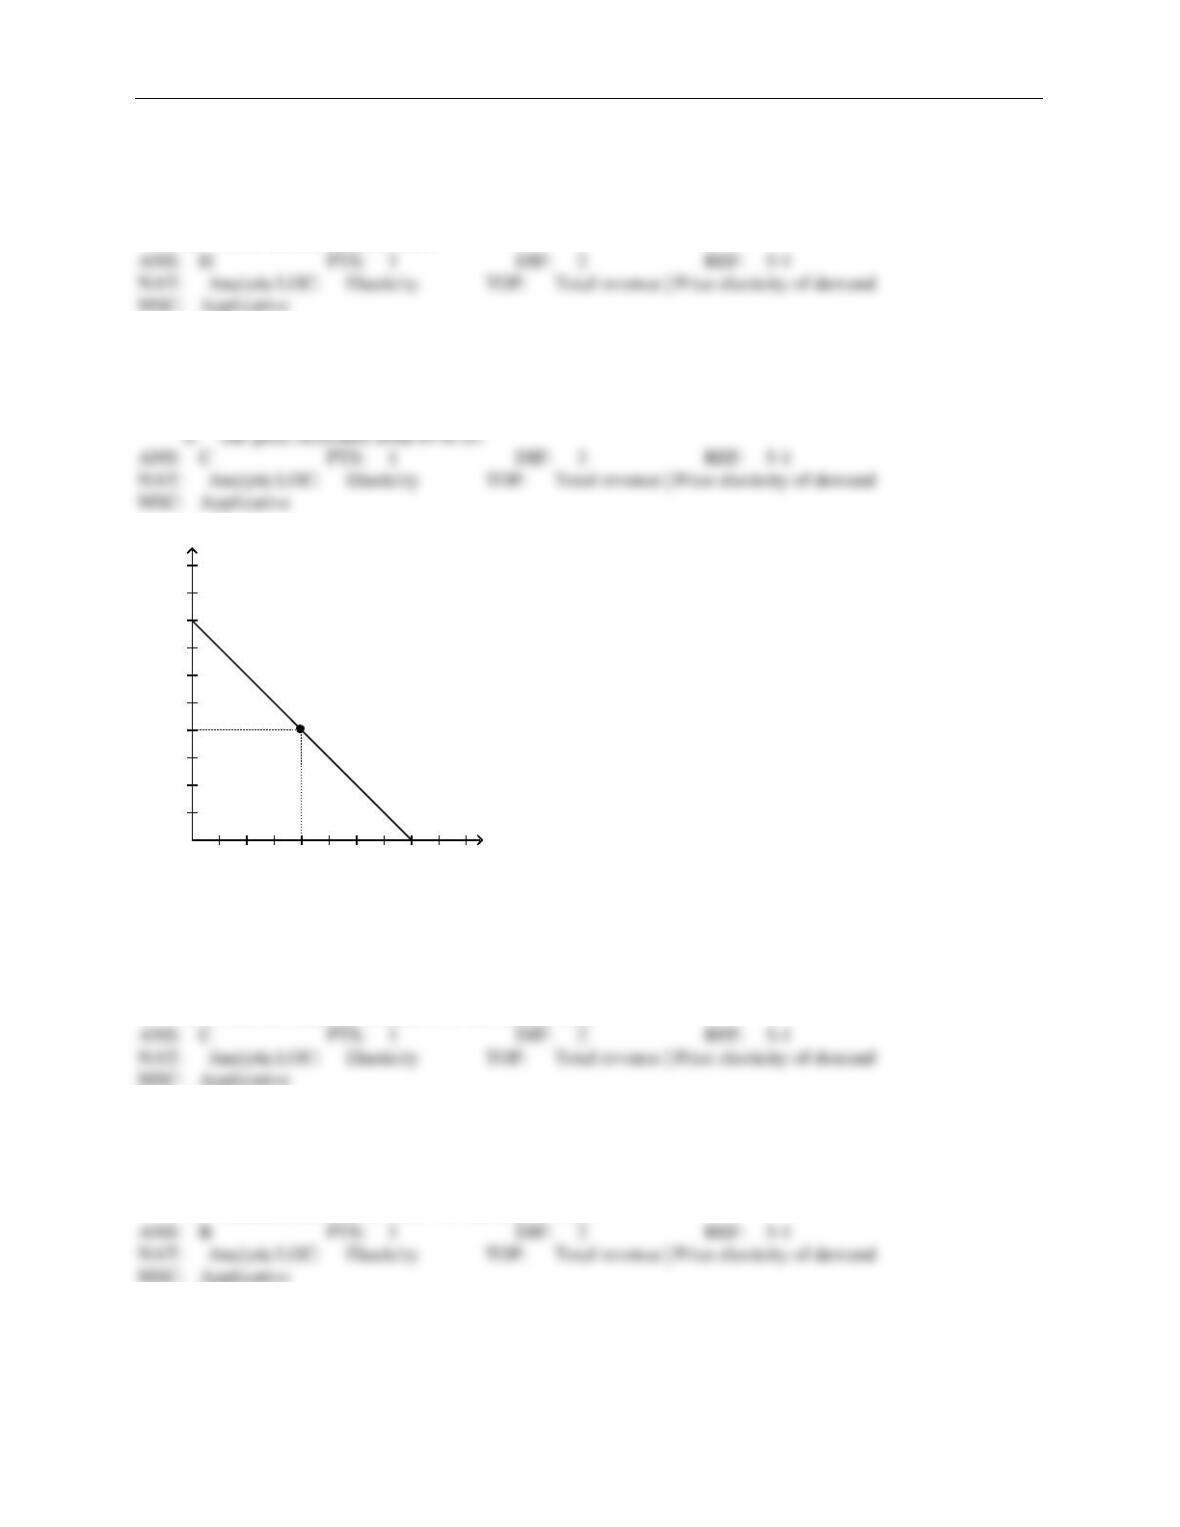
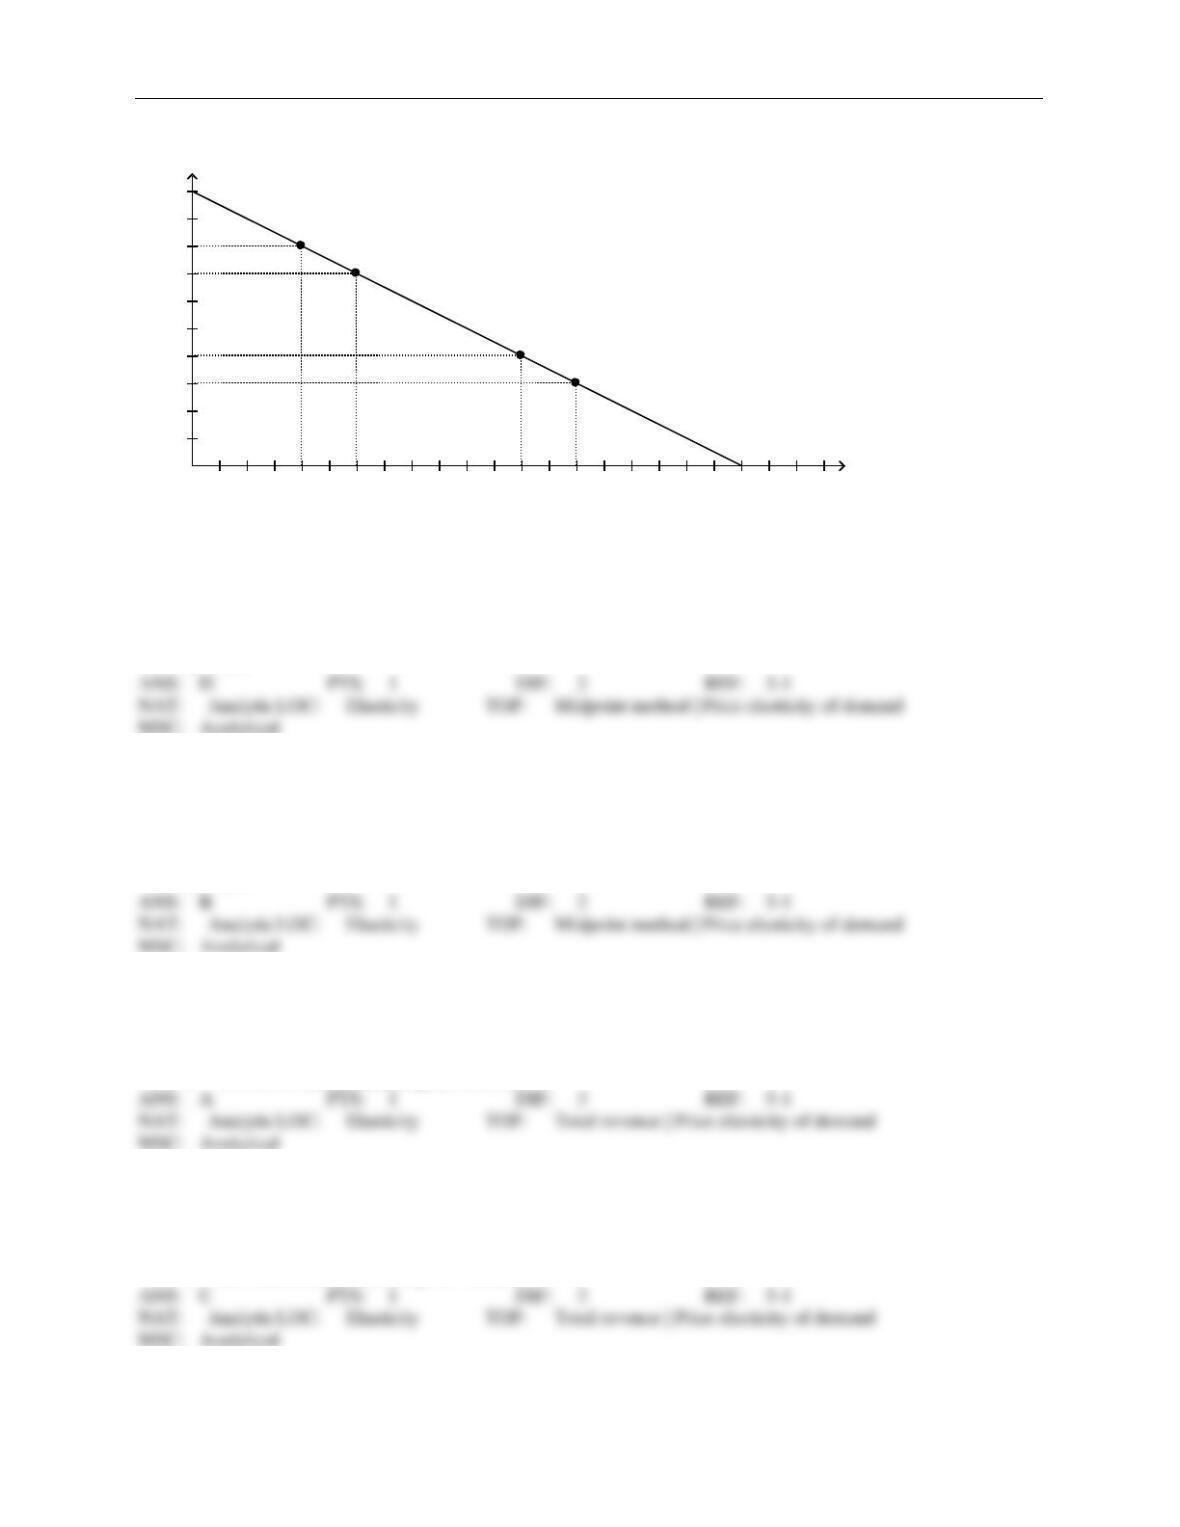
Figure 5-6
A
B
C
Demand
100 200 300 400 500 600 700 800 900 Quantity
2
4
6
8
10
12
14
16
18
20
22
Price
222. Refer to Figure 5-6. Using the midpoint method, the price elasticity of demand between point A and point B
is
a.
1.
b.
1.5.
c.
2.
d.
2.5.
223. Refer to Figure 5-6. Using the midpoint method, the price elasticity of demand between point B and point C
is
a.
0.5.
b.
0.75.
c.
1.0.
d.
1.3.
224. Refer to Figure 5-6. If the price decreased from $18 to $6, total revenue would
a.
increase by $1,200, and demand is elastic between points A and C.
b.
increase by $800, and demand is elastic between points A and C.
c.
decrease by $1,200, and demand is inelastic between points A and C.
d.
decrease by $800, and demand is inelastic between points A and C.
225. Refer to Figure 5-6. Sellers’ total revenue would increase if the price
a.
increased from $4 to $6.
b.
increased from $16 to $18.
c.
decreased from $8 to $6.
d.
All of the above are correct.
Chapter 5/Elasticity and Its Application/ ❖ 47
226. Refer to Figure 5-6. Sellers’ total revenue would increase if the price
a.
increased from $6 to $8.
b.
decreased from $18 to $16.
c.
decreased from $16 to $15.
d.
All of the above are correct.
227. Refer to Figure 5-6. Which of the following price changes would result in no change in sellers’ total revenue?
a.
The price increases from $6 to $9.
b.
The price increases from $9 to $15.
c.
The price decreases from $12 to $9.
d.
The price decreases from $9 to $5.
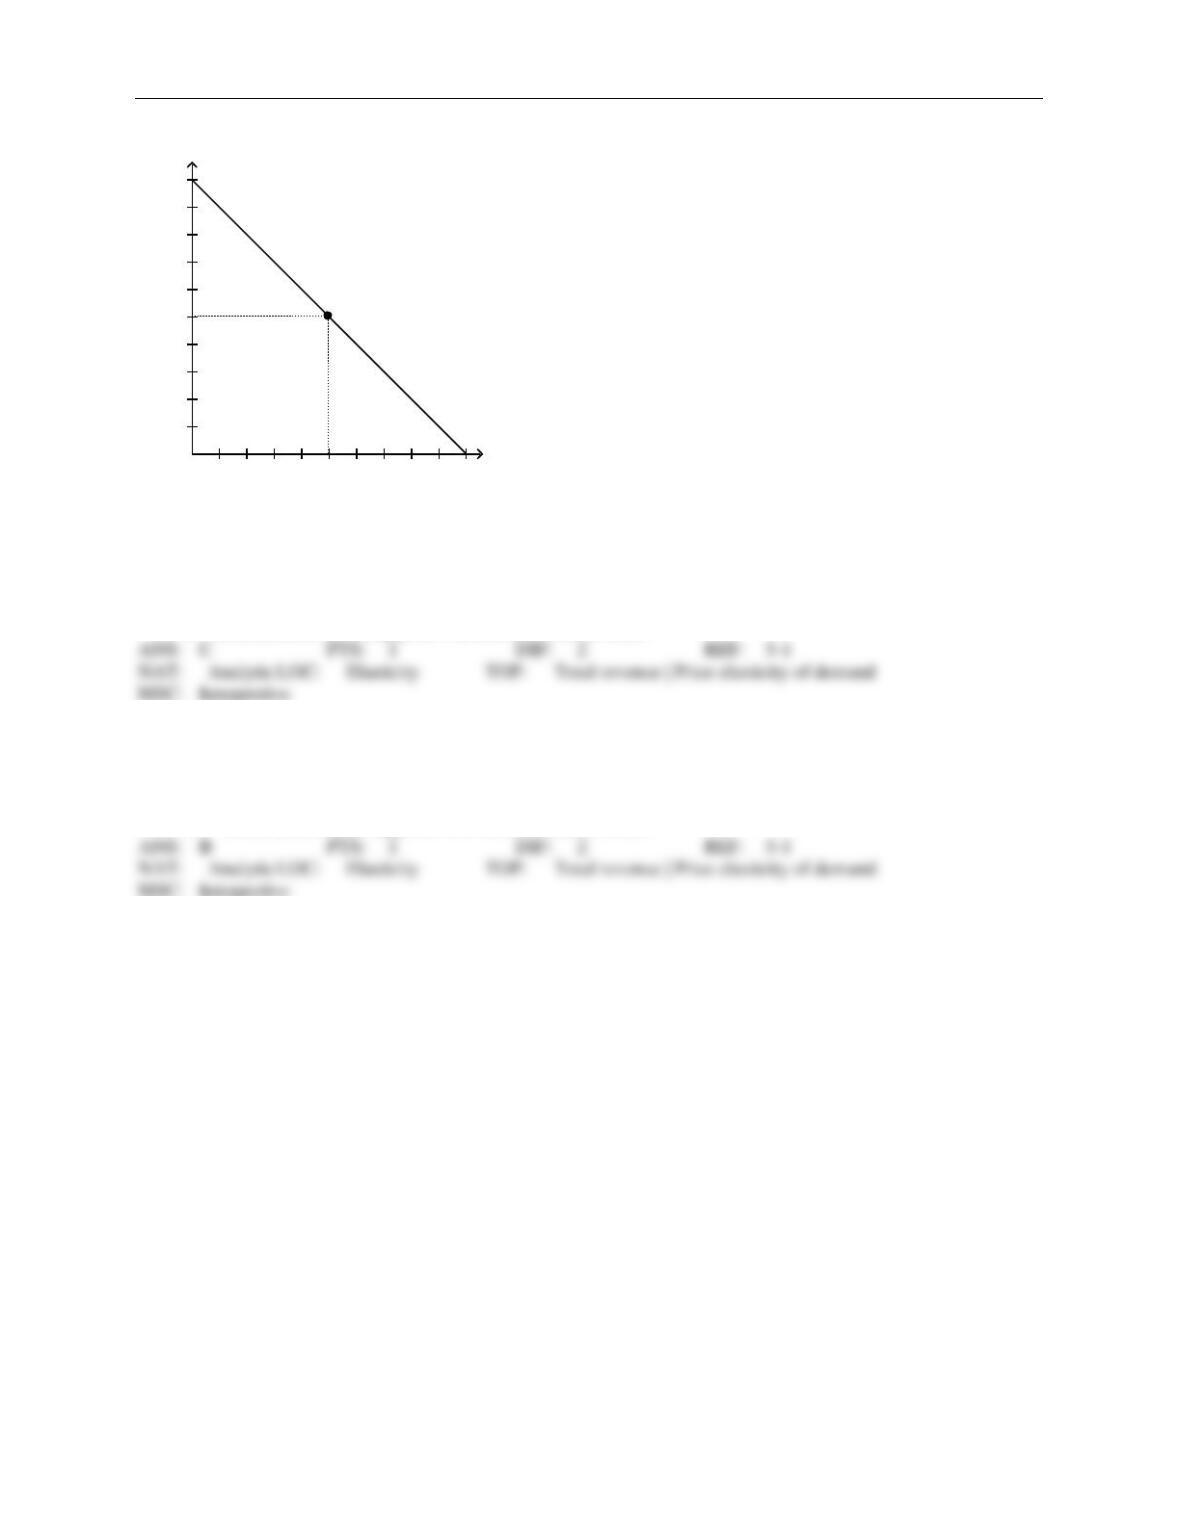
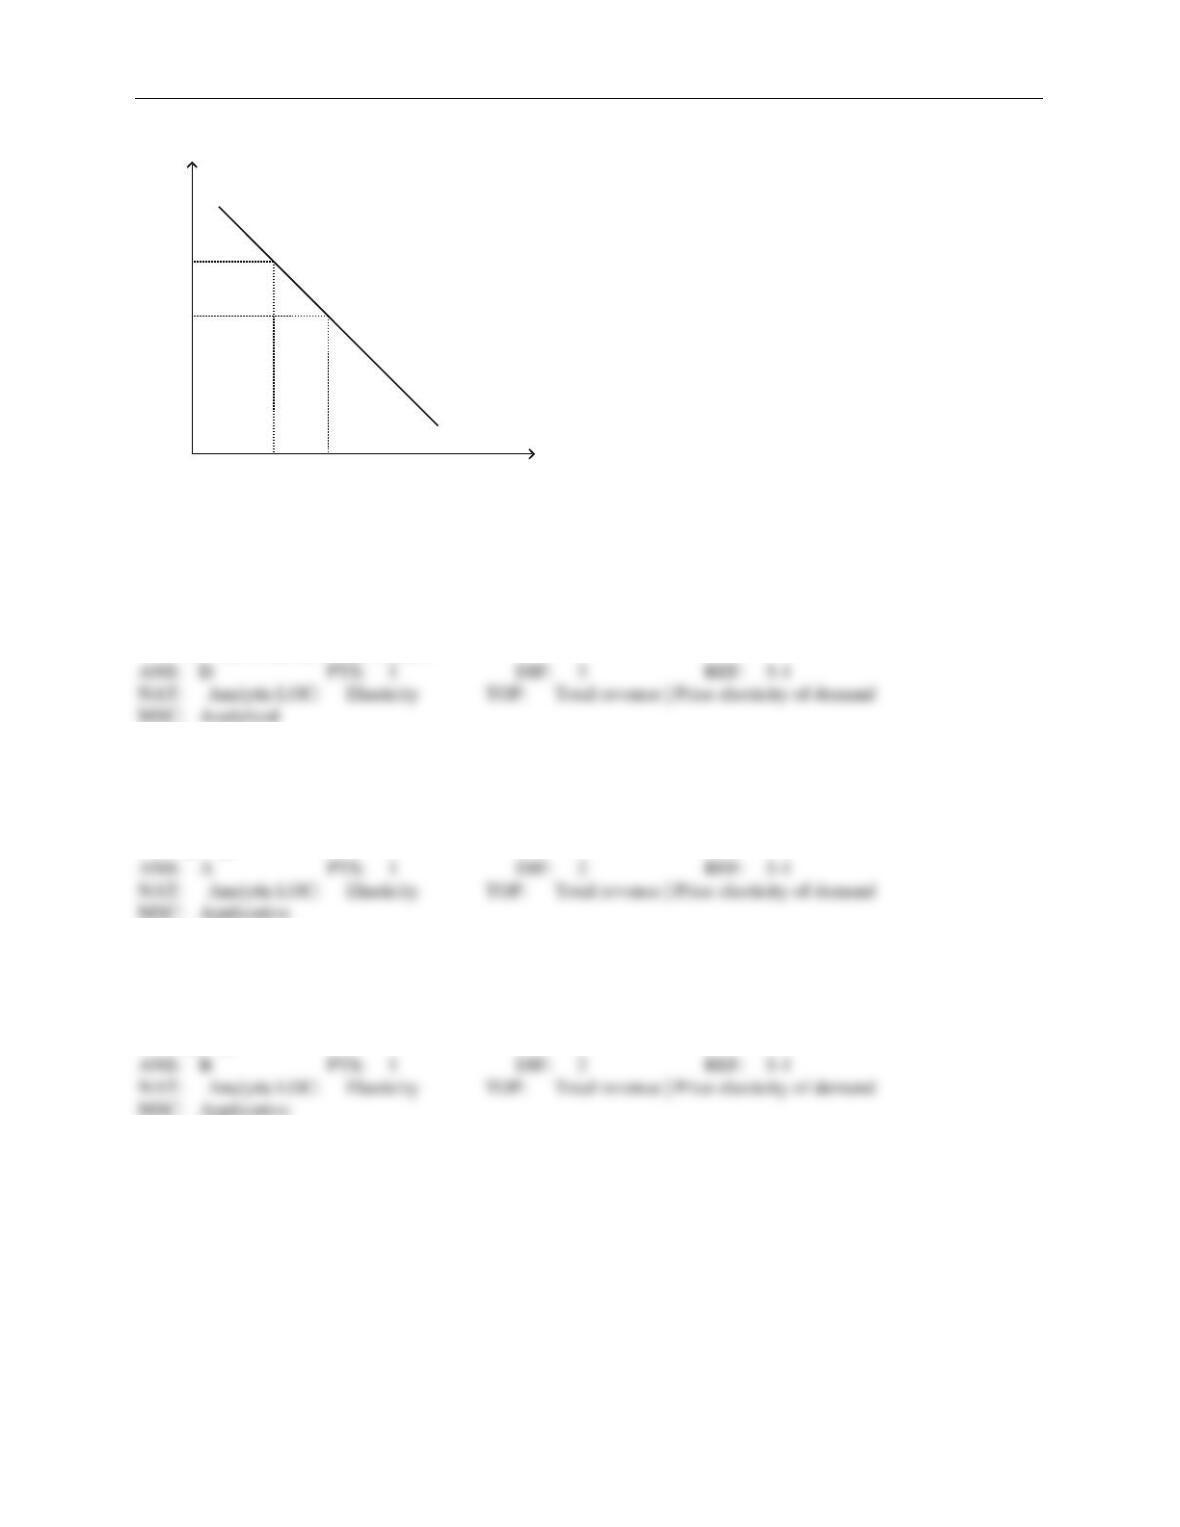
Figure 5-7
D
246810 12 14 16 Quantity
2
4
6
8
10
12
14
16
18
20 Price
228. Refer to Figure 5-7. For prices above $8, demand is price
a.
elastic, and total revenue will rise as price rises.
b.
inelastic, and total revenue will rise as price rises.
c.
elastic, and total revenue will fall as price rises.
d.
inelastic, and total revenue will fall as price rises.
229. Refer to Figure 5-7. For prices below $8, demand is price
a.
elastic, and total revenue will rise as price rises.
b.
inelastic, and total revenue will rise as price rises.
c.
elastic, and total revenue will fall as price rises.
d.
inelastic, and total revenue will fall as price rises.
48 ❖ Chapter 5/Elasticity and Its Application
Figure 5-8
D
1 2 3 4 5 6 7 8 Quantity
1
2
3
4
5
6
7
8
9
10 Price
230. Refer to Figure 5-8. For prices above $5, demand is price
a.
elastic, and raising price will increase total revenue.
b.
inelastic, and raising price will increase total revenue.
c.
elastic, and lowering price will increase total revenue.
d.
inelastic, and lowering price will increase total revenue.
231. Refer to Figure 5-8. For prices below $5, demand is price
a.
elastic, and raising price will increase total revenue.
b.
inelastic, and raising price will increase total revenue.
c.
elastic, and lowering price will increase total revenue.
d.
inelastic, and lowering price will increase total revenue.
Chapter 5/Elasticity and Its Application/ ❖ 49
Figure 5-9
Demand
1 2 3 4 5 6 7 8 9 10 11 12 Quantity
1
2
3
4
5
6
7
8
9
10
11
12
13
14
15
16
17
18
19
20
21
Price
232. Refer to Figure 5-9. Suppose this demand curve is a straight, downward-sloping line all the way from the
horizontal intercept to the vertical intercept. We choose two prices, P1 and P2, and the corresponding quanti-
ties demanded, Q1 and Q2, for the purpose of calculating the price elasticity of demand. Also suppose P2 > P1.
In which of the following cases could we possibly find that (i) demand is elastic and (ii) an increase in price
from P1 to P2 causes an increase in total revenue?
a.
0 < P1 < P2 < $10.
b.
$10 < P1 < P2 < $15.
c.
P1 > $15.
d.
None of the above is correct.
233. Refer to Figure 5-9. If price increases from $10 to $15, total revenue will
a.
increase by $20, so demand must be inelastic in this price range.
b.
increase by $5, so demand must be inelastic in this price range.
c.
decrease by $20, so demand must be elastic in this price range.
d.
decrease by $10, so demand must be elastic in this price range.
234. Refer to Figure 5-9. A decrease in price from $15 to $10 leads to a
a.
decrease in total revenue of $10, so the price elasticity of demand is greater than 1 in this price
range.
b.
decrease in total revenue of $10, so the price elasticity of demand is less than 1 in this price range.
c.
decrease in total revenue of $20, so the price elasticity of demand is less than 1 in this price range.
d.
decrease in total revenue of $20, so demand is elastic in this price range.
50 ❖ Chapter 5/Elasticity and Its Application
Figure 5-10
Demand
50 100 150 200 250 300 350 400 450 500 550 Quantity
5
10
15
20
25
30
35
40
45
50
55
Price
235. Refer to Figure 5-10. When the price is $30, total revenue is
a.
$3,000.
b.
$5,000.
c.
$7,000.
d.
$9,000.
236. Refer to Figure 5-10. When price falls from $50 to $40, demand is
a.
inelastic, since total revenue decreases from $8,000 to $5,000.
b.
inelastic, since total revenue increases from $5,000 to $8,000.
c.
elastic, since total revenue increases from $5,000 to $8,000.
d.
unit elastic, since total revenue does not change.
237. Refer to Figure 5-10. An increase in price from $20 to $30 would
a.
increase total revenue by $2,000.
b.
decrease total revenue by $2,000.
c.
increase total revenue by $1,000.
d.
decrease total revenue by $1,000.
238. Refer to Figure 5-10. An increase in price from $30 to $35 would
a.
increase total revenue by $250
b.
decrease total revenue by $250.
c.
increase total revenue by $500.
d.
decrease total revenue by $500.
Chapter 5/Elasticity and Its Application/ ❖ 51
Figure 5-11
Demand
A
B
C
D
1 2 3 4 5 6 7 8 9 10 11 12 13 14 15 16 17 18 19 20 21 Quantity
1
2
3
4
5
6
7
8
9
10 Price
239. Refer to Figure 5-11. Using the midpoint method, the price elasticity of demand between point A and point
B is about
a.
0.33.
b.
0.5.
c.
2.0.
d.
3.0.
240. Refer to Figure 5-11. Using the midpoint method, the price elasticity of demand between point C and point
D is about
a.
0.29.
b.
0.54.
c.
1.86.
d.
2.0.
241. Refer to Figure 5-11. If the price falls from point A to point B, total revenue
a.
increases, and demand is price elastic.
b.
decreases, and demand is price elastic.
c.
increases, and demand is price inelastic.
d.
decreases, and demand is price inelastic.
242. Refer to Figure 5-11. If the price rises from point D to point C, total revenue
a.
increases, and demand is price elastic.
b.
decreases, and demand is price elastic.
c.
increases, and demand is price inelastic.
d.
decreases, and demand is price inelastic.
52 ❖ Chapter 5/Elasticity and Its Application
Figure 5-12
Demand
P2
P1
Q2 Q1
A
B
C
D
Quantity
Price
243. Refer to Figure 5-12. If rectangle D is larger than rectangle A, then
a.
demand is elastic between prices P1 and P2.
b.
a decrease in price from P2 to P1 will cause an increase in total revenue.
c.
the magnitude of the percent change in price between P1 and P2 is smaller than the magnitude of the
corresponding percent change in quantity demanded.
d.
All of the above are correct.
244. Refer to Figure 5-12. Total revenue when the price is P1 is represented by the area(s)
a.
B + D.
b.
A + B.
c.
C + D.
d.
D.
245. Refer to Figure 5-12. Total revenue when the price is P2 is represented by the area(s)
a.
B + D.
b.
A + B.
c.
C + D.
d.
D.
Chapter 5/Elasticity and Its Application/ ❖ 53
THE ELASTICITY OF DEMAND
Table 5-5
The following table shows a portion of the demand schedule for a particular good at various levels of income.
Price
Quantity Demanded
(Income = $5,000)
Quantity Demanded
(Income = $7,500)
Quantity Demanded
(Income = $10,000)
$24
2
3
4
$20
4
6
8
$16
6
9
12
$12
8
12
16
$8
10
15
20
$4
12
18
24
1. Refer to Table 5–5. Using the midpoint method, when income equals $7,500, what is the price
elasticity of demand between $16 and $20?
a.
0.56
b.
0.75
c.
1.33
d.
1.80
2. Refer to Table 5–5. Using the midpoint method, when income equals $5,000, what is the price elasticity of
demand between $8 and $12?
a.
0.56
b.
0.75
c.
1.33
d.
1.80
3. Refer to Table 5–5. Using the midpoint method, at a price of $16, what is the income elasticity of demand
when income rises from $5,000 to $10,000?
a.
0.00
b.
0.50
c.
1.00
d.
1.50
4. Refer to Table 5–5. Using the midpoint method, at a price of $8, what is the income elasticity of demand
when income rises from $7,500 to $10,000?
a.
0.00
b.
0.41
c.
1.00
d.
2.45
54 ❖ Chapter 5/Elasticity and Its Application
5. Refer to Table 5–5. Using the midpoint method, at a price of $12, what is the income elasticity of demand
when income rises from $5,000 to $10,000?
a.
0.00
b.
0.41
c.
1.00
d.
2.45
Table 5-6
Income
Quantity of Good X
Purchased
Quantity of Good Y
Purchased
$30,000
2
20
$40,000
6
10
6. Refer to Table 5-6. Using the midpoint method, what is the income elasticity of demand for good X?
a.
-3.5
b.
-0.29
c.
0.29
d.
3.5
7. Refer to Table 5-6. Using the midpoint method, the income elasticity of demand for good Y is
a.
2.33, and good Y is a normal good.
b.
-2.33, and good Y is an inferior good.
c.
-0.43, and good Y is a normal good.
d.
-0.43, and good Y is an inferior good.
8. Last year, Shelley bought 6 pairs of designer jeans when her income was $40,000. This year, her income is
$50,000, and she purchased 10 pairs of designer jeans. Holding other factors constant, it follows that Shelley
a.
considers designer jeans to be a necessity.
b.
considers designer jeans to be an inferior good.
c.
considers designer jeans to be a normal good.
d.
has a low price elasticity of demand for jeans.
9. Last year, Carolyn bought 6 pairs of earrings when her income was $40,000. This year, her income is $52,000,
and she purchased 7 pairs of earrings. Holding other factors constant, it follows that Carolyn’s income elastici-
ty of demand is about
a.
0.59, and Carolyn regards earrings as an inferior good.
b.
0.59, and Carolyn regards earrings as a normal good.
c.
1.7, and Carolyn regards earrings as an inferior good.
d.
1.7, and Carolyn regards earrings as a normal good.
Chapter 5/Elasticity and Its Application/ ❖ 55
10. Necessities such as food and clothing tend to have
a.
high price elasticities of demand and high income elasticities of demand.
b.
high price elasticities of demand and low income elasticities of demand.
c.
low price elasticities of demand and high income elasticities of demand.
d.
low price elasticities of demand and low income elasticities of demand.
11. Income elasticity of demand measures how
a.
the quantity demanded changes as consumer income changes.
b.
consumer purchasing power is affected by a change in the price of a good.
c.
the price of a good is affected when there is a change in consumer income.
d.
many units of a good a consumer can buy given a certain income level.
12. Danita rescues dogs from her local animal shelter. When Danita’s income rises by 7 percent, her quantity de-
manded of dog biscuits increases by 12 percent. For Danita, the income elasticity of demand for dog biscuits
is
a.
negative, and dog biscuits are a normal good.
b.
negative, and dog biscuits are an inferior good.
c.
positive, and dog biscuits are an inferior good.
d.
positive, and dog biscuits are a normal good.
13. For which of the following goods is the income elasticity of demand likely highest?
a.
water
b.
diamonds
c.
hamburgers
d.
housing
14. For which of the following goods is the income elasticity of demand likely highest?
a.
natural gas
b.
doctor’s visits
c.
hamburgers
d.
boats
15. For which of the following goods is the income elasticity of demand likely lowest?
a.
subscriptions to premium movie channels through the local cable television provider
b.
hi-definition DVD players
c.
champagne
d.
housing
56 ❖ Chapter 5/Elasticity and Its Application
16. For which of the following goods is the income elasticity of demand likely lowest?
a.
water
b.
sapphire pendant necklaces
c.
filet mignon steaks
d.
fresh fruit
17. Last year, Joan bought 50 pounds of hamburger when her household’s income was $40,000. This year, her
household income was only $30,000 and Joan bought 60 pounds of hamburger. All else constant, Joan‘s in-
come elasticity of demand for hamburger is
a.
positive, so Joan considers hamburger to be an inferior good.
b.
positive, so Joan considers hamburger to be a normal good and a necessity.
c.
negative, so Joan considers hamburger to be an inferior good.
d.
negative, so Joan considers hamburger to be a normal good but not a necessity.
18. If an increase in income results in a decrease in the quantity demanded of a good, then for that good, the
a.
cross-price elasticity of demand is negative.
b.
price elasticity of demand is elastic.
c.
income elasticity of demand is negative.
d.
income elasticity of demand is positive.
19. To determine whether a good is considered normal or inferior, one could examine the value of the
a.
income elasticity of demand for that good.
b.
price elasticity of demand for that good.
c.
price elasticity of supply for that good.
d.
cross-price elasticity of demand for that good.
20. You and your college roommate eat three packages of Ramen noodles each week. After graduation last month,
both of you were hired at several times your college income. You still enjoy Ramen noodles very much and
buy even more, but your roommate plans to buy fewer Ramen noodles in favor of foods she prefers more.
When looking at income elasticity of demand for Ramen noodles, yours would
a.
be negative, and your roommate’s would be positive.
b.
be positive, and your roommate’s would be negative.
c.
be zero, and your roommate’s would approach infinity.
d.
approach infinity, and your roommate’s would be zero.
Chapter 5/Elasticity and Its Application/ ❖ 57
21. You and your college roommate eat three packages of Ramen noodles each week. After graduation last month,
both of you were hired at several times your college income. Your roommate still enjoys Ramen noodles very
much and buys even more, but you plan to buy fewer Ramen noodles in favor of foods you prefer more. When
looking at income elasticity of demand for Ramen noodles, yours would
a.
be negative and your roommate’s would be positive.
b.
be positive and your roommate’s would be negative.
c.
be zero and your roommate’s would approach infinity.
d.
approach infinity and your roommate’s would be zero.
22. Suppose good X has a negative income elasticity of demand. This implies that good X is
a.
a normal good.
b.
a necessity.
c.
an inferior good.
d.
a luxury.
23. Suppose good X has a positive income elasticity of demand. This implies that good X could be
(i)
a normal good.
(ii)
a necessity.
(iii)
an inferior good.
(iv)
a luxury.
a.
(i) only
b.
(i) and (ii) only
c.
(i), (ii), and (iv) only
d.
(iii) only
24. For which of the following types of goods would the income elasticity of demand be positive and relatively
large?
a.
all inferior goods
b.
all normal goods
c.
goods for which there are many complements
d.
luxuries
25. Assume that a 4 percent increase in income results in a 2 percent increase in the quantity demanded of a good.
The income elasticity of demand for the good is
a.
negative, and the good is an inferior good.
b.
negative, and the good is a normal good.
c.
positive, and the good is a normal good.
d.
positive, and the good is an inferior good.
58 ❖ Chapter 5/Elasticity and Its Application
26. Assume that a 4 percent decrease in income results in a 6 percent increase in the quantity demanded of a good.
The income elasticity of demand for the good is
a.
negative, and the good is an inferior good.
b.
negative, and the good is a normal good.
c.
positive, and the good is an inferior good.
d.
positive, and the good is a normal good.
27. Reta’s income elasticity of demand for steak dinners is 1.50. All else equal, this means that if her income in-
creases by 20 percent, she will buy
a.
150 percent more steak dinners.
b.
50 percent more steak dinners.
c.
30 percent more steak dinners.
d.
20 percent more steak dinners.
28. When her income increased from $10,000 to $20,000, Heather’s consumption of macaroni decreased from 10
pounds to 5 pounds and her consumption of soy-burgers increased from 2 pounds to 4 pounds. We can con-
clude that for Heather, macaroni
a.
and soy-burgers are both normal goods with income elasticities equal to 1.
b.
is an inferior good and soy-burgers are normal goods; both have income elasticities of 1.
c.
is an inferior good with an income elasticity of -1 and soy-burgers are normal goods with an
income elasticity of 1.
d.
and soy-burgers are both inferior goods with income elasticities equal to –1.
29. Which of the following should be held constant when calculating an income elasticity of demand?
a.
the quantity of the good demanded
b.
the price of the good
c.
income
d.
All of the above should be held constant.
30. Which of the following should be held constant when calculating an income elasticity of demand?
a.
the price of the good
b.
prices of related goods
c.
tastes
d.
All of the above should be held constant.
Chapter 5/Elasticity and Its Application/ ❖ 59
31. Food and clothing tend to have
a.
small income elasticities because consumers, regardless of their incomes, choose to buy relatively
constant quantities of these goods.
b.
small income elasticities because consumers buy proportionately more of both goods at higher
income levels than they buy at low income levels.
c.
large income elasticities because they are necessities.
d.
large income elasticities because they are relatively inexpensive.
32. The income elasticity of demand for caviar tends to be
a.
high because caviar is relatively expensive.
b.
low because caviar is packaged in small containers.
c.
high because buyers generally feel that they can do without it.
d.
low because it is almost always in short supply.
33. While in college, John and Bethany each buy five packages of mac-n-cheese per week. After they graduate
and have full-time jobs, John buys six packages per week, but Bethany buys only two packages per week.
When looking at income elasticity of demand for mac-n-cheese, John’s
a.
is negative, and Bethany’s is positive.
b.
is positive, and Bethany’s is negative.
c.
is zero, and Bethany’s approaches infinity.
d.
approaches infinity, and Bethany’s is zero.
34. Charles purchases 20 basketball tickets per year when his annual income is $50,000 and 25 basketball tickets
when his annual income is $60,000. Charles’s income elasticity of demand for basketball ticket is
a.
0.82, and basketball tickets are a normal good.
b.
0.82, and basketball tickets are an inferior good.
c.
1.22, and basketball tickets are a normal good.
d.
1.22, and basketball tickets are an inferior good.
35. Tyler purchases 5 pounds of hot dogs per month when his monthly income is $2,000 and 4 pounds of hot dogs
per month when his monthly income is $2,200. Tyler’s income elasticity of demand for hot dogs is
a.
2.33, and hot dogs are a normal good.
b.
-2.33, and hot dogs are an inferior good.
c.
0.43, and hot dogs are a normal good.
d.
-0.43, and hot dogs are an inferior good.
60 ❖ Chapter 5/Elasticity and Its Application
36. Suppose goods A and B are substitutes for each other. We would expect the cross-price elasticity between
these two goods to be
a.
positive.
b.
negative.
c.
either positive or negative. It depends whether A and B are normal goods or inferior goods.
d.
either positive or negative. It depends whether the current price level is on the elastic or inelastic
portion of the demand curve.
37. Last month, sellers of good Y took in $100 in total revenue on sales of 50 units of good Y. This month sellers
of good Y raised their price and took in $120 in total revenue on sales of 40 units of good Y. At the same time,
the price of good X stayed the same, but sales of good X increased from 20 units to 40 units. We can conclude
that goods X and Y are
a.
substitutes, and have a cross-price elasticity of 0.60.
b.
complements, and have a cross-price elasticity of 0.60.
c.
substitutes, and have a cross-price elasticity of 1.67.
d.
complements, and have a cross-price elasticity of 1.67.
38. Which of the following could be the cross-price elasticity of demand for two goods that are complements?
a.
-1.3
b.
0
c.
0.2
d.
1.4
39. Suppose that when the price of good X falls from $10 to $8, the quantity demanded of good Y rises from 20
units to 25 units. Using the midpoint method, the cross–price elasticity of demand is
a.
-1.0, and X and Y are complements.
b.
-1.0, and X and Y are substitutes.
c.
1.0, and X and Y are complements.
d.
1.0, and X and Y are substitutes.
40. Which of the following expressions represents a cross-price elasticity of demand?
a.
percentage change in quantity demanded of bread divided by percentage change in quantity
supplied of bread
b.
percentage change in quantity demanded of bread divided by percentage change in price of butter
c.
percentage change in price of bread divided by percentage change in quantity demanded of bread
d.
percentage change in quantity demanded of bread divided by percentage change in income