Utility: A Tool to Analyze Purchase Decisions
75. When the price of a commodity falls, we can expect
a.
total utility will fall.
b.
marginal utility of the last unit purchased will fall.
c.
marginal utility of the last unit purchased will rise.
d.
purchases will fall because of a change in marginal utility.
DISC: Utility and consumer choic – DISC: Utility and consumer choice
United States – BPROG: Analytic
Utility and consumer choice
Utility: A Tool to Analyze Purchase Decisions
76. If a commodity is inexpensive and its total utility great,
a.
it is an inferior good.
b.
it is plentiful.
c.
its marginal utility is high.
d.
the ratio of price to marginal utility is very high.
DISC: Utility and consumer choic – DISC: Utility and consumer choice
United States – BPROG: Reflective Thinking – BPROG: Analysis
Utility and consumer choice
Utility: A Tool to Analyze Purchase Decisions
77. High price and low total utility indicate
a.
low marginal utility.
b.
large quantities are sold.
c.
high marginal utility.
d.
a high price/marginal utility ratio.
DISC: Utility and consumer choic – DISC: Utility and consumer choice
United States – BPROG: Analytic
Utility and consumer choice
Utility: A Tool to Analyze Purchase Decisions
78. Economists consider instances of increasing marginal utility to be
a.
normal.
b.
impossible.
c.
unusual, as in the case of addictions.
d.
irrational.
c
1
Easy
DISC: Utility and consumer choic – DISC: Utility and consumer choice
United States – BPROG: Analytic
Utility and consumer choice
Utility: A Tool to Analyze Purchase Decisions
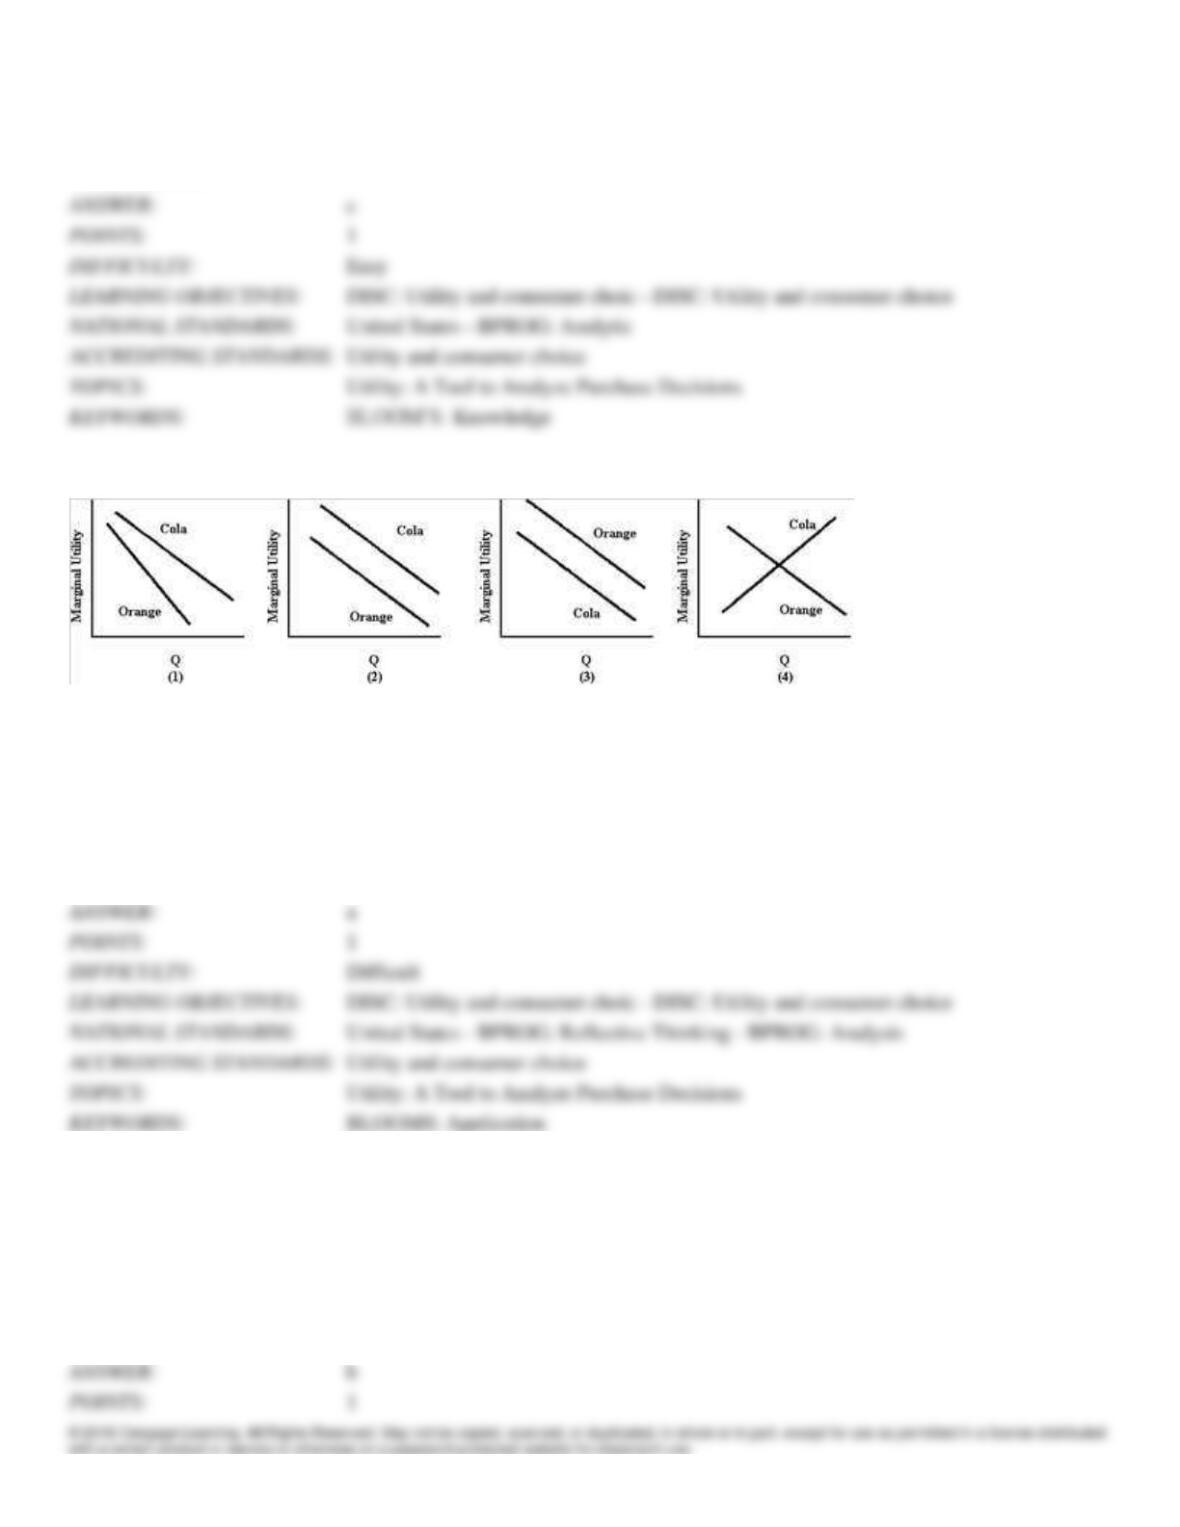
Figure 5-1
79. Americans choose cola over other flavors 70 percent of the time. Analysts say this is because cola’s flavor is more
robust and durable. Orange soda, for example, suffers from flavor fatigue faster than cola. Also, because cola contains
caffeine, people may be addicted to the stimulant. Which panel in Figure 5-1 best illustrates these facts?
a.
1
b.
2
c.
3
d.
4
a
1
Difficult
DISC: Utility and consumer choic – DISC: Utility and consumer choice
United States – BPROG: Reflective Thinking – BPROG: Analysis
Utility and consumer choice
Utility: A Tool to Analyze Purchase Decisions
BLOOMS: Application
80. A bottle of wine costs $8 and a quiche costs $5. At Robert’s present levels of consumption, he spends all his income
and receives marginal utility of $10 from the last bottle of wine and marginal utility of $4 from the last quiche. To
maximize his total utility, Robert should
a.
buy less wine and more quiche.
b.
buy more wine and less quiche.
c.
spend all of his money on wine.
d.
change his spending pattern until he buys 8/5ths as much wine as quiche.
b
1
DISC: Utility and consumer choic – DISC: Utility and consumer choice
United States – BPROG: Reflective Thinking – BPROG: Analysis
Utility and consumer choice
Utility: A Tool to Analyze Purchase Decisions
Table 5-1
Number of milkshakes consumed
1
2
3
Total utility from milkshakes (in $)
$23
$28
$31
Number of sandwiches consumed
1
2
3
Total utility from sandwiches (in $)
$40
$43
$45
81. Table 5-1 gives information on George’s total utility from consuming milkshakes and sandwiches. If George’s income
this week is $15, milkshakes are $3 each, and sandwiches $2, he will maximize his utility if he buys
a.
three milkshakes and two sandwiches.
b.
three milkshakes and three sandwiches.
c.
no milkshakes and as many sandwiches as possible.
d.
two milkshakes and three sandwiches.
b
1
DISC: Utility and consumer choic – DISC: Utility and consumer choice
United States – BPROG: Reflective Thinking – BPROG: Analysis
Utility and consumer choice
BLOOMS: Application
82. The theory of consumer choice is based on the hypothesis that each consumer wants to
a.
maximize her total utility.
b.
maximize her marginal utility.
c.
minimize the rate at which her marginal utility diminishes.
d.
minimize the percentage of her consumption diverted to inferior goods.
1
DISC: Utility and consumer choic – DISC: Utility and consumer choice
United States – BPROG: Analytic
Utility and consumer choice
Utility: A Tool to Analyze Purchase Decisions
83. The marginal utility of a unit of good X
a.
is always greater than the total utility of X.
b.
is always less than the average utility of X.
c.
generally depends on how much X the consumer already has.
d.
is always equal to the price of X.
DISC: Utility and consumer choic – DISC: Utility and consumer choice
United States – BPROG: Analytic
Utility and consumer choice
Utility: A Tool to Analyze Purchase Decisions
84. The marginal utility of a unit of good Y to Jane is
a.
the additional utility that Jane gets from consuming one more unit of Y.
b.
defined in money terms as the minimum amount Jane is willing to pay for that additional unit of Y.
c.
defined in money terms as the maximum amount Jane is willing to pay for all the Y she buys except that
additional unit.
d.
All of the above are correct.
DISC: Utility and consumer choic – DISC: Utility and consumer choice
United States – BPROG: Analytic
Utility and consumer choice
Utility: A Tool to Analyze Purchase Decisions
85. A consumer possesses five pounds of bananas and values their total utility at $2.14. If one additional pound is
acquired and marginal utility is 11 cents, total utility will
a.
rise to $2.25.
b.
fall to $2.03.
c.
stay the same.
d.
fall to $2.11.
DISC: Utility and consumer choic – DISC: Utility and consumer choice
United States – BPROG: Analytic
Utility and consumer choice
Utility: A Tool to Analyze Purchase Decisions
BLOOMS: Application
86. Marginal utility is
a.
the difference in price between one store and another.
b.
the difference in value between “some” of a thing and “none” of a thing.
c.
the difference between any two successive total utility figures.
d.
acquired only with the first few units of a good or service.
e.
utility that is barely satisfactory.
DISC: Utility and consumer choic – DISC: Utility and consumer choice
United States – BPROG: Analytic
Utility and consumer choice
Utility: A Tool to Analyze Purchase Decisions
87. Total utility
a.
diminishes as the quantity consumed of a good increases.
b.
increases as long as more goods are acquired.
c.
increases as long as marginal utility increases.
d.
increases as long as marginal utility is positive.
e.
diminishes as consumption of some good rises.
DISC: Utility and consumer choic – DISC: Utility and consumer choice
United States – BPROG: Analytic
Utility and consumer choice
Utility: A Tool to Analyze Purchase Decisions
88. Total utility will be at its maximum when
a.
marginal utility is negative.
b.
marginal utility is positive.
c.
marginal utility is maximized.
d.
marginal utility is zero.
DISC: Utility and consumer choic – DISC: Utility and consumer choice
United States – BPROG: Analytic
Utility and consumer choice
Utility: A Tool to Analyze Purchase Decisions
89. For most goods and most people, marginal utility probably
a.
continues to increase as larger quantities are purchased.
b.
plummets after the first few units but soon begins to rise.
c.
declines as consumption increases.
d.
is negative after the first unit of a good is purchased.
e.
is positive and rising for most goods.
Easy
DISC: Utility and consumer choic – DISC: Utility and consumer choice
United States – BPROG: Analytic
Utility and consumer choice
Utility: A Tool to Analyze Purchase Decisions
90. Elaine values the utility of her first cup of coffee at $1; a second cup, $.75; and a third cup, $.50. If Elaine drinks three
cups of coffee for breakfast, her total utility is equal to
a.
$.50, the value of her last cup of coffee.
b.
$1.00, the value of her first cup of coffee.
c.
marginal utility.
d.
$2.25.
e.
$1.50.
Easy
DISC: Utility and consumer choic – DISC: Utility and consumer choice
United States – BPROG: Analytic
Utility and consumer choice
Utility: A Tool to Analyze Purchase Decisions
BLOOMS: Application
91. Elaine values the utility of her first cup of coffee at $1; a second cup, $.75; and a third cup, $.50. If Elaine drinks three
cups of coffee for breakfast, her marginal utility is equal to
a.
$.50, the value of her last cup of coffee.
b.
$1.00, the value of her first cup of coffee.
c.
marginal utility.
d.
$2.25.
e.
$1.50.
a
Easy
DISC: Utility and consumer choic – DISC: Utility and consumer choice
United States – BPROG: Analytic
Utility and consumer choice
Utility: A Tool to Analyze Purchase Decisions
BLOOMS: Application
92. Jason considers a crystal bowl, a silver dish, and a pewter figurine, each priced $45 at the local gift shop. He chooses
the silver dish because, according to economic theory
a.
his marginal utility per dollar is greatest.
b.
his total utility is minimized.
c.
his marginal utility is equal to his total utility.
d.
silver costs more per ounce than pewter.
a
1
Moderate
DISC: Utility and consumer choic – DISC: Utility and consumer choice
United States – BPROG: Analytic
Utility and consumer choice
Utility: A Tool to Analyze Purchase Decisions
93. The law of diminishing marginal utility explains why
a.
most individual demand curves are straight lines.
b.
the consumer’s optimal purchase is at the tangency of an indifference curve and the budget line.
c.
most individual demand curves slope downward.
d.
marginal utility falls when total utility falls.
c
1
Moderate
DISC: Utility and consumer choic – DISC: Utility and consumer choice
United States – BPROG: Analytic
Utility and consumer choice
Utility: A Tool to Analyze Purchase Decisions
Table 5-2
Number of coconuts
0
1
2
3
4
Robinson’s marginal utility
C
$2.00
$1.88
$1.60
$1.30
94. According to Table 5-2, Robinson’s total utility from having two coconuts is ____.
a.
$1.87
b.
$1.66
c.
$3.88
d.
This is not determinable from the information in the table.
c
1
Moderate
DISC: Utility and consumer choic – DISC: Utility and consumer choice
United States – BPROG: Analytic
Utility and consumer choice
Utility: A Tool to Analyze Purchase Decisions
BLOOMS: Application
95. If total utility declines as an additional unit of a commodity is purchased,
a.
marginal utility must be rising.
b.
marginal utility is negative.
c.
marginal utility is positive but falling.
d.
its price must have risen.
e.
marginal utility is zero.
b
1
Moderate
DISC: Utility and consumer choic – DISC: Utility and consumer choice
United States – BPROG: Analytic
Utility and consumer choice
Utility: A Tool to Analyze Purchase Decisions
Table 5-1B
Number of coconuts
0
1
2
3
4
Robinson’s marginal utility
C
$2.00
$1.88
$1.60
$1.30
96. If a graph of Robinson’s marginal utility were constructed from Table 5-1B, it would
a.
illustrate the “law” of diminishing marginal utility.
b.
be a negatively sloped curve.
c.
illustrate a typical consumer’s satisfaction derived from consumption of consecutive units of a good.
d.
All of the above are correct.
d
1
Easy
DISC: Utility and consumer choic – DISC: Utility and consumer choice
United States – BPROG: Reflective Thinking – BPROG: Analysis
Utility and consumer choice
Utility: A Tool to Analyze Purchase Decisions
97. If the marginal utility to Juan of sleeping an extra hour (from 8 a.m. to 9 a.m.) is negative,
a.
Juan is better off getting up at 8 a.m.
b.
Juan is better off getting up at 9 a.m.
c.
Juan’s total utility from sleeping must be negative.
d.
Juan’s average utility from every hour he sleeps must be negative.
a
1
Easy
DISC: Utility and consumer choic – DISC: Utility and consumer choice
United States – BPROG: Analytic
Utility and consumer choice
Utility: A Tool to Analyze Purchase Decisions
98. The host at a party offers Justin a sixth beer. Justin says, “No thanks, man. The marginal utility of that fifth beer was,
like, 20 cents, but the marginal utility of the sixth would be minus 10 cents.” From his comments, we deduce that Justin
a.
is an alcoholic.
b.
may think that a sixth beer would make him sick.
c.
is irrational.
d.
wrongly estimates the marginal utility of the fifth beer.
DISC: Utility and consumer choic – DISC: Utility and consumer choice
United States – BPROG: Reflective Thinking – BPROG: Analysis
Utility and consumer choice
Utility: A Tool to Analyze Purchase Decisions
BLOOMS: Application
99. The host at a party offers Justin a sixth beer. Justin says, “No thanks, man. The marginal utility of that fifth beer was,
like, 20 cents, but the marginal utility of the sixth would be minus 10 cents.” If Justin consumes the sixth beer, his total
utility will
a.
rise by 10 cents.
b.
reach a plateau and remain constant.
c.
fall by 10 cents.
d.
fall below his marginal utility.
DISC: Utility and consumer choic – DISC: Utility and consumer choice
United States – BPROG: Reflective Thinking – BPROG: Analysis
Utility and consumer choice
Utility: A Tool to Analyze Purchase Decisions
100. The consumer maximizes his total utility (measured in money terms) when, at his chosen quantity of every good he
buys, marginal utility
a.
equals zero.
b.
divided by price equals zero.
c.
equals price.
d.
equals total utility.
DISC: Utility and consumer choic – DISC: Utility and consumer choice
United States – BPROG: Reflective Thinking – BPROG: Analysis
Utility and consumer choice
Utility: A Tool to Analyze Purchase Decisions
101. Tom is buying a quantity of wheat at which the marginal utility (in dollars) exceeds price. He should
a.
reduce wheat consumption, thus raising P to the level at which MU = P.
b.
reduce wheat consumption, thus raising MU to the level at which MU = P.
c.
increase wheat consumption, thus raising P to the level at which MU = P.
d.
increase wheat consumption, thus lowering MU to the level at which MU = P.
DISC: Utility and consumer choic – DISC: Utility and consumer choice
United States – BPROG: Analytic
Utility and consumer choice
Utility: A Tool to Analyze Purchase Decisions
102. Net utility is
a.
equal to total utility from the quantity acquired of a good minus the utility lost by having to pay for it.
b.
equal to the sum of the marginal utilities.
c.
equal to an optimal number easily calculated by the consumer.
d.
always greater than total utility.
DISC: Utility and consumer choic – DISC: Utility and consumer choice
United States – BPROG: Analytic
Utility and consumer choice
Utility: A Tool to Analyze Purchase Decisions
103. The optimal purchase rule is stated as
a.
TU = MU.
b.
MU = P.
c.
TU = P.
d.
MU = 0.
DISC: Utility and consumer choic – DISC: Utility and consumer choice
United States – BPROG: Analytic
Utility and consumer choice
Utility: A Tool to Analyze Purchase Decisions
104. As a general rule, consumers have
a.
limited income.
b.
unlimited desires for goods.
c.
many choices of goods facing them.
d.
All of the above are correct.
e.
None of the above are correct.
DISC: Utility and consumer choic – DISC: Utility and consumer choice
United States – BPROG: Analytic
Utility and consumer choice
Utility: A Tool to Analyze Purchase Decisions
105. Marginal utility has a negative slope. This is because of the
a.
optimal purchase rule.
b.
law of increasing costs.
c.
law of diminishing marginal utility.
d.
marginal rate of substitution.
DISC: Utility and consumer choic – DISC: Utility and consumer choice
United States – BPROG: Analytic
Utility and consumer choice
Utility: A Tool to Analyze Purchase Decisions
106. An individual’s demand curve for a good is ____ her marginal utility curve for the good.
a.
based on
b.
the mirror image around the vertical axis of
c.
twice as steep as
d.
half as steep as
DISC: Supply and demand
United States – BPROG: Analytic
Supply and demand
Utility: A Tool to Analyze Purchase Decisions
107. Which of the following statements is correct?
a.
The “law” of diminishing marginal utility implies that demand curves slope upward and to the right.
b.
If the price of a good falls, the utility-maximizing consumer will assure that marginal utility rises.
c.
If the price of a good falls, the consumer will purchase more of the good in order to maximize total utility.
d.
MU and demand have different underlying consumer behavior assumptions.
DISC: Supply and demand
United States – BPROG: Analytic
Supply and demand
Utility: A Tool to Analyze Purchase Decisions
108. Which of the following scenarios could be an example of increasing marginal utility?
a.
A father buying three game CDs for his son.
b.
A shopkeeper selling the tenth unit of hamburger.
c.
A philatelist buying an additional stamp for collection.
d.
A consumer buying an additional unit of apple.
DISC: Utility and consumer choic – DISC: Utility and consumer choice
United States – BPROG: Analytic
Utility and consumer choice
Utility: A Tool to Analyze Purchase Decisions
109. Consumer’s surplus is a measure of how much
a.
less than his income a consumer spends on goods.
b.
more utility a consumer receives from his purchases than he has to pay for them.
c.
a consumer’s marginal utility differs from his total utility.
d.
a change in price induces a consumer to substitute other goods.
DISC: Utility and consumer choic – DISC: Utility and consumer choice
United States – BPROG: Analytic
Utility and consumer choice
Consumer Choice as a Trade-Off: Opportunity Cost
110. Consumer’s surplus
a.
is the gap between total willingness to pay and the total market value of a good.
b.
guarantees that the market value of a good in money is equal to the total economic value of the good.
c.
is always negative because of diminishing marginal utility.
d.
is the total area under a consumer’s demand curve.
DISC: Utility and consumer choic – DISC: Utility and consumer choice
United States – BPROG: Analytic
Utility and consumer choice
Consumer Choice as a Trade-Off: Opportunity Cost
111. Consumer’s surplus can be written as
a.
total expenditure − total utility.
b.
total utility − total expenditure.
c.
marginal utility − marginal expenditure.
d.
marginal expenditure − marginal utility.
b
1
DISC: Utility and consumer choic – DISC: Utility and consumer choice
United States – BPROG: Analytic
Utility and consumer choice
Consumer Choice as a Trade-Off: Opportunity Cost
Table 5-4
Price
Quantity
in $
Demanded
80
1
70
2
60
3
50
4
40
5
30
6
20
7
10
8
112. Table 5-4 shows the demand schedule for concert tickets for a particular consumer. What will be this consumer’s
surplus if the price of tickets is $50?
a.
$200
b.
$60
c.
$260
d.
$210
b
1
DISC: Utility and consumer choic – DISC: Utility and consumer choice
United States – BPROG: Reflective Thinking – BPROG: Analysis
Utility and consumer choice
Consumer Choice as a Trade-Off: Opportunity Cost
113. Gwen’s decision to buy a new television instead of a bicycle for the same price
a.
means that opportunity cost is zero since both cost the same amount.
b.
would not have involved trade-off and opportunity cost if Gwen had decided to put the money in a bank CD
instead.
c.
would not imply a trade-off because of scarcity if Gwen were a multimillionaire.
d.
means that the opportunity cost to Gwen is the bicycle that she has given up.
d
1
Moderate
DISC: Utility and consumer choic – DISC: Utility and consumer choice
United States – BPROG: Reflective Thinking – BPROG: Analysis
Utility and consumer choice
Consumer Choice as a Trade-Off: Opportunity Cost
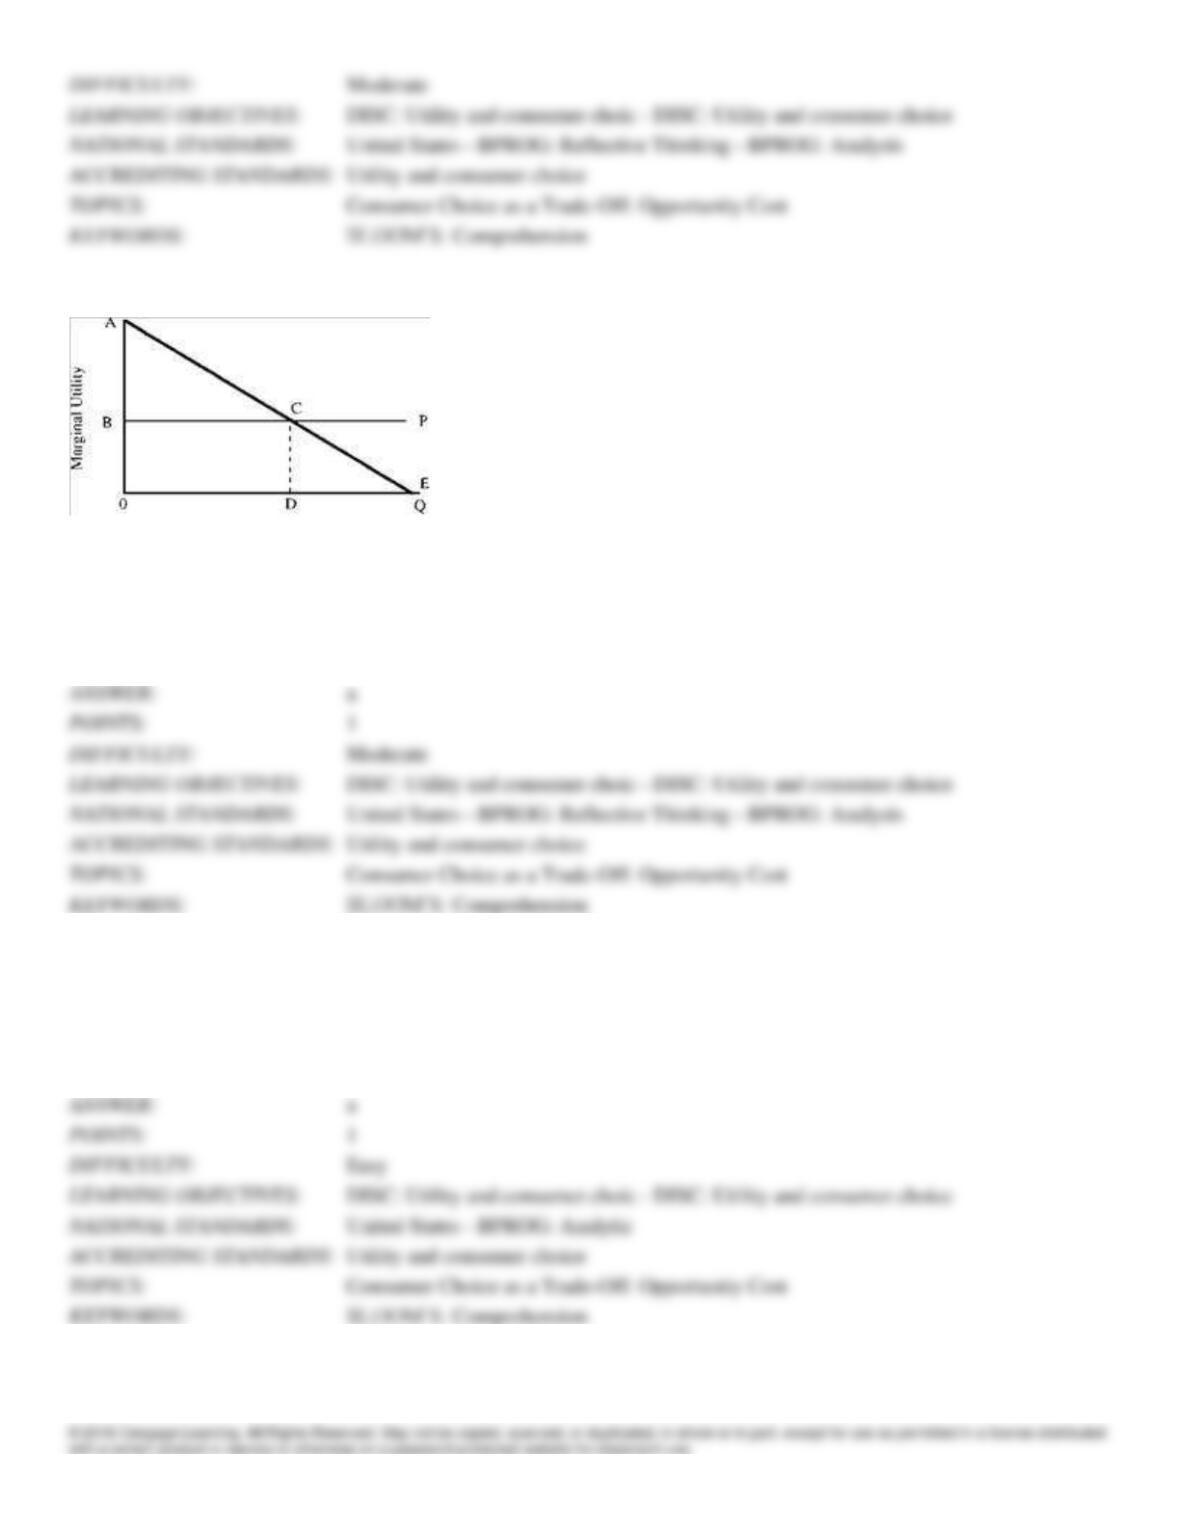
Figure 5-2
114. In Figure 5-2, consumer surplus is measured by the area
a.
ABC.
b.
OBCD.
c.
OACD.
d.
DCE.
a
Moderate
DISC: Utility and consumer choic – DISC: Utility and consumer choice
United States – BPROG: Reflective Thinking – BPROG: Analysis
Utility and consumer choice
Consumer Choice as a Trade-Off: Opportunity Cost
115. Adam Smith’s diamond-water puzzle
a.
can be resolved by distinguishing between marginal and total utility.
b.
occurs because diamonds have no utility.
c.
occurs because scarcity increases total utility.
d.
will likely never be resolved with existing economic tools.
a
Easy
DISC: Utility and consumer choic – DISC: Utility and consumer choice
United States – BPROG: Analytic
Utility and consumer choice
Consumer Choice as a Trade-Off: Opportunity Cost
116. Resolving Adam Smith’s diamond-water puzzle involves
a.
realizing that price is not directly related to total utility.
b.
knowing that at optimal purchase, price will tend to equal marginal utility.
c.
knowing that, as increasing quantities of a good are consumed, marginal utility diminishes and, conversely,
consuming a small quantity of a good produces high marginal utility.
d.
All of the above are correct.
DISC: Utility and consumer choic – DISC: Utility and consumer choice
United States – BPROG: Reflective Thinking – BPROG: Analysis
Utility and consumer choice
Consumer Choice as a Trade-Off: Opportunity Cost
117. Suppose that Joan, the only consumer of pork, has a downward-sloping demand curve for pork and faces an upward-
sloping supply curve. If her demand curve shifts out because she develops a craving for pork, then at the new equilibrium
(everything else equal),
a.
the price of pork relative to other goods will be higher than before.
b.
Joan’s marginal utility from every unit of pork she eats will be higher than before.
c.
Joan’s real income will be lower than before.
d.
All of the above are correct.
DISC: Utility and consumer choic – DISC: Utility and consumer choice
United States – BPROG: Analytic
Utility and consumer choice
Consumer Choice as a Trade-Off: Opportunity Cost
118. An inferior good is one
a.
produced by American industries.
b.
whose quantity demanded falls when the purchaser’s income rises.
c.
ordinarily bought by college students from college-town merchants.
d.
suitable for a garage sale.
DISC: Supply and demand
United States – BPROG: Analytic
Supply and demand
Consumer Choice as a Trade-Off: Opportunity Cost
119. For a ____, if incomes rise and prices do not change, quantity demanded will increase.
a.
normal good
b.
inferior good
c.
Giffen good
d.
substitute good
DISC: Supply and demand
United States – BPROG: Analytic
Supply and demand
Consumer Choice as a Trade-Off: Opportunity Cost
120. A normal good is a good whose quantity demanded
a.
rises when its price falls.
b.
falls when the price of a related good falls.
c.
falls when the consumer’s total utility rises.
d.
rises when the consumer’s real income increases.
DISC: Supply and demand
United States – BPROG: Analytic
Supply and demand
Consumer Choice as a Trade-Off: Opportunity Cost
121. An inferior good is a good whose quantity demanded
a.
rises when its price falls.
b.
falls when the price of a related good falls.
c.
falls when the consumer’s total utility rises.
d.
rises when the consumer’s real income falls.
DISC: Supply and demand
United States – BPROG: Analytic
Supply and demand
Consumer Choice as a Trade-Off: Opportunity Cost
122. When the price of one product falls,
a.
consumers’ real income will increase.
b.
consumers will buy less of that product.
c.
consumers will not change their buying patterns.
d.
consumers’ real income will decrease.
DISC: Supply and demand
United States – BPROG: Analytic
Supply and demand
Consumer Choice as a Trade-Off: Opportunity Cost
123. The Wall Street Journal reports that “hard times aid poultry companies as people eat cheaper fowl.” In the language
of economists, this means
a.
chicken is an inferior good.
b.
chicken has a negative substitution effect.
c.
chicken has a positive substitution effect.
d.
people’s tastes change during recessions.
e.
chicken has a positive income effect.
DISC: Supply and demand
United States – BPROG: Analytic
Supply and demand
Consumer Choice as a Trade-Off: Opportunity Cost
124. Market demand curves are found by
a.
vertically summing individual demand curves.
b.
horizontally summing individual demand curves.
c.
summing individual demand curves in a parallel fashion.
d.
adding the slopes of individual demand curves.
DISC: Supply and demand
United States – BPROG: Analytic
Supply and demand
From Individual Demand Curves to Market Demand Curves
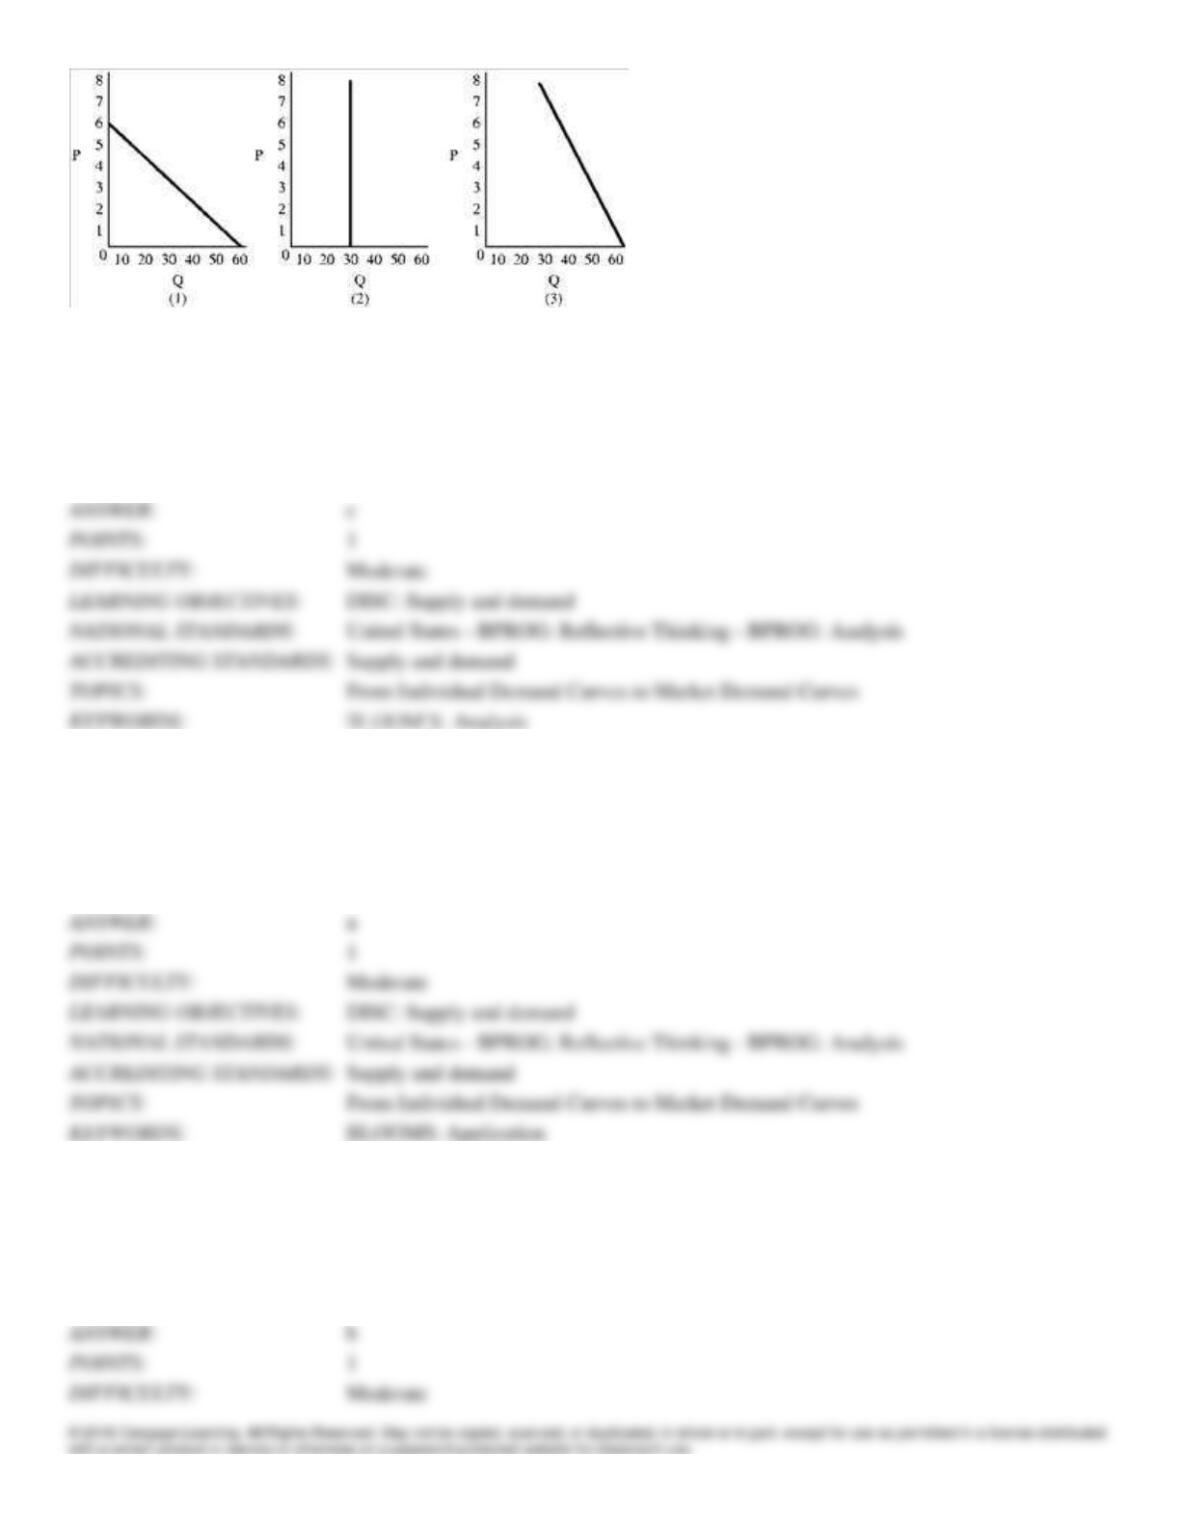
125. Assume the market consists of three consumers with the demand curves in Figure 5–3. At a price of 1, the total
market demand is
a.
40.
b.
80.
c.
140.
d.
150.
DISC: Supply and demand
United States – BPROG: Reflective Thinking – BPROG: Analysis
Supply and demand
From Individual Demand Curves to Market Demand Curves
126. In Figure 5-3, a decline in price from 3 to 1 will increase market quantity demanded by
a.
30.
b.
40.
c.
50.
d.
60.
DISC: Supply and demand
United States – BPROG: Reflective Thinking – BPROG: Analysis
Supply and demand
From Individual Demand Curves to Market Demand Curves
BLOOMS: Application
127. Market demand curves may slope downward even if some individual demand curves do not because
a.
the law of demand requires that this is true.
b.
lower prices may bring more purchasers into the market.
c.
merchants try to sell more at lower prices.
d.
people believe expensive goods are better goods.
DISC: Supply and demand
United States – BPROG: Analytic
Supply and demand
From Individual Demand Curves to Market Demand Curves
128. The market demand curve
a.
and the individual demand curve are synonymous.
b.
is calculated by multiplying the number of consumers by the individual demand curve.
c.
shows how the total quantity demanded of some good changes as price changes, other things held constant.
d.
can be calculated even if individual demand curves are unknown.
DISC: Supply and demand
United States – BPROG: Analytic
Supply and demand
From Individual Demand Curves to Market Demand Curves
129. In Poland’s free market, Felix Siemienas is making a fortune in cold cuts. Prices are much higher than formerly.
Siemienas says, “Yes, my prices are high. If nobody buys, I bring my prices down. That is the market rule.” This “rule”
best describes
a.
the law of diminishing returns.
b.
opportunity cost.
c.
the law of increasing costs.
d.
the law of demand.
DISC: Supply and demand
United States – BPROG: Analytic
Supply and demand
From Individual Demand Curves to Market Demand Curves
BLOOMS: Application
130. A well-known women’s college whose tuition lagged below similar schools found recruiting difficult and enrollment
falling. A substantial tuition increase was implemented, and dormitories were soon full again. This can be explained by
a.
the law of demand.
b.
the fact that education at the school was an inferior good.
c.
the fact that people sometimes base perceptions of quality on price (snob effect).
d.
elastic demand.
DISC: Supply and demand
United States – BPROG: Analytic
Supply and demand
From Individual Demand Curves to Market Demand Curves
131. The law of demand states that as the price
a.
increases, total quantity demanded will increase.
b.
decreases, total quantity demanded will decrease.
c.
increases, total quantity demanded will decrease.
d.
increases, total quantity demanded will stay the same.
DISC: Supply and demand
United States – BPROG: Analytic
Supply and demand
From Individual Demand Curves to Market Demand Curves
132. According to the “law” of demand, we would expect
a.
the demand curve to be negatively sloped.
b.
the demand curve to be positively sloped.
c.
the total quantity demanded by the market to move in the same direction as price.
d.
marginal utility to increase as quantity demanded increases.
DISC: Supply and demand
United States – BPROG: Analytic
Supply and demand
From Individual Demand Curves to Market Demand Curves
133. An increase in a family’s income will cause its budget line to
a.
become steeper.
b.
become flatter (less steep).
c.
move closer to the origin.
d.
move away from the origin.
e.
become more convex toward the origin.
DISC: Utility and consumer choic – DISC: Utility and consumer choice
United States – BPROG: Analytic
Utility and consumer choice
Appendix: Geometry of Available Choices: The Budget Line