KEYWORDS:
BLOOM’S: Comprehension
134. A budget line is a straight line designed to show
a.
how income is related to hours worked.
b.
all combinations of two goods that can be purchased with a given income.
c.
the way a homemaker should divide money among several commodities.
d.
that if more money is spent on one good, the breadwinner must work all the harder to maintain a satisfactory
level of living.
e.
preferences for goods and services.
ANSWER:
POINTS:
DIFFICULTY:
DISC: Utility and consumer choic – DISC: Utility and consumer choice
United States – BPROG: Analytic
Utility and consumer choice
TOPICS:
Appendix: Geometry of Available Choices: The Budget Line
KEYWORDS:
BLOOM’S: Comprehension
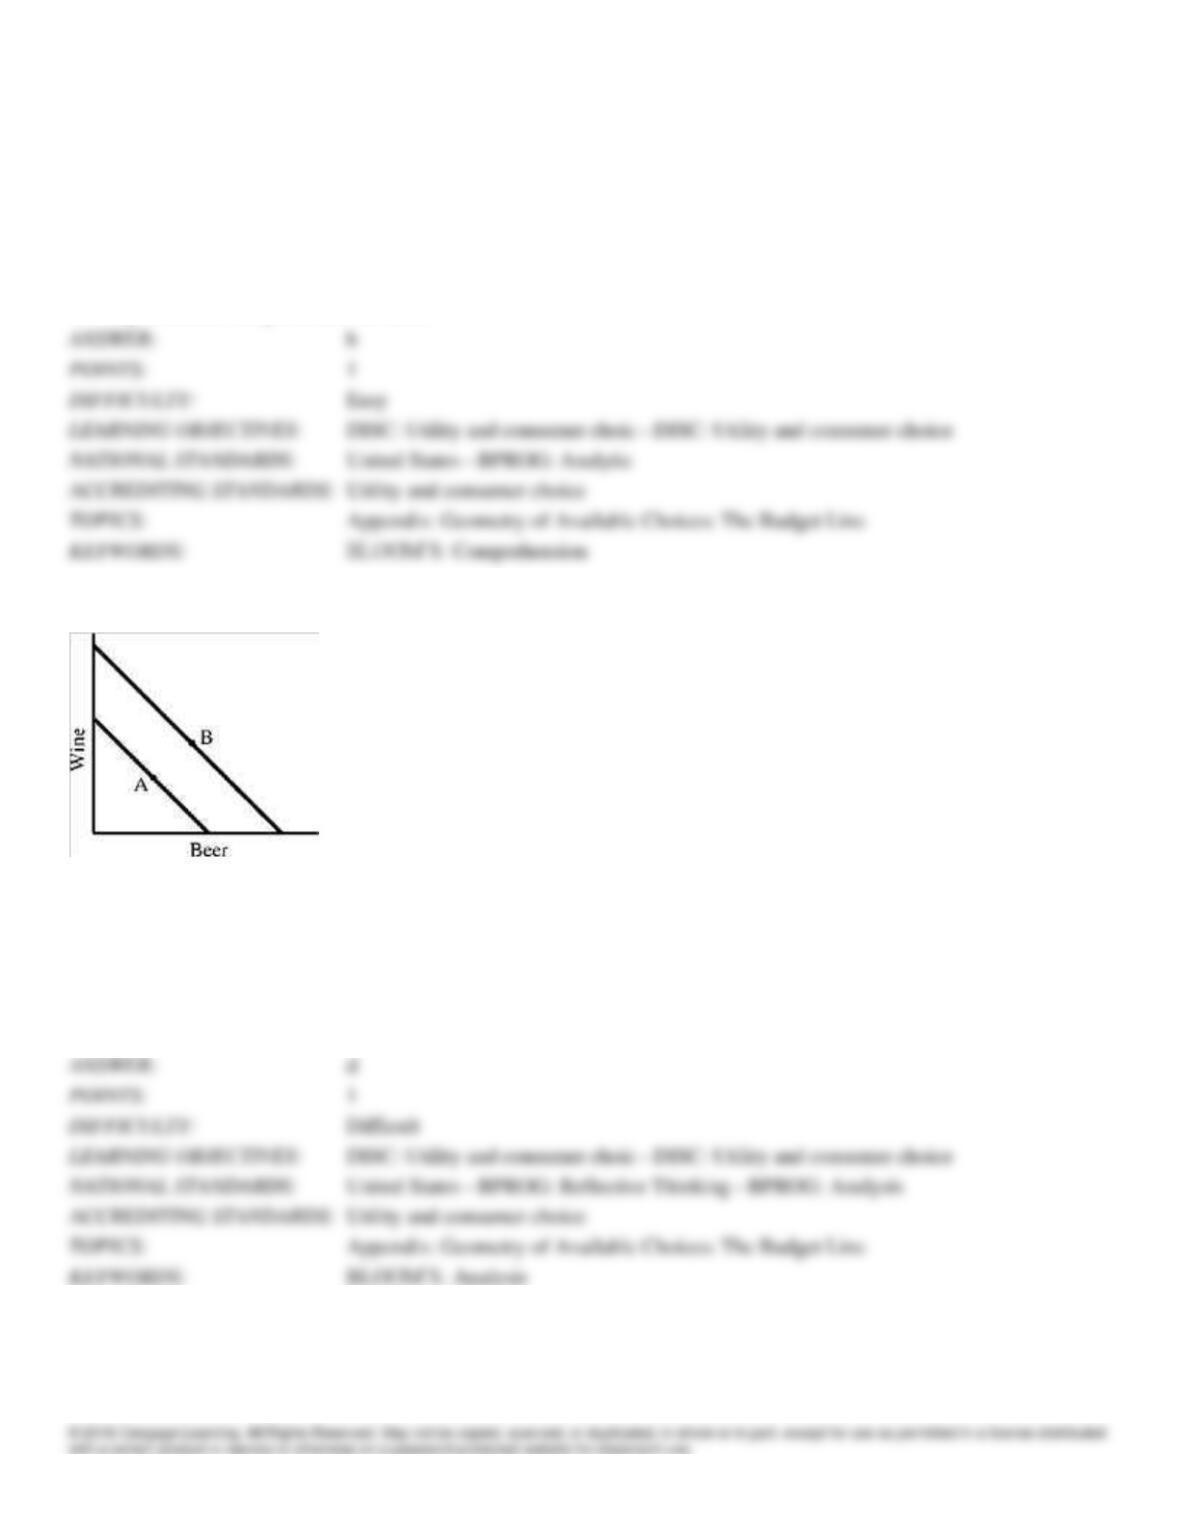
Figure 5-4
135. In Figure 5-4, the rightward shift in budget lines from the one containing point A to the one containing point B
a.
resulted from equal price reductions in beer and wine.
b.
resulted from an increase in the consumer’s income.
c.
could have been caused by income or price changes.
d.
All of the answers above are correct possibilities.
e.
None of the above is correct.
ANSWER:
POINTS:
DIFFICULTY:
DISC: Utility and consumer choic – DISC: Utility and consumer choice
United States – BPROG: Reflective Thinking – BPROG: Analysis
Utility and consumer choice
TOPICS:
Appendix: Geometry of Available Choices: The Budget Line
KEYWORDS:
136. The budget line facing a household includes information on
a.
prices of two goods and household income.
b.
household income and the price of money.
c.
the price of one good and household income.
d.
the price of two goods but no information on household income.
e.
preferences of goods at various prices.
DISC: Utility and consumer choic – DISC: Utility and consumer choice
United States – BPROG: Analytic
Utility and consumer choice
Appendix: Geometry of Available Choices: The Budget Line
137. What would happen to the budget line if income as well as prices of both goods increase by the same percentage?
a.
A rightward parallel shift in the budget line.
b.
A leftward parallel shift in the budget line.
c.
A rightward shift in the budget line.
d.
No shift in the budget line.
DISC: Utility and consumer choic – DISC: Utility and consumer choice
United States – BPROG: Reflective Thinking – BPROG: Analysis
Utility and consumer choice
Appendix: Geometry of Available Choices: The Budget Line
Figure 5-5
138. Figure 5-5 shows a consumer budget line for french fries and hamburgers. The price of an order fries is $2. The price
of a burger is
a.
$1.
b.
$2.
c.
$4.
d.
$8.
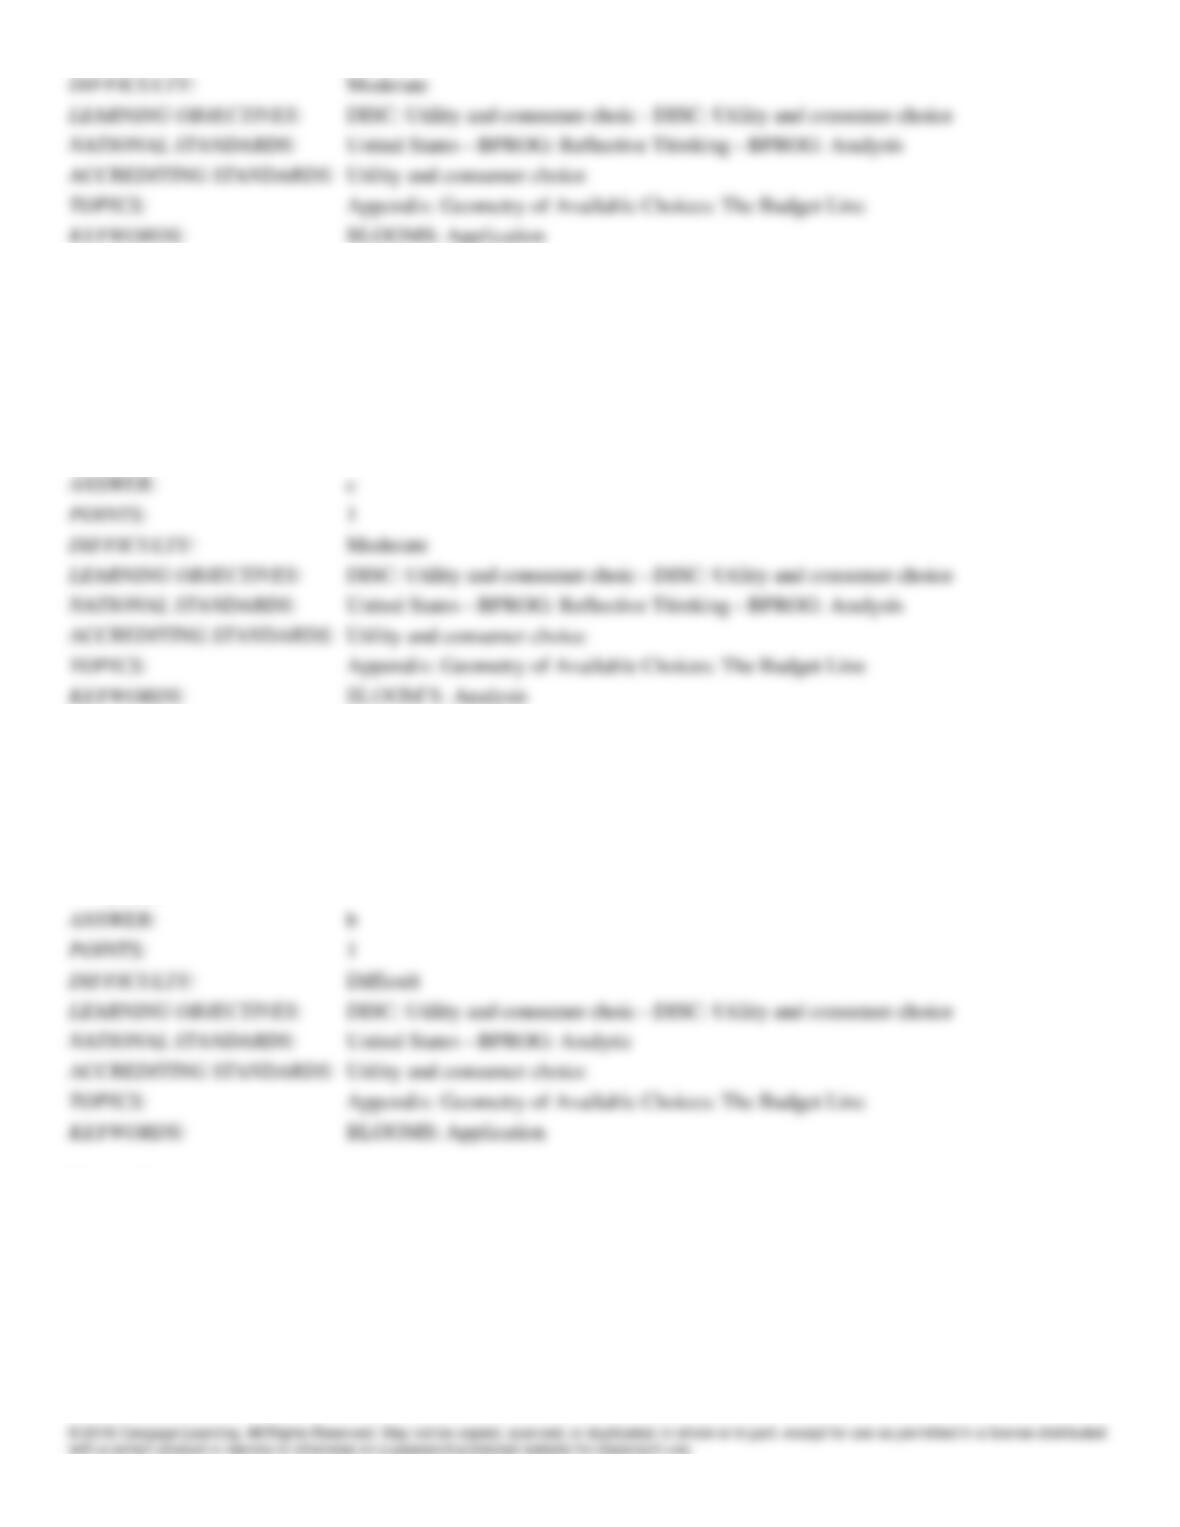
139. Figure 5-5 shows a consumer budget line for French fries and hamburgers. The household allocates a budget for
these two goods.. If the price of an order of french fries is $2, how much income is allocated to fries and burgers
combined?
a.
$2
b.
$4
c.
$20
d.
$40
140. In Figure 5-5, if the household is spending enough of its budget to purchase 4 orders of fries and the price of an order
of fries is $2, the remainder of the budget available for hamburgers is
a.
$10.
b.
$12.
c.
$16.
d.
$20.
Figure 5-6
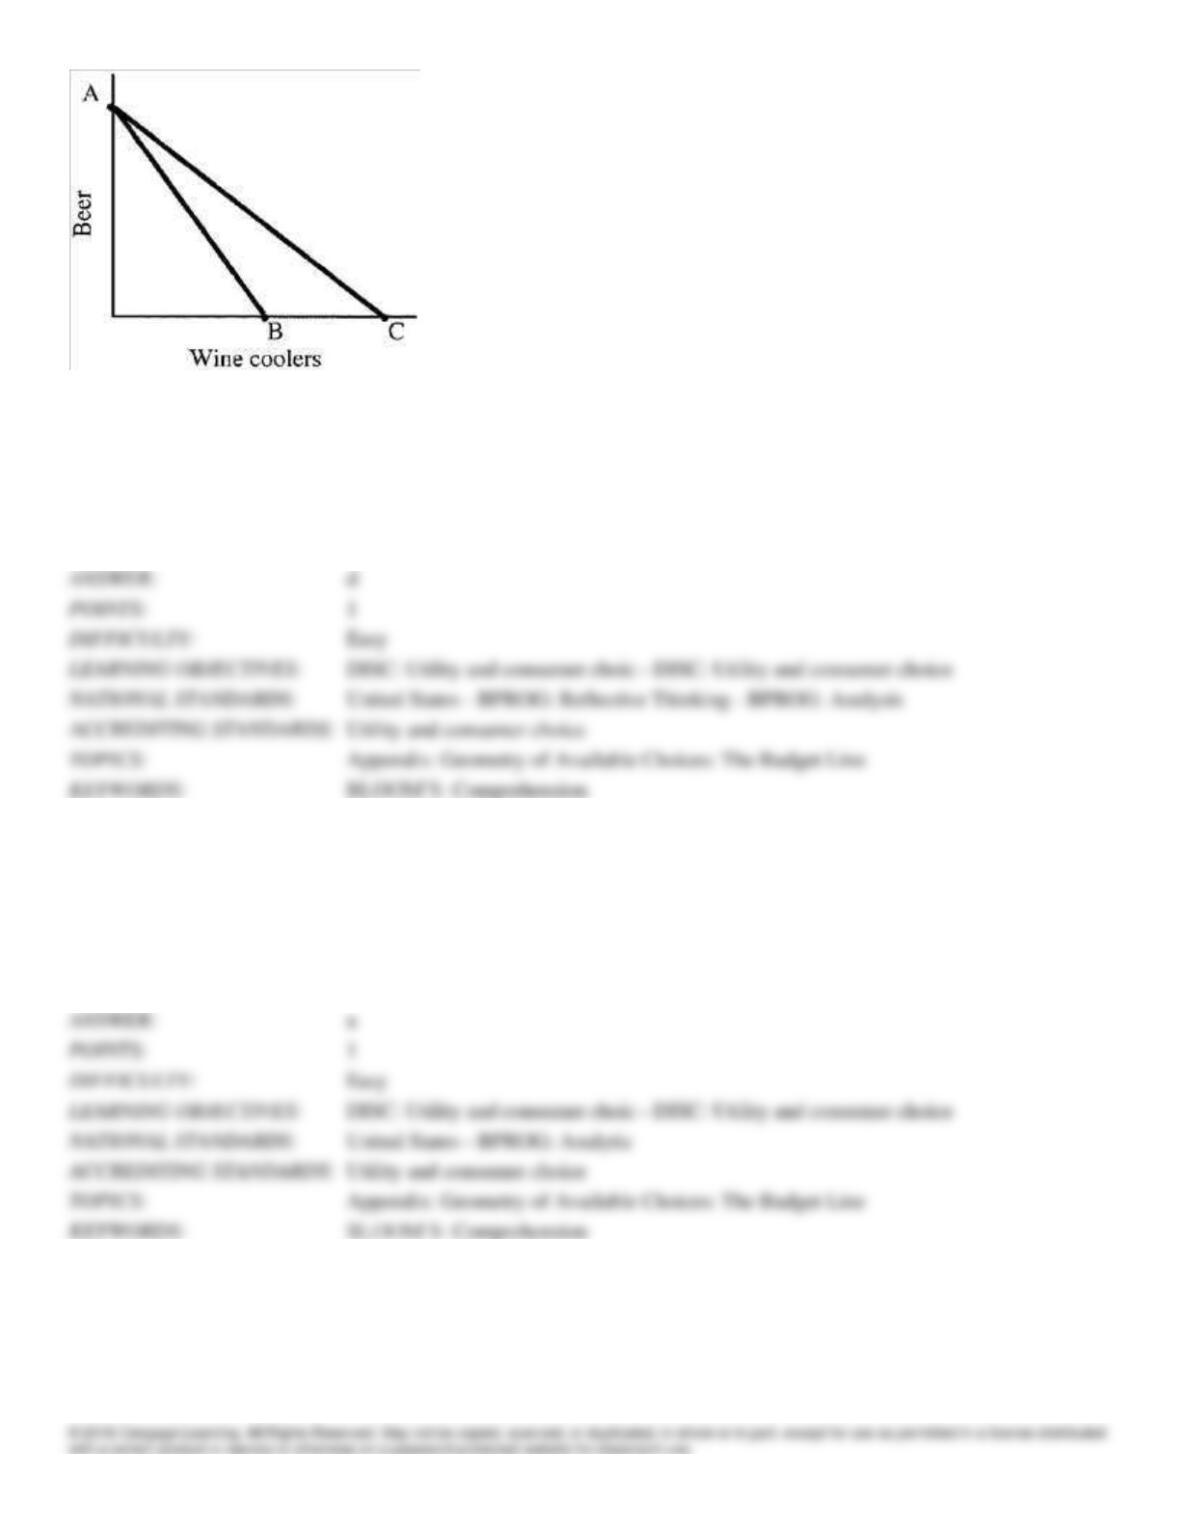
141. A shift in the budget line in Figure 5-6 from AB to AC indicates
a.
the price of wine coolers has risen.
b.
income has increased.
c.
the price of beer has fallen.
d.
the price of wine coolers has fallen.
e.
All of the above are correct.
DISC: Utility and consumer choic – DISC: Utility and consumer choice
United States – BPROG: Reflective Thinking – BPROG: Analysis
Utility and consumer choice
Appendix: Geometry of Available Choices: The Budget Line
142. In Figure 5-6, a shift in the budget line from AC to AB indicates
a.
the price of wine coolers has risen.
b.
income has increased.
c.
the price of beer has fallen.
d.
the price of wine coolers has fallen.
e.
All of the above are correct.
DISC: Utility and consumer choic – DISC: Utility and consumer choice
United States – BPROG: Analytic
Utility and consumer choice
Appendix: Geometry of Available Choices: The Budget Line
143. Which of the following observations is not true of a budget line?
a.
It indicates what choices are available to the consumer.
b.
It is a curve of constant expenditure.
c.
Its slope reports the market terms on which the consumer can trade one good for another.
d.
It helps examine the consumer’s preferences.
DISC: Utility and consumer choic – DISC: Utility and consumer choice
United States – BPROG: Analytic
Utility and consumer choice
Appendix: Geometry of Available Choices: The Budget Line
144. An indifference curve is a line showing
a.
combinations of goods that can be produced if all resources are fully employed.
b.
all combinations of two commodities that are equally desirable to the consumer.
c.
all combinations of goods over which the consumer has no choice.
d.
how decisions are made in a nonmarket economy.
DISC: Utility and consumer choic – DISC: Utility and consumer choice
United States – BPROG: Analytic
Utility and consumer choice
Appendix: What the Consumer Prefers: Properties of the Indifference Curve
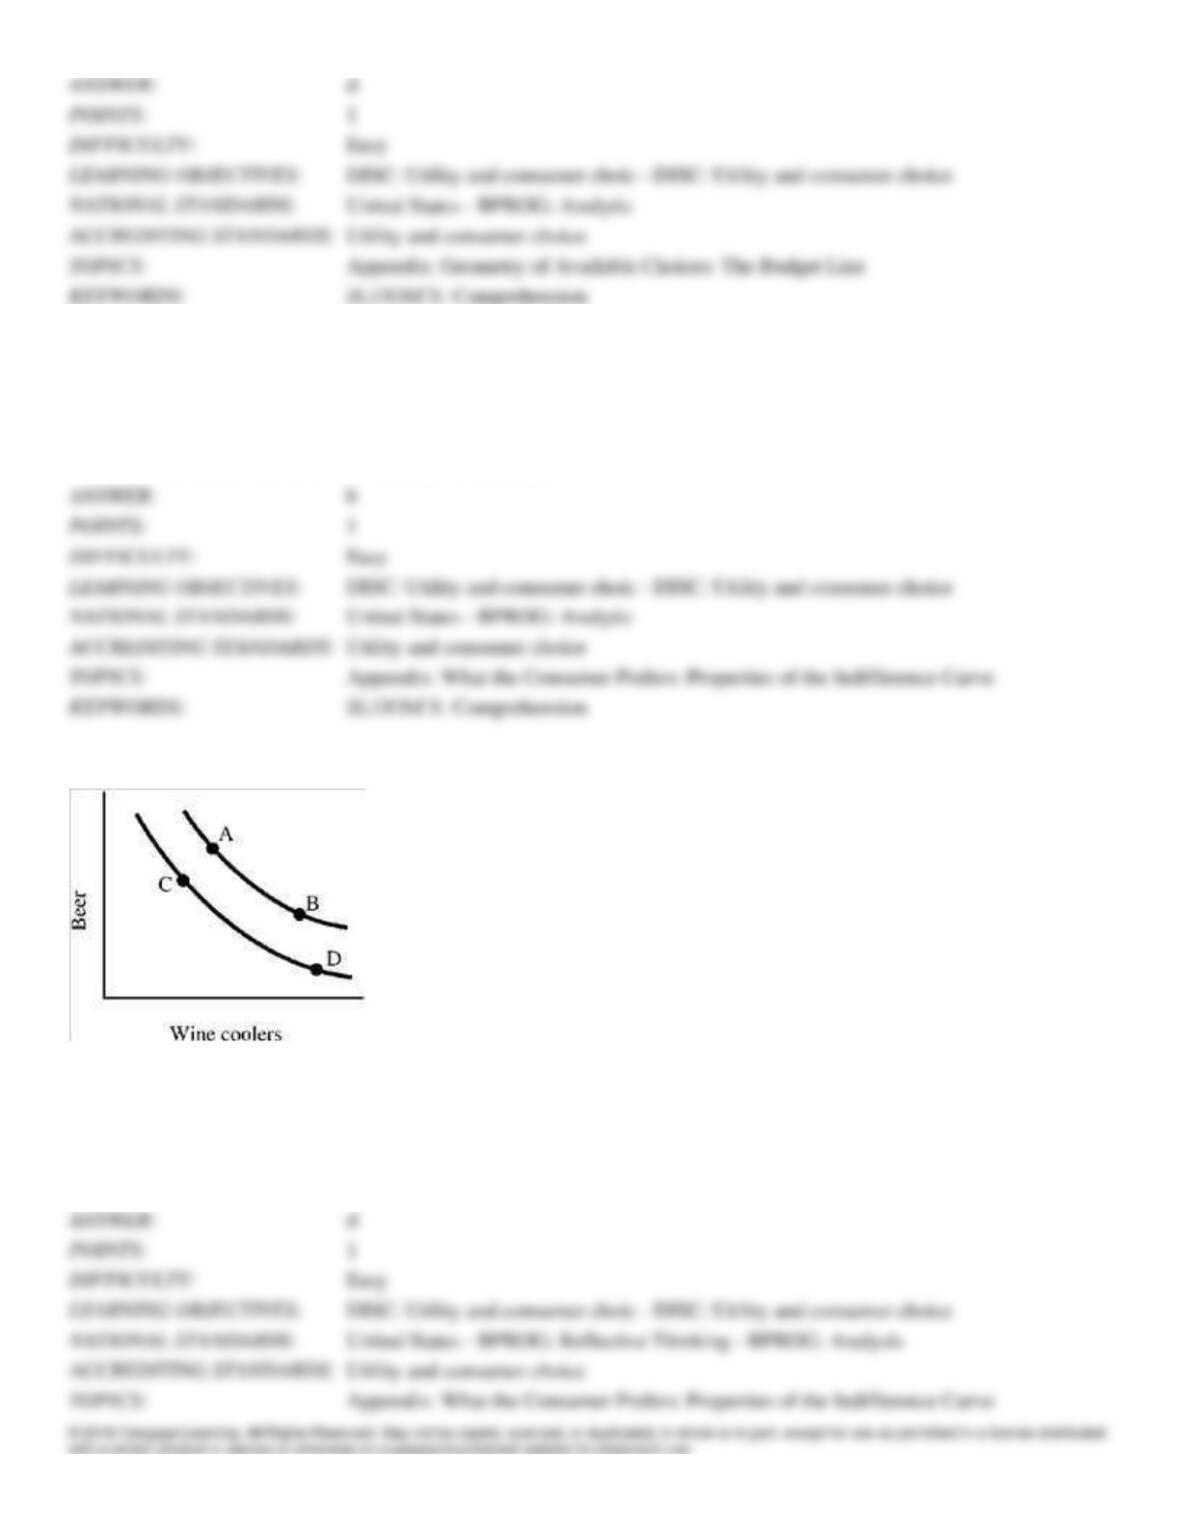
Figure 5-8
145. In Figure 5-8, the consumer is indifferent between the combinations of beer and wine coolers indicated by points
a.
A, C.
b.
B, D.
c.
C, B.
d.
A, B.
DISC: Utility and consumer choic – DISC: Utility and consumer choice
United States – BPROG: Reflective Thinking – BPROG: Analysis
Utility and consumer choice
Appendix: What the Consumer Prefers: Properties of the Indifference Curve
BLOOMS: Application
146. Which of the following is characteristic of indifference curves?
a.
They are negatively sloped.
b.
They never intersect.
c.
They are convex toward the origin.
d.
All of the above are correct.
DISC: Utility and consumer choic – DISC: Utility and consumer choice
United States – BPROG: Analytic
Utility and consumer choice
Appendix: What the Consumer Prefers: Properties of the Indifference Curve
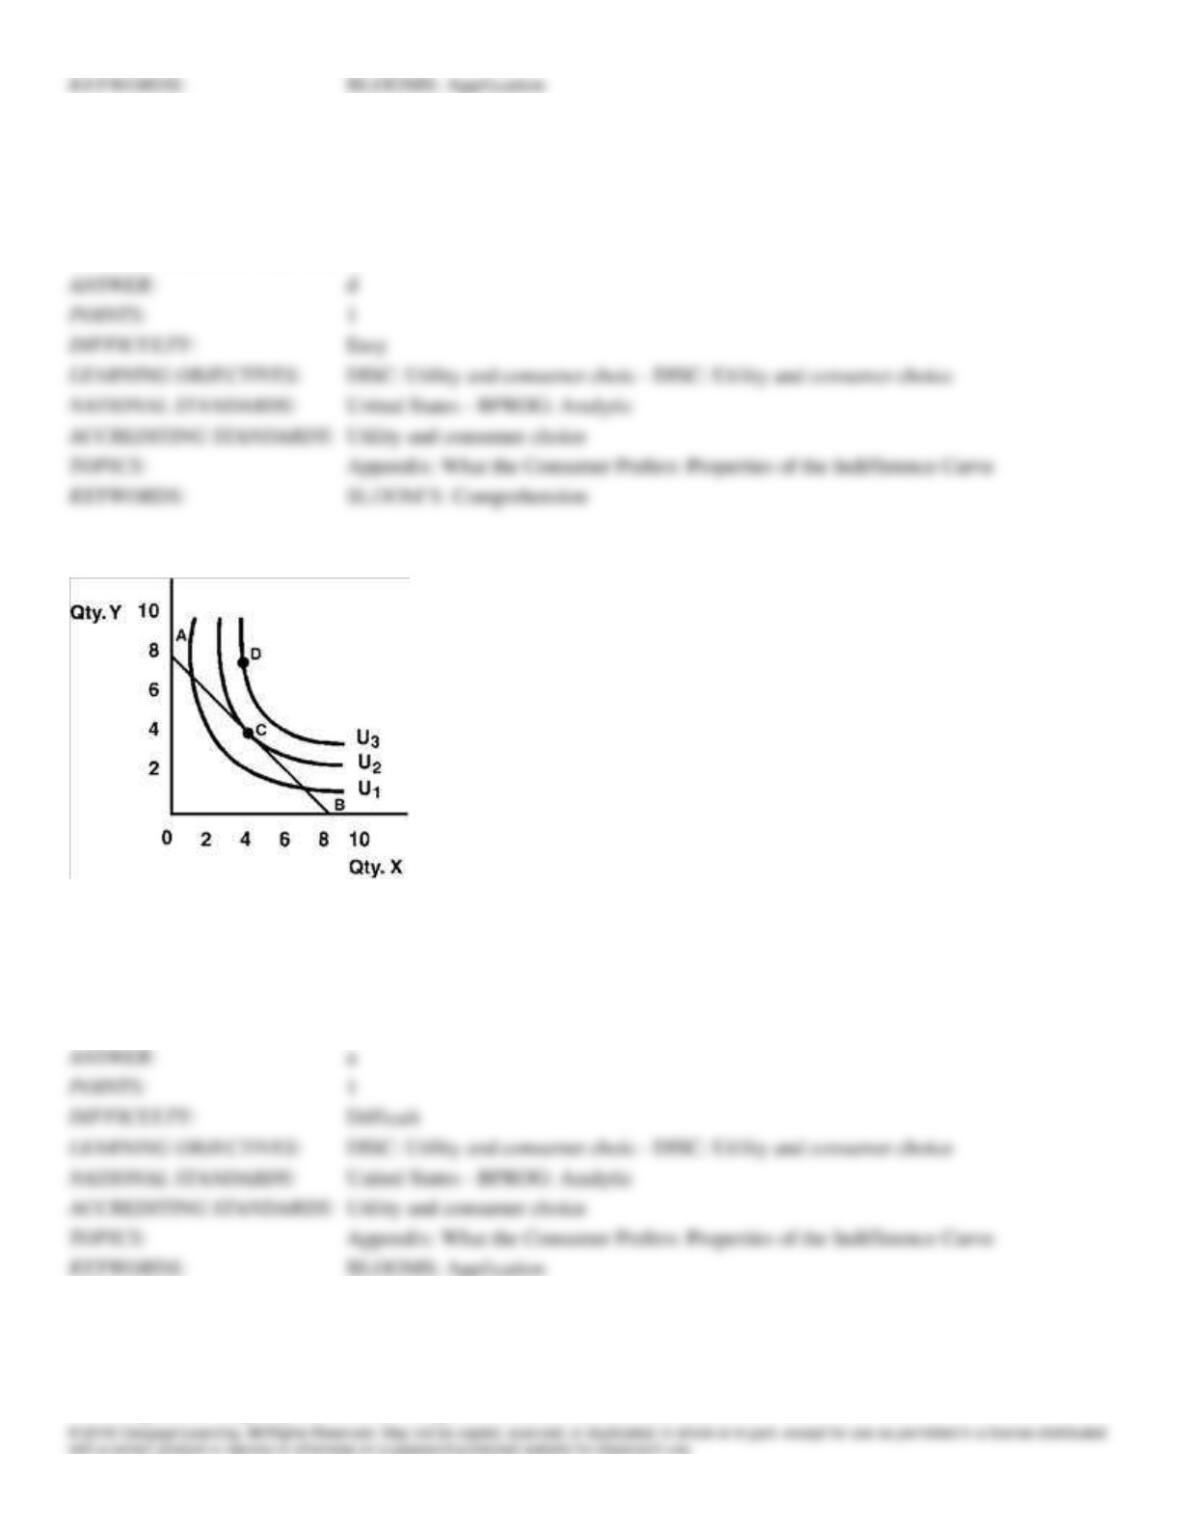
Figure 5-9
147. In Figure 5-9, the consumer’s marginal rate of substitution at his optimum choice of X and Y is
a.
−1.
b.
16.
c.
8.
d.
−8.
DISC: Utility and consumer choic – DISC: Utility and consumer choice
United States – BPROG: Analytic
Utility and consumer choice
Appendix: What the Consumer Prefers: Properties of the Indifference Curve
BLOOMS: Application
148. The optimal combination of goods for a consumer to purchase is shown by
a.
any intersection of the indifference curve and the budget line.
b.
the point where the budget line touches the vertical axis.
c.
a point of tangency between the budget line and the indifference curve.
d.
the point at which the indifference curve parallels the horizontal axis.
e.
the intersection of two indifference curves.
DISC: Utility and consumer choic – DISC: Utility and consumer choice
United States – BPROG: Analytic
Utility and consumer choice
Appendix: The Slopes of Indifference Curves and Budget Lines
149. If indifference curves and budget lines are used to analyze consumer choice, an inferior good will
a.
escape detection when income rises.
b.
be easily identified because the quantity purchased will fall as income rises.
c.
be easily identified because the quantity purchased will rise as income rises.
d.
be easily identified because it will change the slope of the budget line.
e.
escape detection because this model does not show that relationship.
DISC: Utility and consumer choic – DISC: Utility and consumer choice
United States – BPROG: Reflective Thinking – BPROG: Analysis
Utility and consumer choice
Appendix: The Slopes of Indifference Curves and Budget Lines
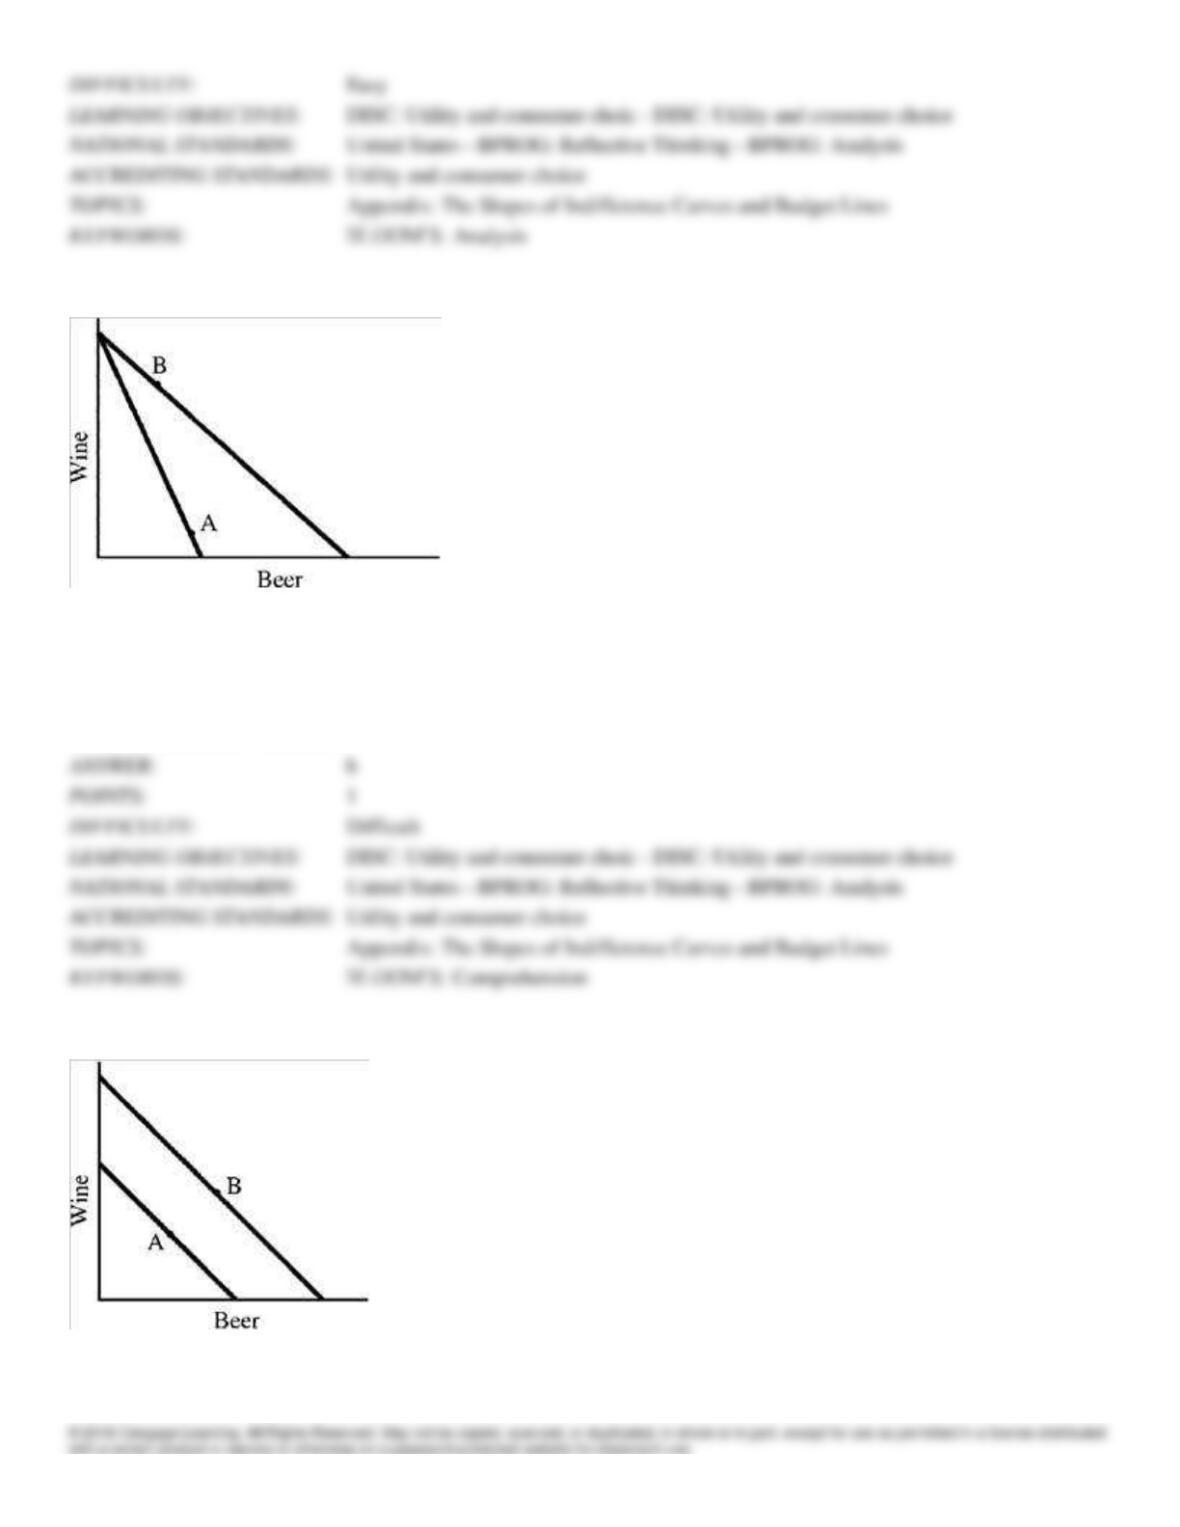
Figure 5-10
150. In the indifference curve pictured in Figure 5-10, which of the following is clearly true?
a.
B is preferred to D.
b.
B is preferred to C.
c.
A is preferred to B.
d.
C is preferred to D.
DISC: Utility and consumer choic – DISC: Utility and consumer choice
United States – BPROG: Reflective Thinking – BPROG: Analysis
Utility and consumer choice
Appendix: The Slopes of Indifference Curves and Budget Lines
Figure 5-11
151. In Figure 5-11, a consumer is initially at point A. There is a price change and she moves to B. It follows that
a.
the demand for beer follows the law of demand.
b.
the demand for beer does not follow the law of demand.
c.
wine is an inferior good.
d.
the consumer is confused.
DISC: Utility and consumer choic – DISC: Utility and consumer choice
United States – BPROG: Reflective Thinking – BPROG: Analysis
Utility and consumer choice
Appendix: The Slopes of Indifference Curves and Budget Lines
Figure 5-12
152. In Figure 5-12, the move in the consumer equilibrium from A to B shows that
a.
beer is an inferior good, but wine is a normal good.
b.
wine is an inferior good, but beer is a normal good.
c.
both beer and wine are normal goods.
d.
both beer and wine are inferior goods.
DISC: Utility and consumer choic – DISC: Utility and consumer choice
United States – BPROG: Reflective Thinking – BPROG: Analysis
Utility and consumer choice
Appendix: The Slopes of Indifference Curves and Budget Lines
153. For a consumer to maximize utility, he will choose the
a.
point where the slope of the budget line equals the slope of the indifference curve.
b.
any point where the budget line and indifference curve intersect.
c.
point where he gets the most of the good he prefers most.
d.
point where the marginal rate of substitution is greatest.
e.
the point where marginal utility is zero for both goods
DISC: Utility and consumer choic – DISC: Utility and consumer choice
United States – BPROG: Analytic
Utility and consumer choice
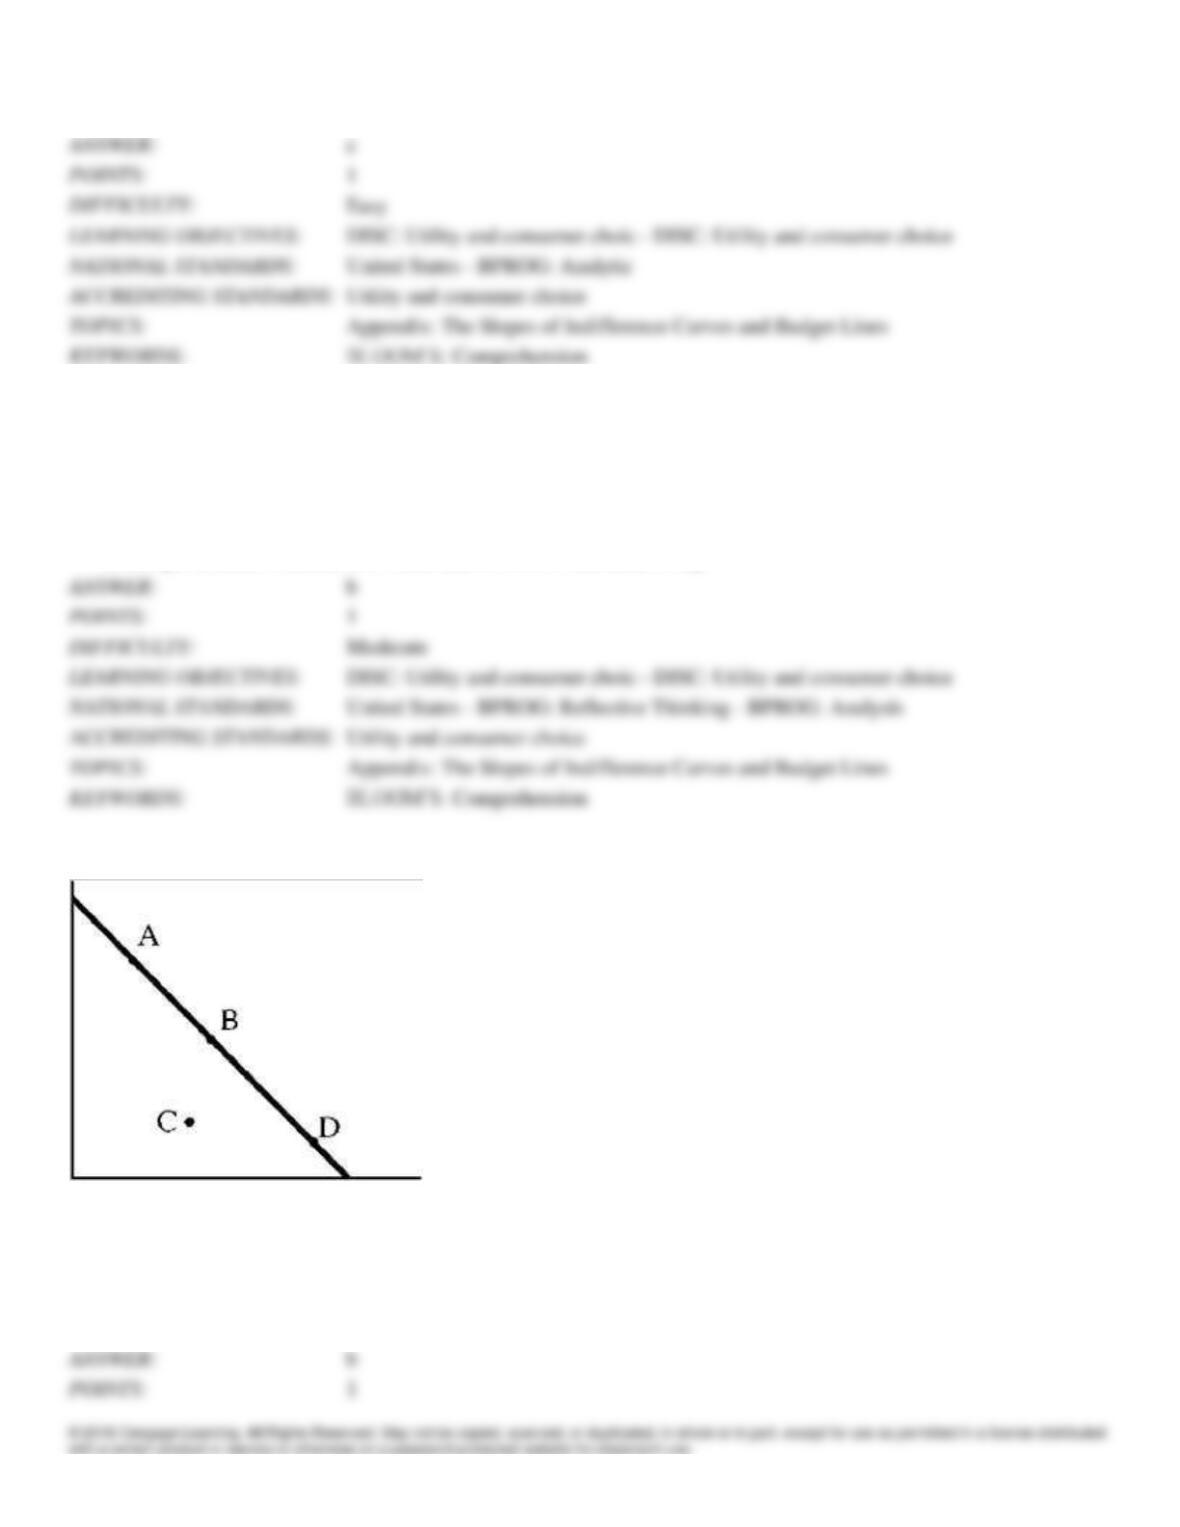
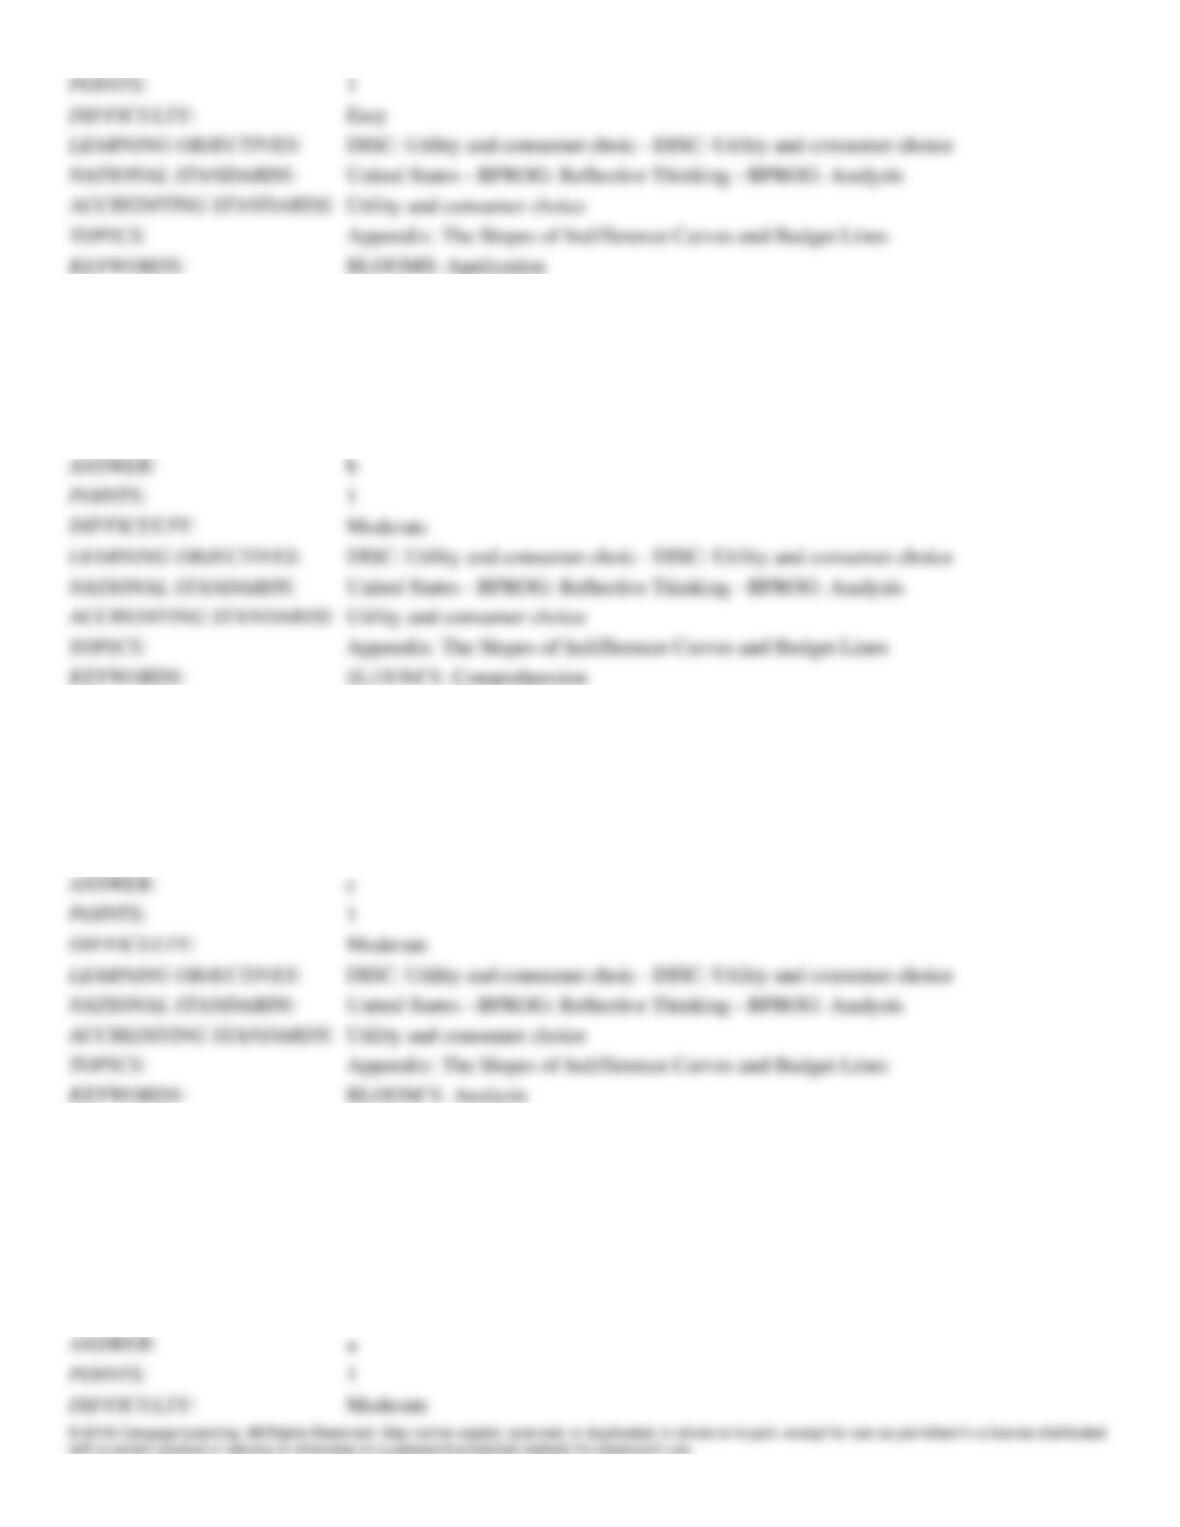
Figure 5-13
154. In Figure 5-13, the line AB is
a.
an indifference curve.
b.
a budget line.
c.
a marginal utility curve.
d.
a demand curve.
DISC: Utility and consumer choic – DISC: Utility and consumer choice
United States – BPROG: Reflective Thinking – BPROG: Analysis
Utility and consumer choice
Appendix: The Slopes of Indifference Curves and Budget Lines
BLOOMS: Application
155. In Figure 5-13, the consumer can afford any combination of X and Y represented by a point
a.
on line AB only.
b.
on or below line AB.
c.
on or above line AB.
d.
anywhere on the graph.
DISC: Utility and consumer choic – DISC: Utility and consumer choice
United States – BPROG: Reflective Thinking – BPROG: Analysis
Utility and consumer choice
Appendix: The Slopes of Indifference Curves and Budget Lines
156. In Figure 5-13, the consumer is better off
a.
at A than at E.
b.
at B than at D.
c.
at any point on U2 than at any point on U1.
d.
All of the above are correct.
DISC: Utility and consumer choic – DISC: Utility and consumer choice
United States – BPROG: Reflective Thinking – BPROG: Analysis
Utility and consumer choice
Appendix: The Slopes of Indifference Curves and Budget Lines
157. In Figure 5-13, the slope of the budget line (dropping all minus signs) equals
a.
price of good X/price of good Y.
b.
price of good Y/price of good X.
c.
the minimum number of units of good Y the consumer would have to receive to make him willing to give up
one unit of good X.
d.
the minimum number of units of good X the consumer would have to receive to make him willing to give up
one unit of good Y.
DISC: Utility and consumer choic – DISC: Utility and consumer choice
United States – BPROG: Analytic
Utility and consumer choice
Appendix: The Slopes of Indifference Curves and Budget Lines
BLOOMS: Application
158. According to Figure 5-13, if the price of good X falls, a consumer making her optimal decision will move from a
point on
a.
U1 to a point on U3.
b.
U2 to a point on U3.
c.
U1 to a point on U3.
d.
U2 to a point on U1.
DISC: Utility and consumer choic – DISC: Utility and consumer choice
United States – BPROG: Reflective Thinking – BPROG: Analysis
Utility and consumer choice
Appendix: The Slopes of Indifference Curves and Budget Lines
BLOOMS: Application
159. If the slope of an indifference curve between two goods decreases as we move from left to right (dropping all minus
signs), we infer that the consumer
a.
is less willing to trade away a good when he has a lot of it.
b.
is more willing to trade away a good when he has a lot of it.
c.
always tries to keep the percentage of his budget spent on each good constant.
d.
views one of the goods as inferior.
DISC: Utility and consumer choic – DISC: Utility and consumer choice
United States – BPROG: Reflective Thinking – BPROG: Analysis
Utility and consumer choice
Appendix: The Slopes of Indifference Curves and Budget Lines
160. When the price of a good changes but the price of the only other good bought by a consumer stays constant, his
a.
budget line shifts.
b.
indifference curves shift.
c.
budget line changes slope.
d.
indifference curves change slope.
DISC: Utility and consumer choic – DISC: Utility and consumer choice
United States – BPROG: Analytic
Utility and consumer choice
Appendix: The Slopes of Indifference Curves and Budget Lines
BLOOMS: Application
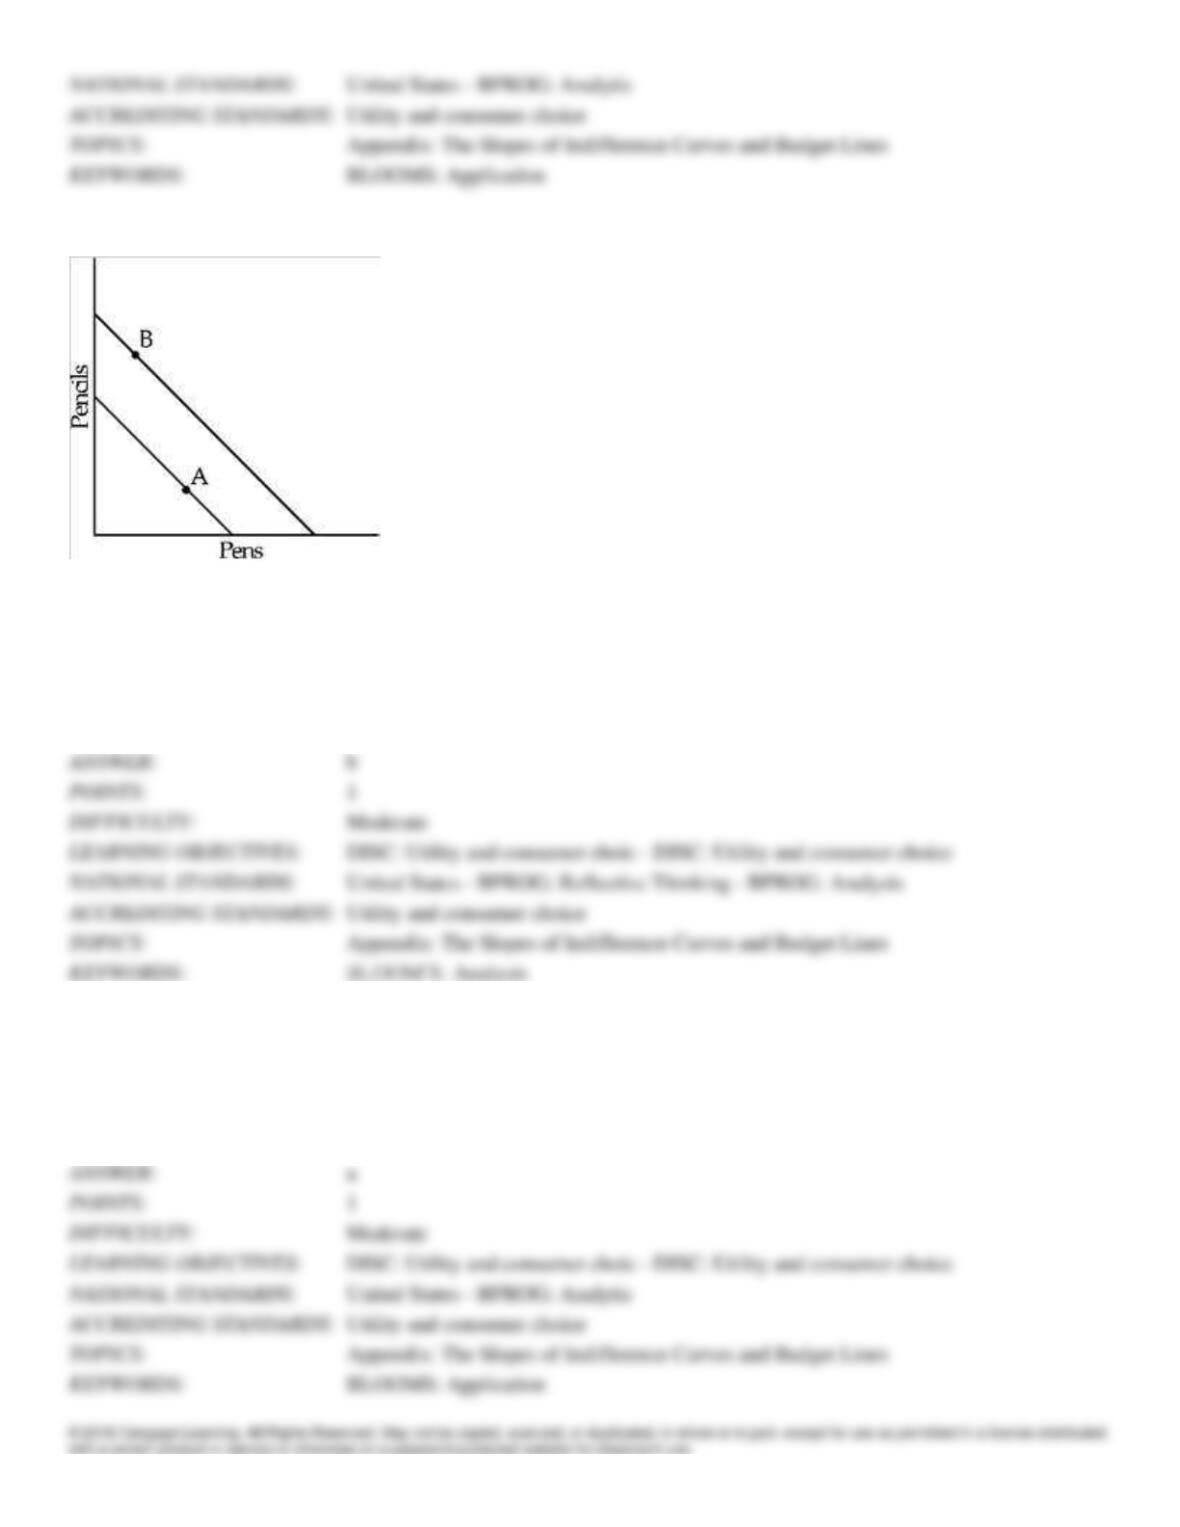
Figure 5-14
161. Martha initially buys the combination of pens and pencils shown as A in Figure 5-14. After the prices of both goods
change, she buys combination B. It must be true that
a.
Martha prefers A to B.
b.
Martha prefers B to A.
c.
Martha is indifferent between A and B.
d.
Martha’s preferences between A and B cannot be determined from the information given.
DISC: Utility and consumer choic – DISC: Utility and consumer choice
United States – BPROG: Reflective Thinking – BPROG: Analysis
Utility and consumer choice
Appendix: The Slopes of Indifference Curves and Budget Lines
162. The slope of a consumer’s indifference curve between two commodities represents
a.
her marginal rate of substitution between the commodities.
b.
the relative prices of the goods.
c.
her marginal revenue from selling the commodities.
d.
her marginal revenue product from consuming the commodities.
DISC: Utility and consumer choic – DISC: Utility and consumer choice
United States – BPROG: Analytic
Appendix: The Slopes of Indifference Curves and Budget Lines
BLOOMS: Application
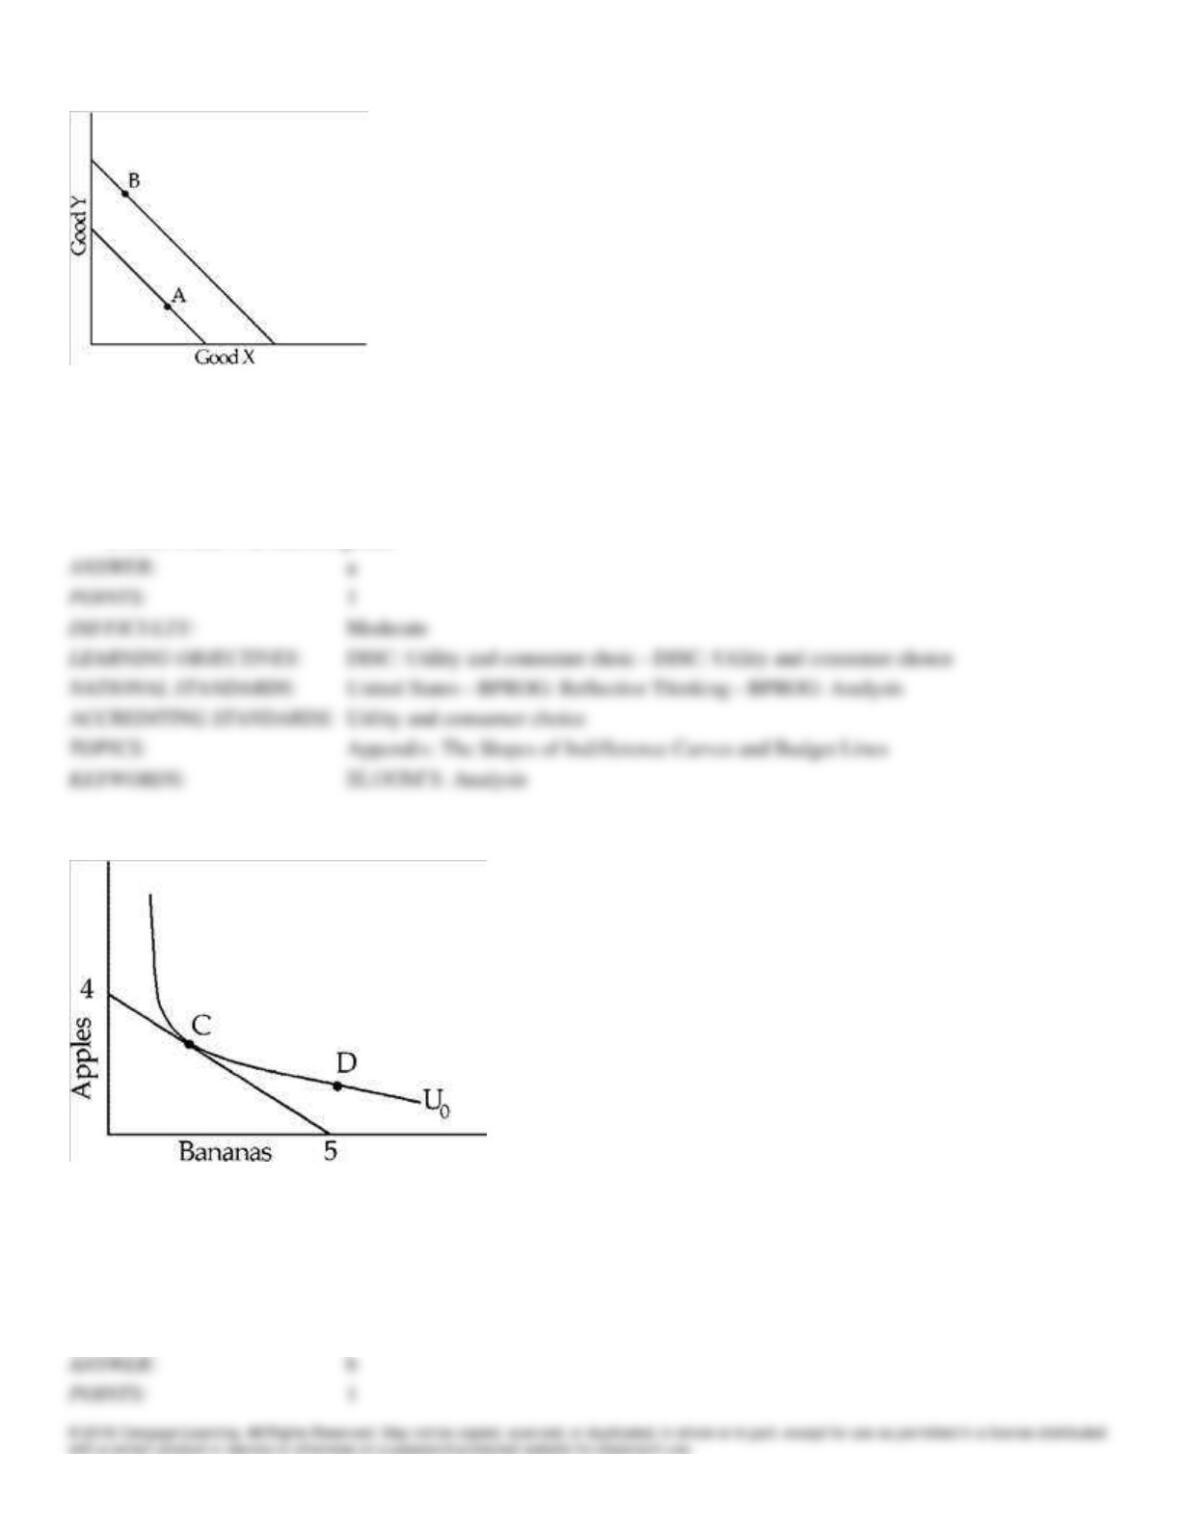
Figure 5-15
163. Hal initially consumes the combination marked as A in Figure 5-15. After his income increases, Hal consumes
combination B. We can conclude that Hal views
a.
X as an inferior good and Y as a noninferior good.
b.
X as a noninferior good and Y as an inferior good.
c.
both X and Y as noninferior goods.
d.
both X and Y as inferior goods.
DISC: Utility and consumer choic – DISC: Utility and consumer choice
United States – BPROG: Reflective Thinking – BPROG: Analysis
Utility and consumer choice
Appendix: The Slopes of Indifference Curves and Budget Lines
Figure 5-16
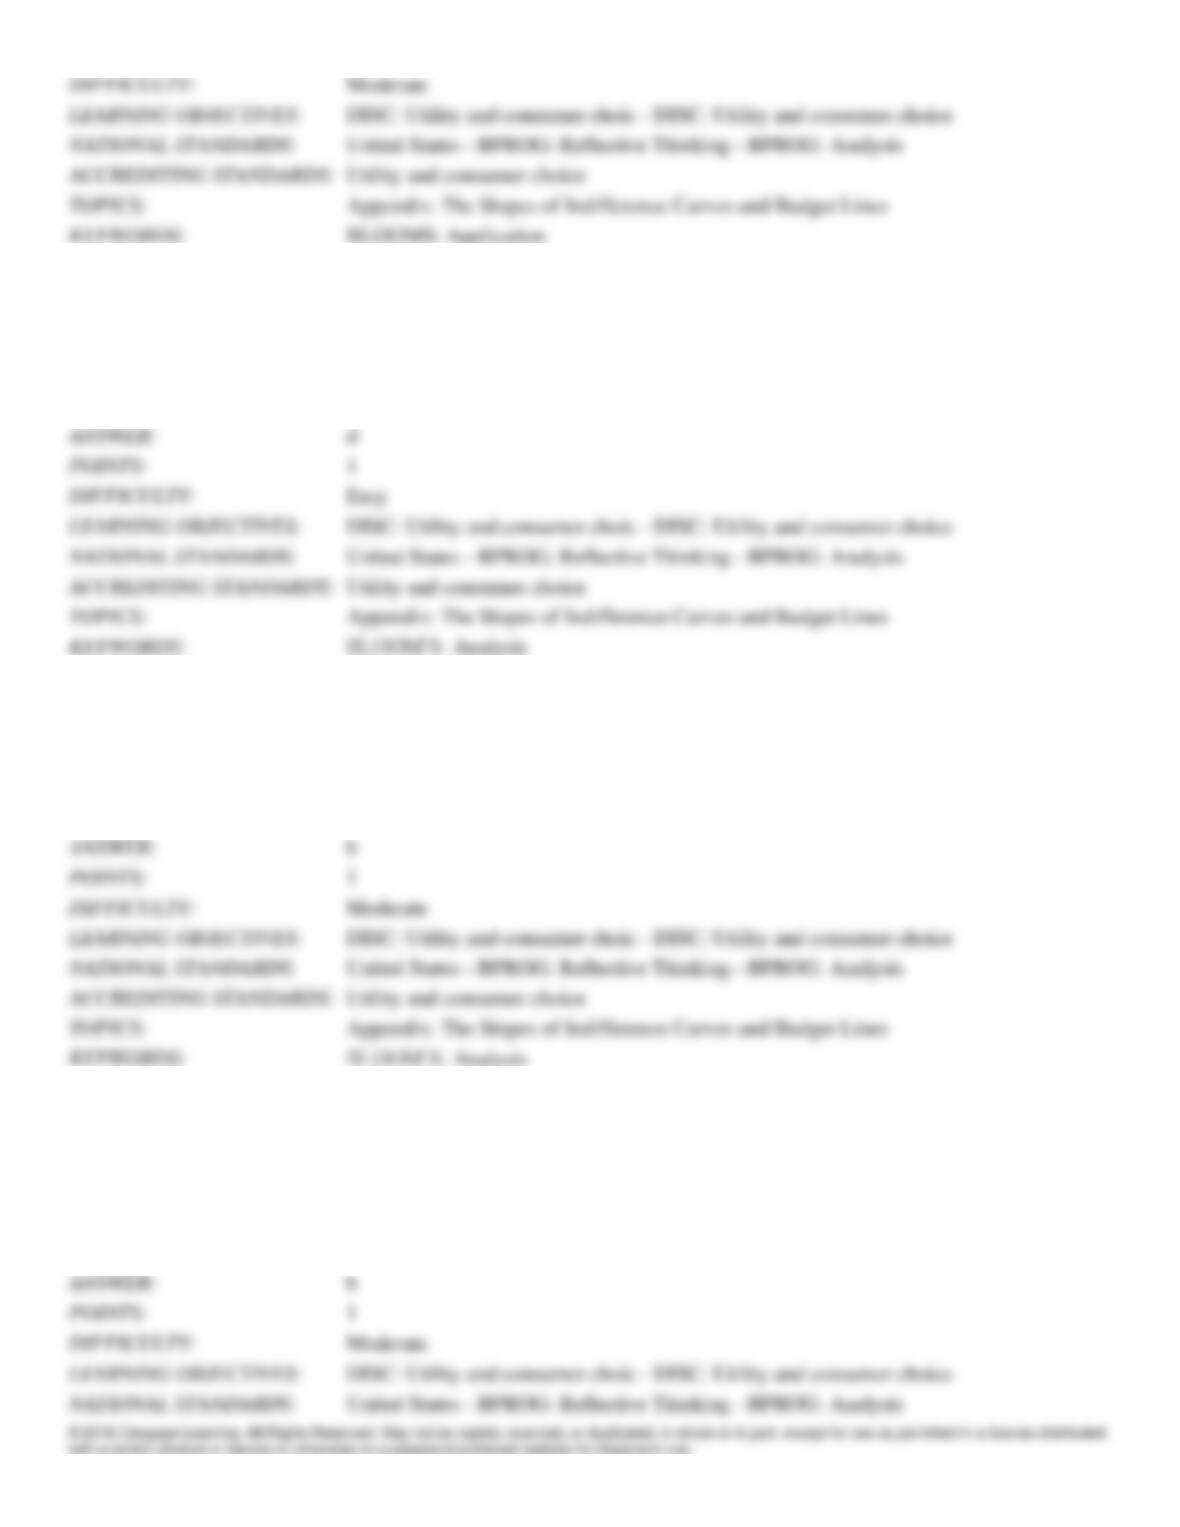
164. Figure 5-16 shows Adam’s purchases of bananas and apples when apples cost $5 each and bananas $4 each. The
information implies that Adam’s income
a.
must be $9.
b.
must be $20.
c.
must be $40.
d.
Adam’s income cannot be determined without further information.
DISC: Utility and consumer choic – DISC: Utility and consumer choice
United States – BPROG: Reflective Thinking – BPROG: Analysis
Utility and consumer choice
Appendix: The Slopes of Indifference Curves and Budget Lines
BLOOMS: Application
165. In Figure 5-16, Adam is
a.
better off at C than at D and able to afford either C or D.
b.
better off at D than at C but only able to afford C.
c.
equally well off at C and D and able to afford either C or D.
d.
equally well off at C and D but only able to afford C.
DISC: Utility and consumer choic – DISC: Utility and consumer choice
United States – BPROG: Reflective Thinking – BPROG: Analysis
Utility and consumer choice
Appendix: The Slopes of Indifference Curves and Budget Lines
166. In Figure 5-16, a decrease in the price of apples will
a.
shift Adam’s budget constraint out.
b.
make Adam’s budget constraint steeper.
c.
shift Adam’s indifference curves out.
d.
make Adam’s budget constraint flatter.
DISC: Utility and consumer choic – DISC: Utility and consumer choice
United States – BPROG: Reflective Thinking – BPROG: Analysis
Utility and consumer choice
Appendix: The Slopes of Indifference Curves and Budget Lines
167. Vicki consumes meatloaf and pizza. To keep her utility constant, you must give her more of one good if you take
some of the other away. This information implies that
a.
Vicki’s marginal rate of substitution must be constant along her indifference curve.
b.
Vicki’s indifference curve must have a negative slope.
c.
the prices Vicki must pay for meatloaf and pizza are always the same.
d.
Vicki’s marginal utility from each good must be constant along her indifference curve.
DISC: Utility and consumer choic – DISC: Utility and consumer choice
United States – BPROG: Reflective Thinking – BPROG: Analysis
Utility and consumer choice
Appendix: The Slopes of Indifference Curves and Budget Lines
BLOOMS: Application
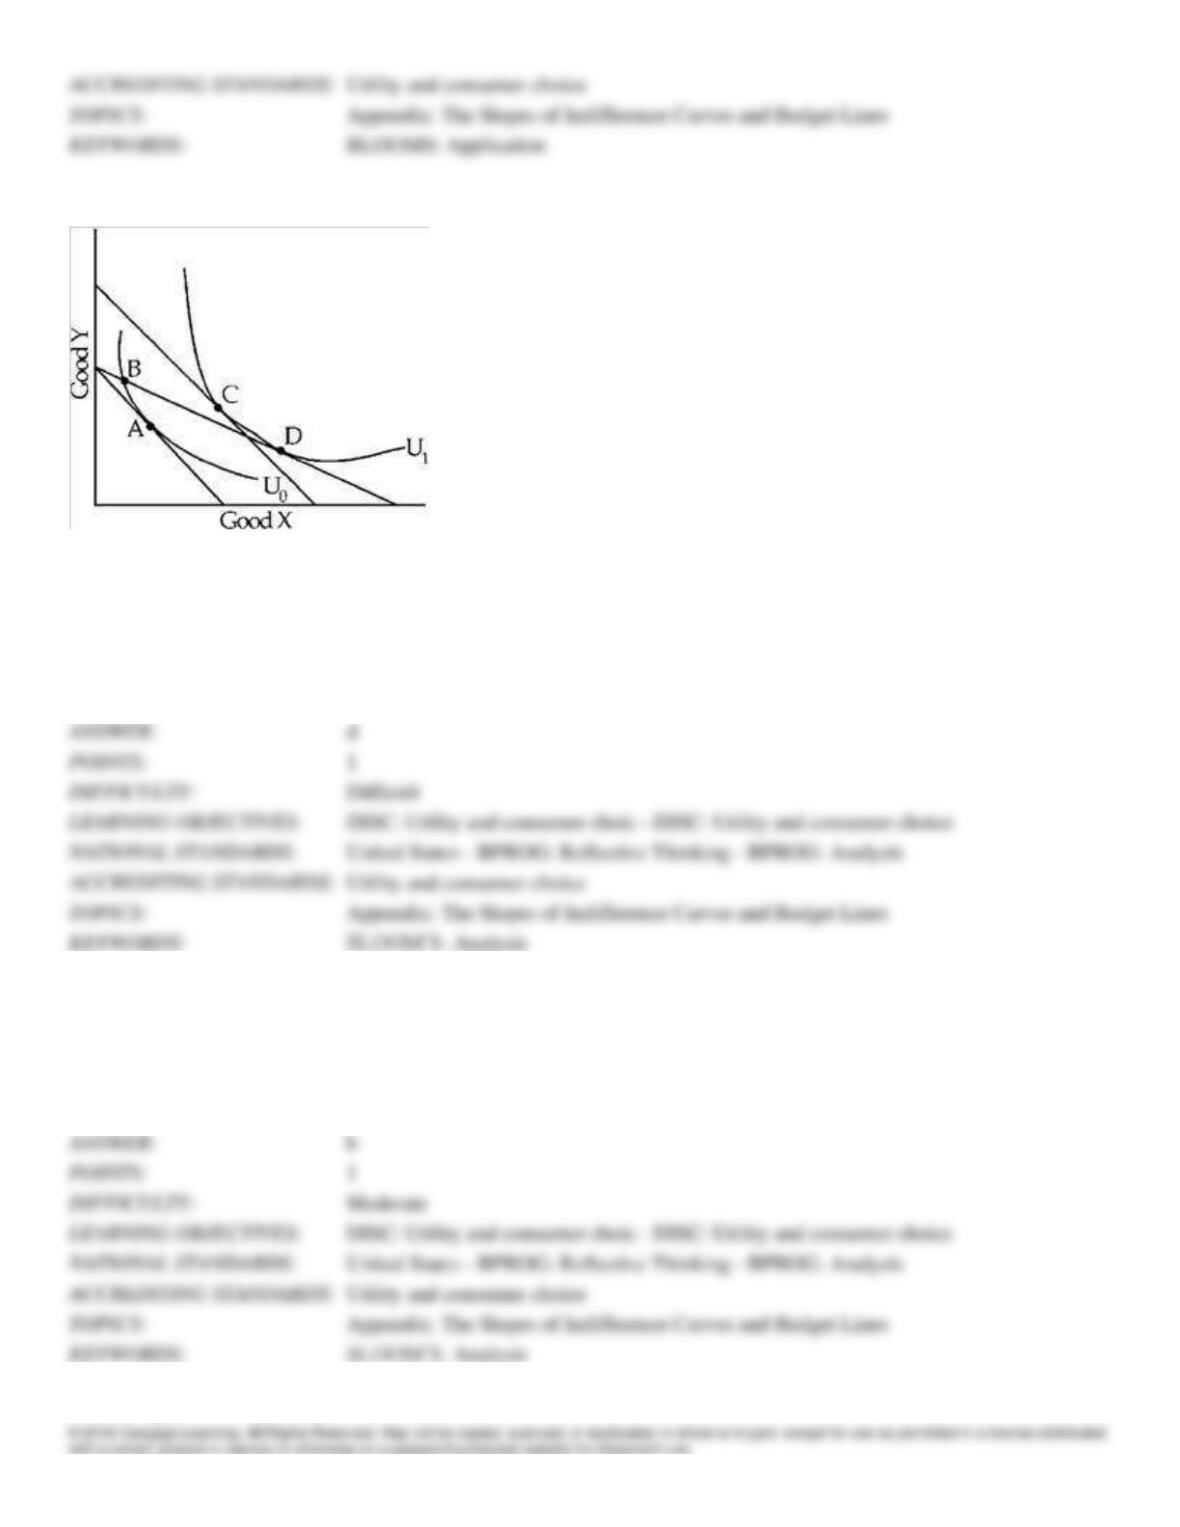
Figure 5-17
168. In Figure 5-17, which of the marked points would an economist use to help him construct a single demand curve for
X?
a.
A and B
b.
C and D
c.
A and C
d.
A and D
DISC: Utility and consumer choic – DISC: Utility and consumer choice
United States – BPROG: Reflective Thinking – BPROG: Analysis
Utility and consumer choice
Appendix: The Slopes of Indifference Curves and Budget Lines
169. Which of the following statements about Figure 5-17 must be correct?
a.
The consumer pays a higher dollar price per unit for good Y at A than at D.
b.
The consumer pays the same dollar price per unit for good Y at A and at B.
c.
The consumer pays a higher dollar price per unit for good X at D than at A.
d.
The consumer pays a higher dollar price per unit for good X at A than at C.
DISC: Utility and consumer choic – DISC: Utility and consumer choice
United States – BPROG: Reflective Thinking – BPROG: Analysis
Utility and consumer choice
170. In Figure 5-17, the consumer would prefer