D. zero.
88. Refer to the following graph.
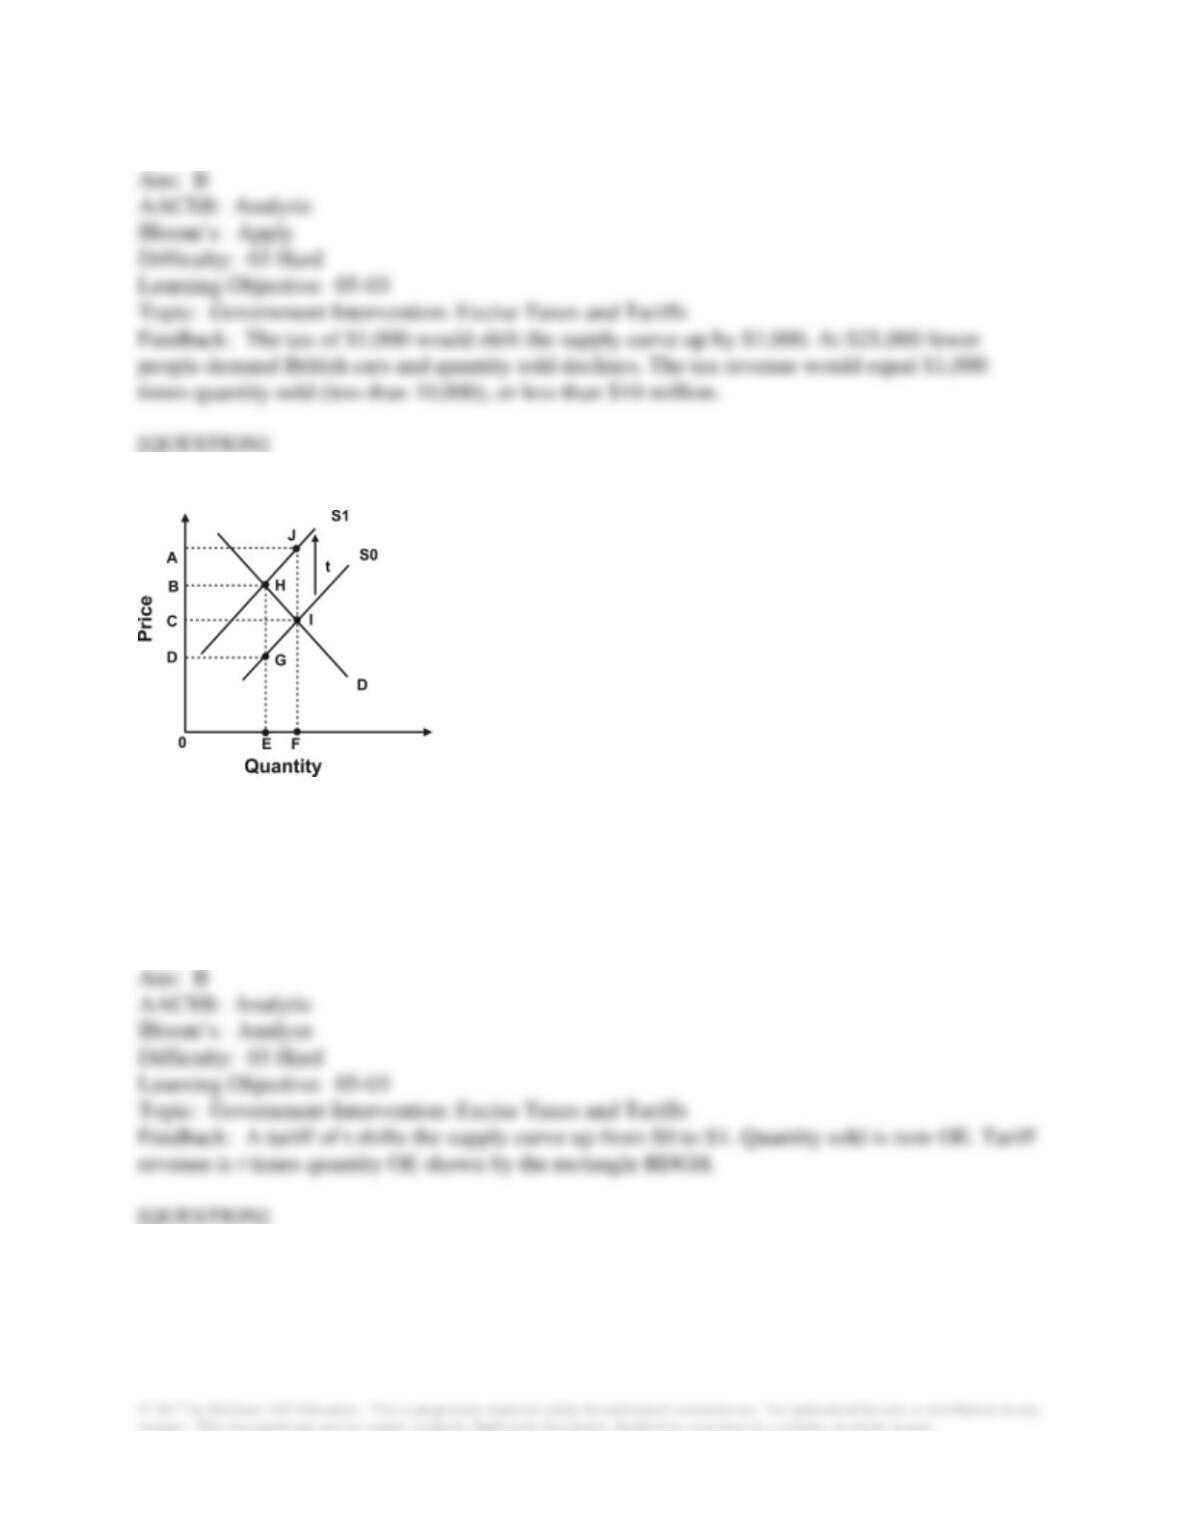
If this graph represents the supply of and demand for an imported product, a tariff of t will result
in revenue for the government shown by area:
A. ACIJ.
B. BDGH.
C. BOEH.
D. DOEG.
89. If government were to issue a fixed number of licenses to produce a good or provide a
service, this would likely:
A. lower the price of the good or service to consumers.
B. lower the wage received by those who have licenses.
C. increase the wage received by those who have licenses.
D. increase the demand for goods.
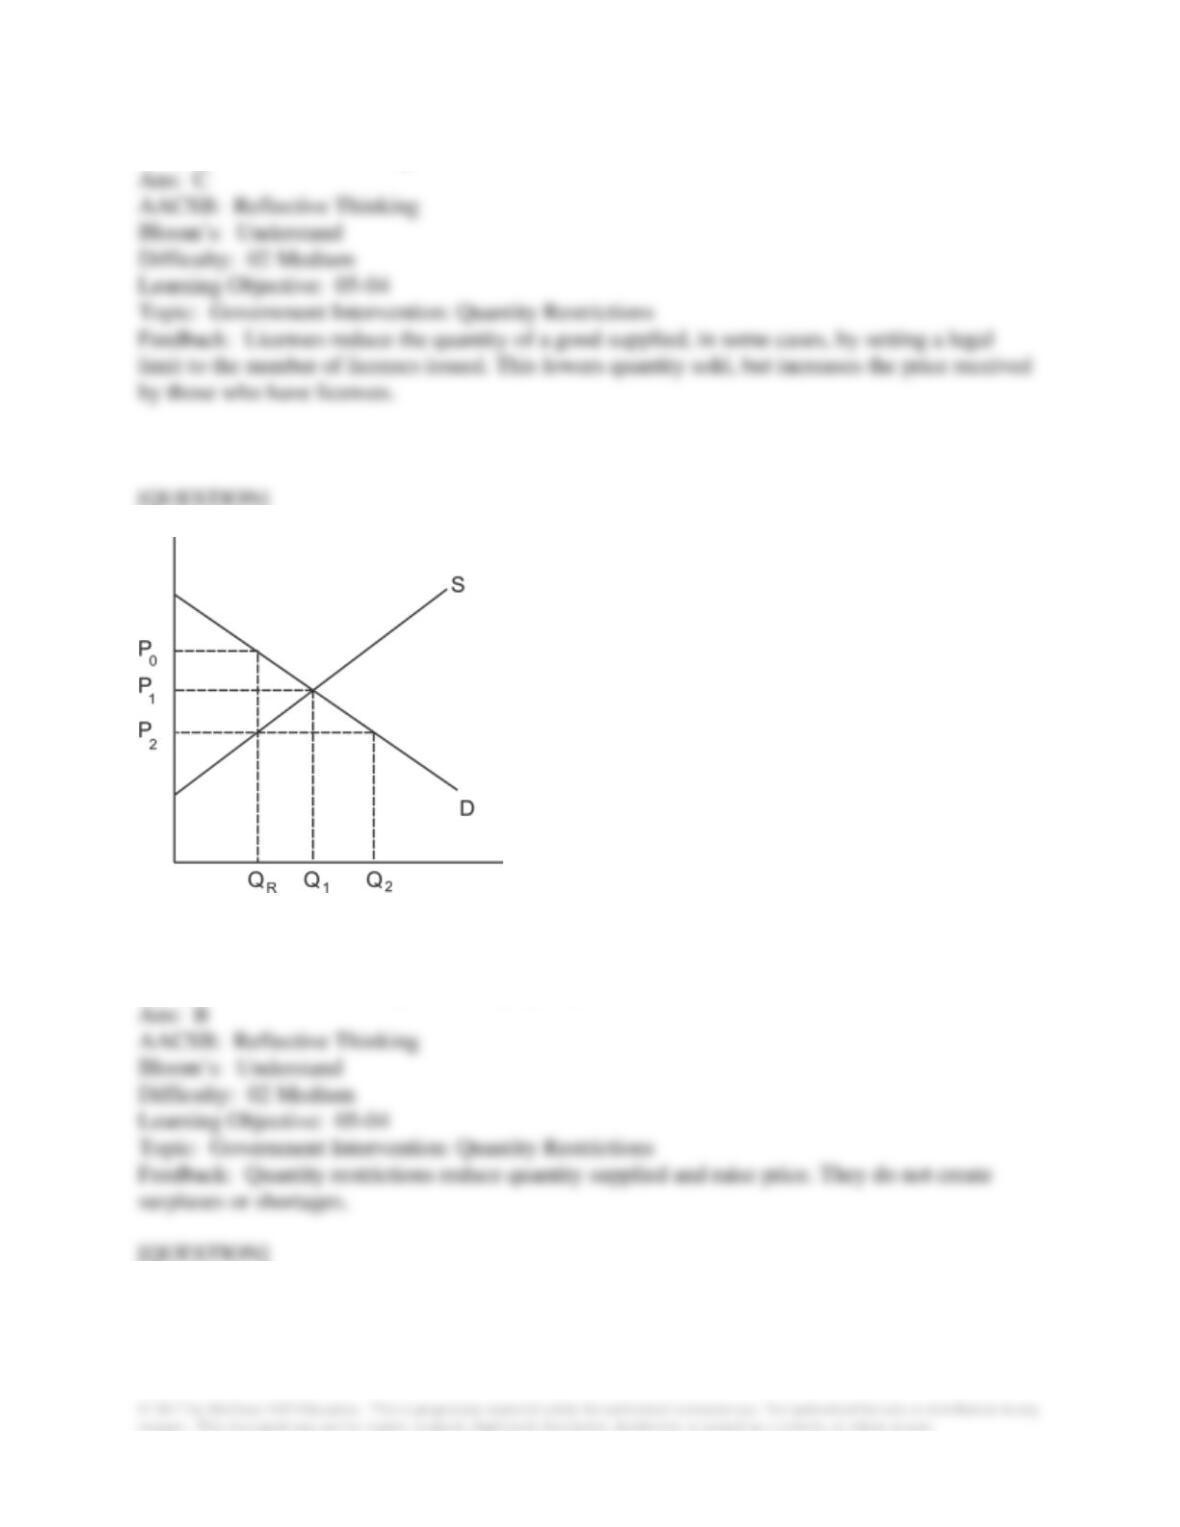
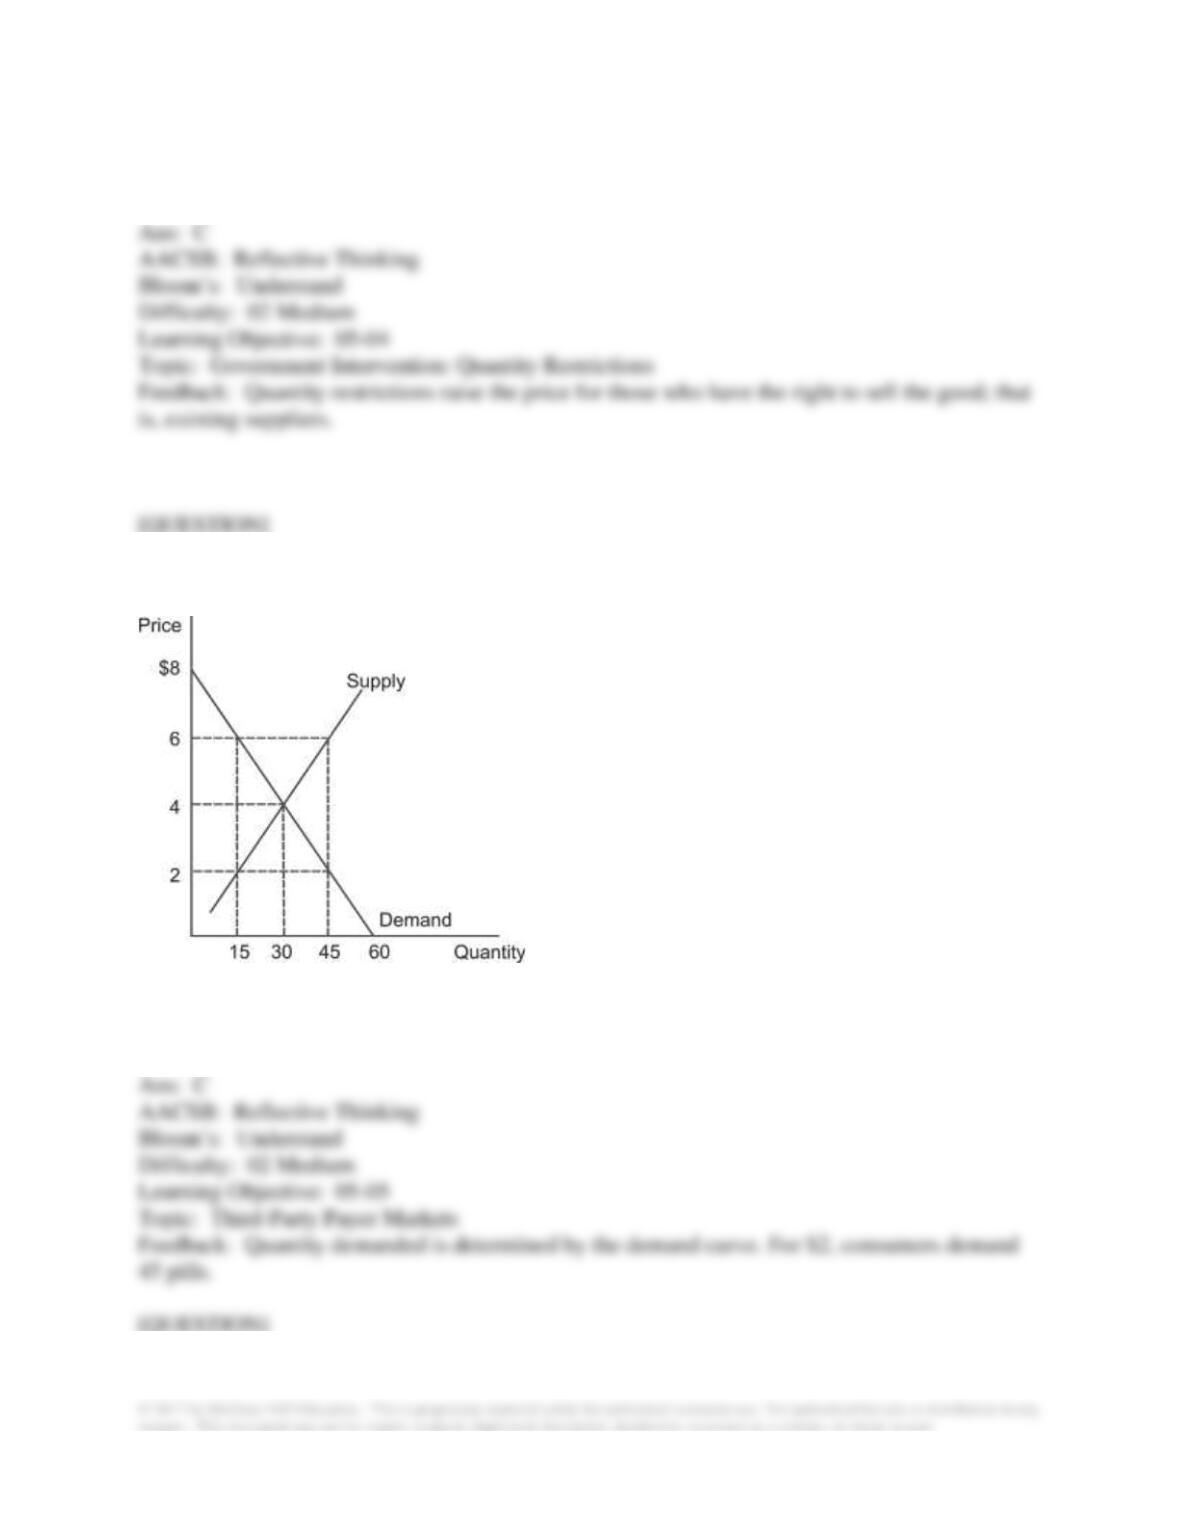
90. Refer to the graph shown. A quantity restriction of QR will:
A. reduce quantity supplied to Q2.
B. reduce quantity supplied to QR.
C. have no effect on quantity supplied.
D. create excess demand represented by Q2 – QR.
91. Refer to the graph shown. A quantity restriction of QR will:
A. raise market price to P0.
B. maintain a market price of P1.
C. lower market price to P2.
D. have no effect in the market depicted.
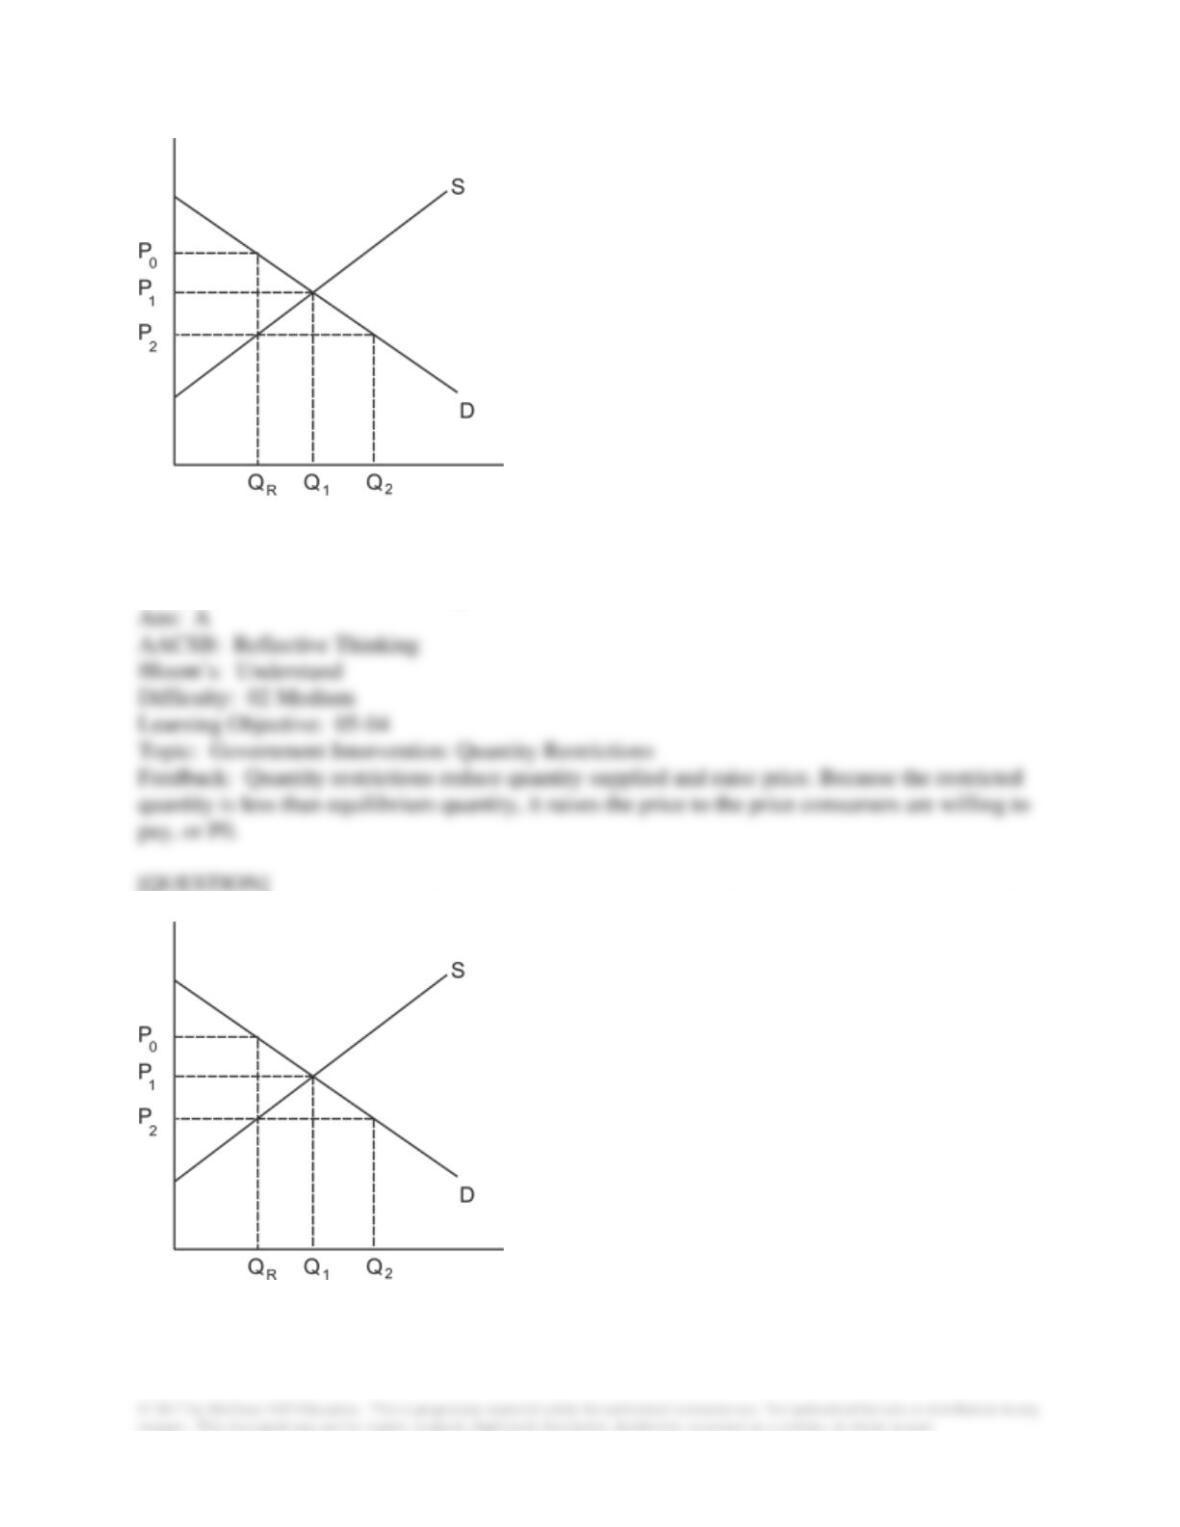
92. Refer to the graph shown. Given the quantity restriction of QR, a reduction in demand will:
A. raise equilibrium price.
B. raise equilibrium quantity.
C. have no impact on market price.
D. lower the market price.
93. Quantity restrictions become more valuable to those holding the rights to sell the good
when:
A. supply increases.
B. supply decreases.
C. demand increases.
D. demand decreases.
94. Taxi medallions were issued in New York City to:
A. help commuters afford transportation.
B. increase the wages of taxi drivers.
C. help new immigrants find jobs.
D. raise revenue for the city.
95. Quantity restrictions benefit which group the most?
A. Consumers
B. Suppliers wanting to enter the market
C. Existing suppliers
D. Government
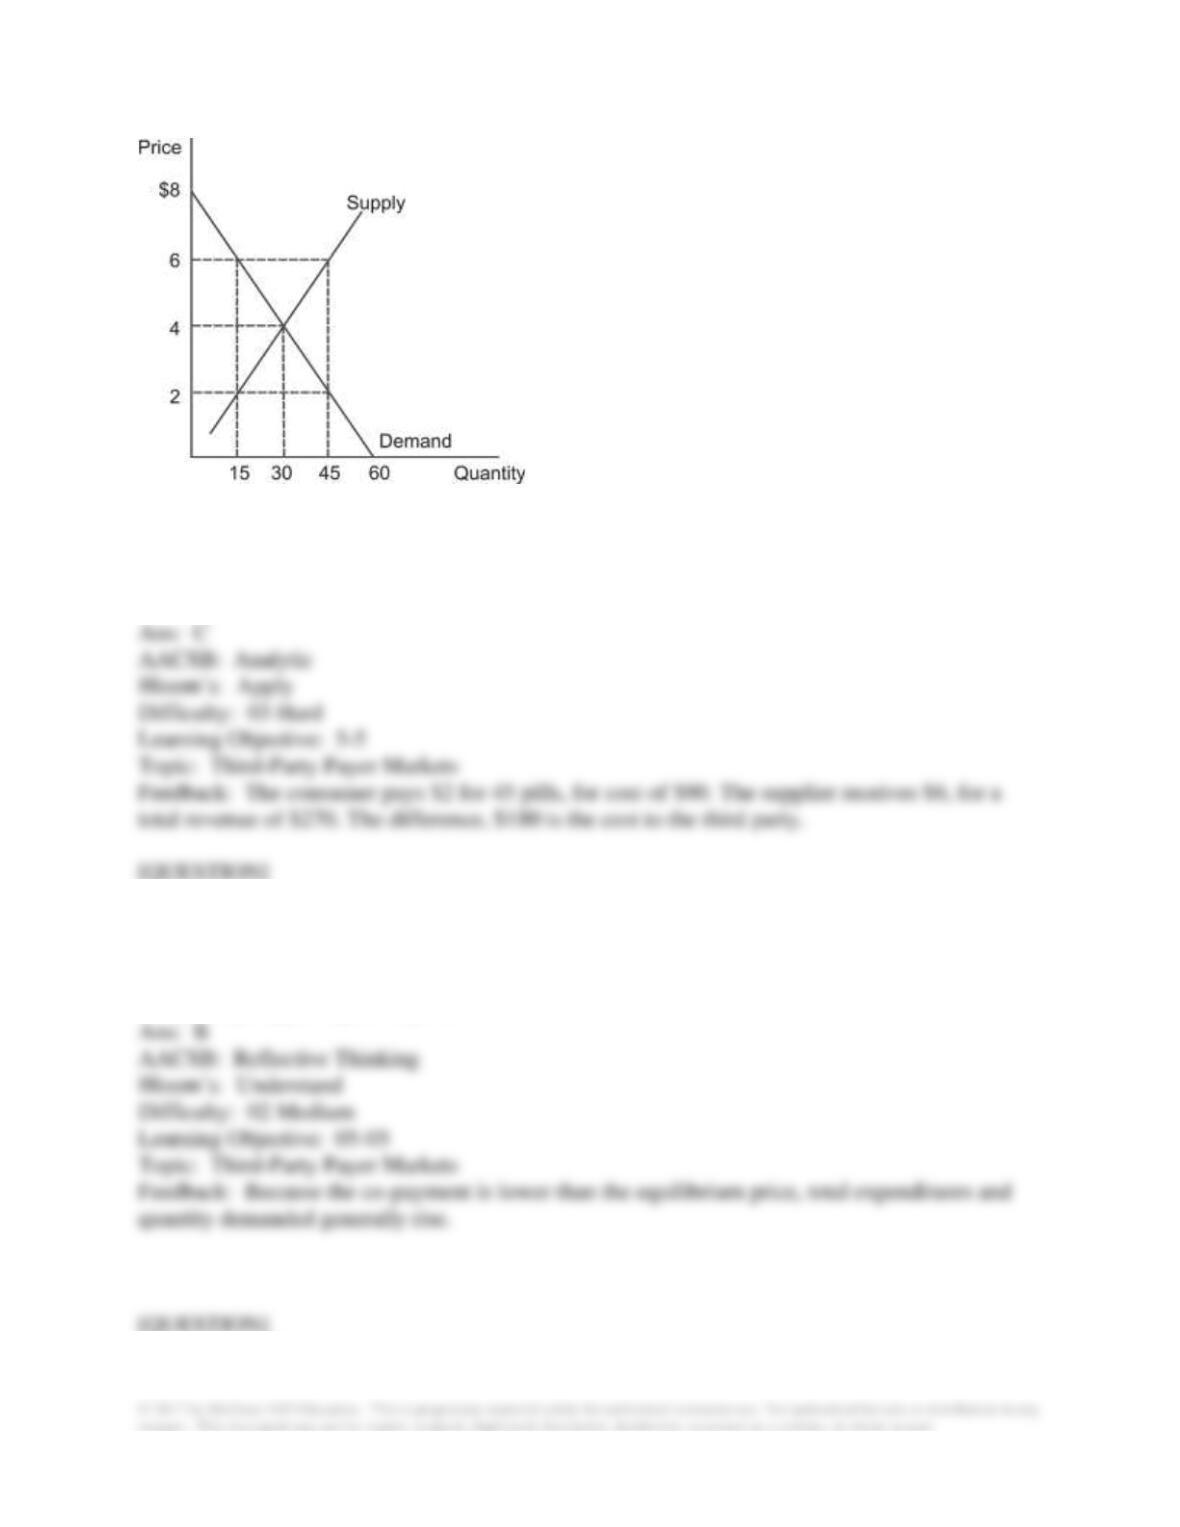
96. Refer to the graph shown that depicts a third-party payer market for prescription drugs. If the
co-payment is $2 per pill, what will be the quantity demanded?
A. 15
B. 30
C. 45
D. 60
97. Refer to the graph shown that depicts a third-party payer market for prescription drugs. If the
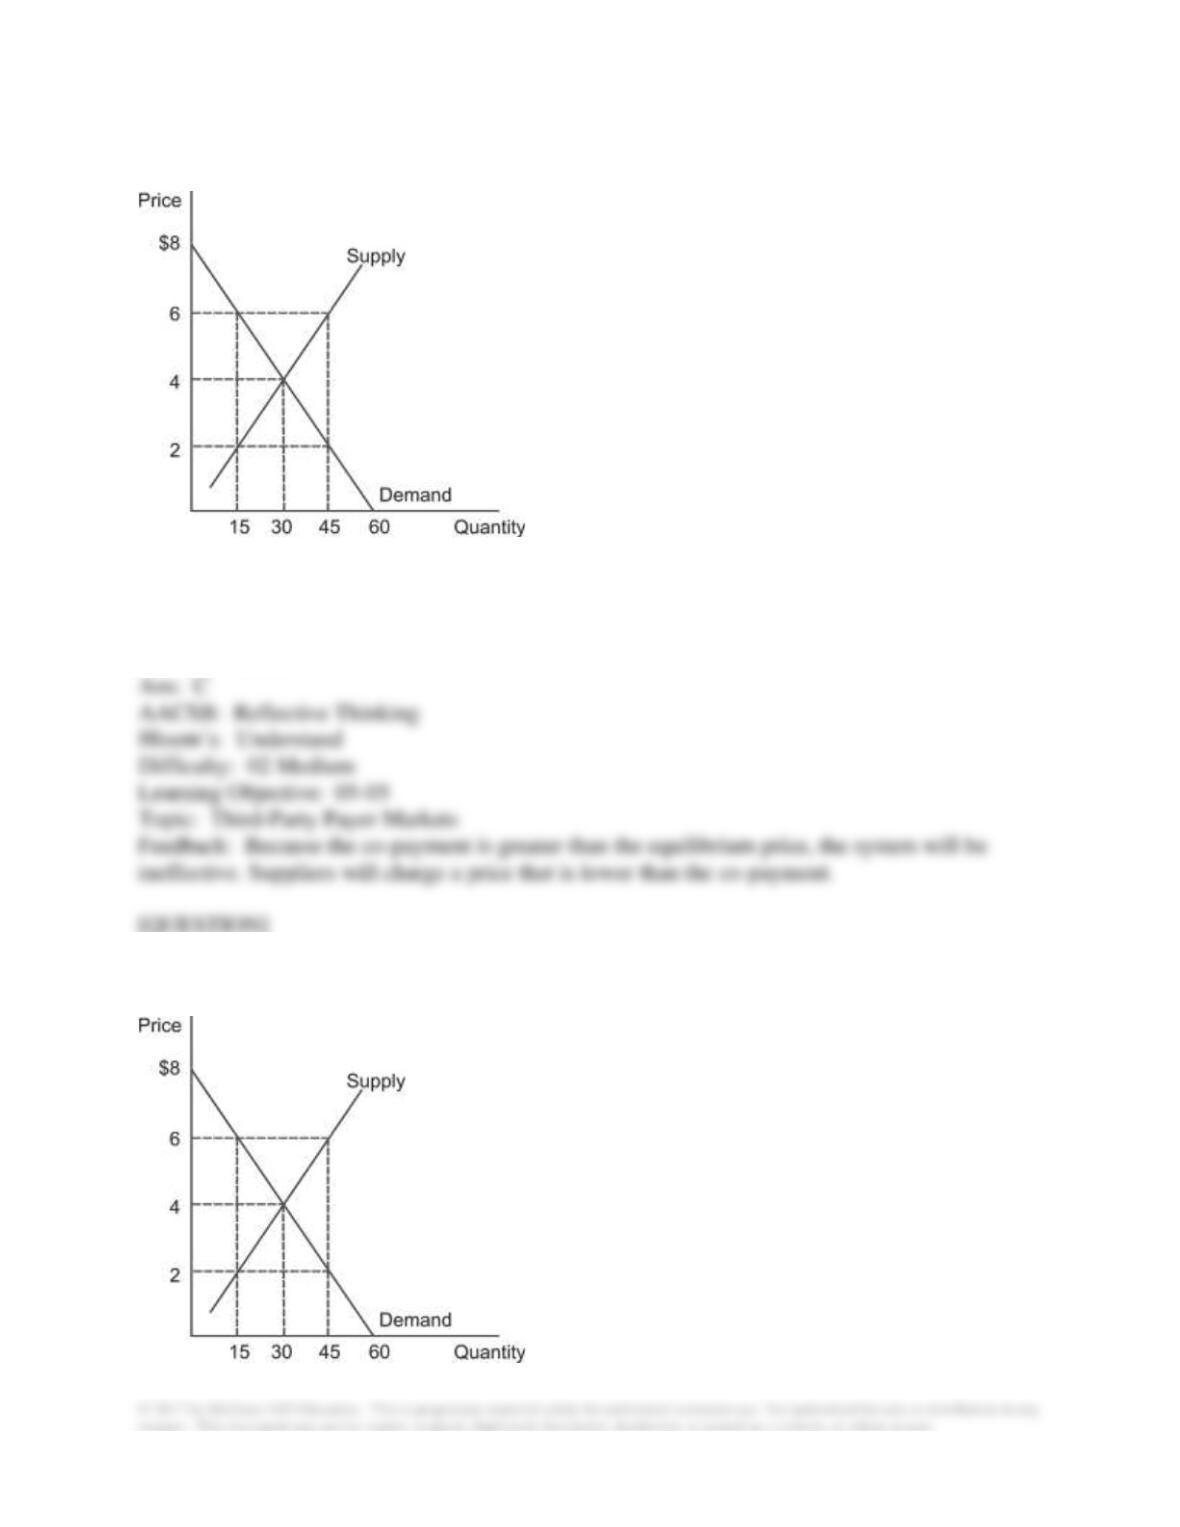
co-payment is $6 per pill, total expenditures under the third-party payer system will be:
A. greater than if the market were left alone.
B. less than if the market were left alone.
C. the same as if the market were left alone.
D. undetermined.
98. Refer to the graph shown that depicts a third-party payer market for prescription drugs. If the
co-payment is $2 per pill, what will be the total market expenditures on prescription drugs?
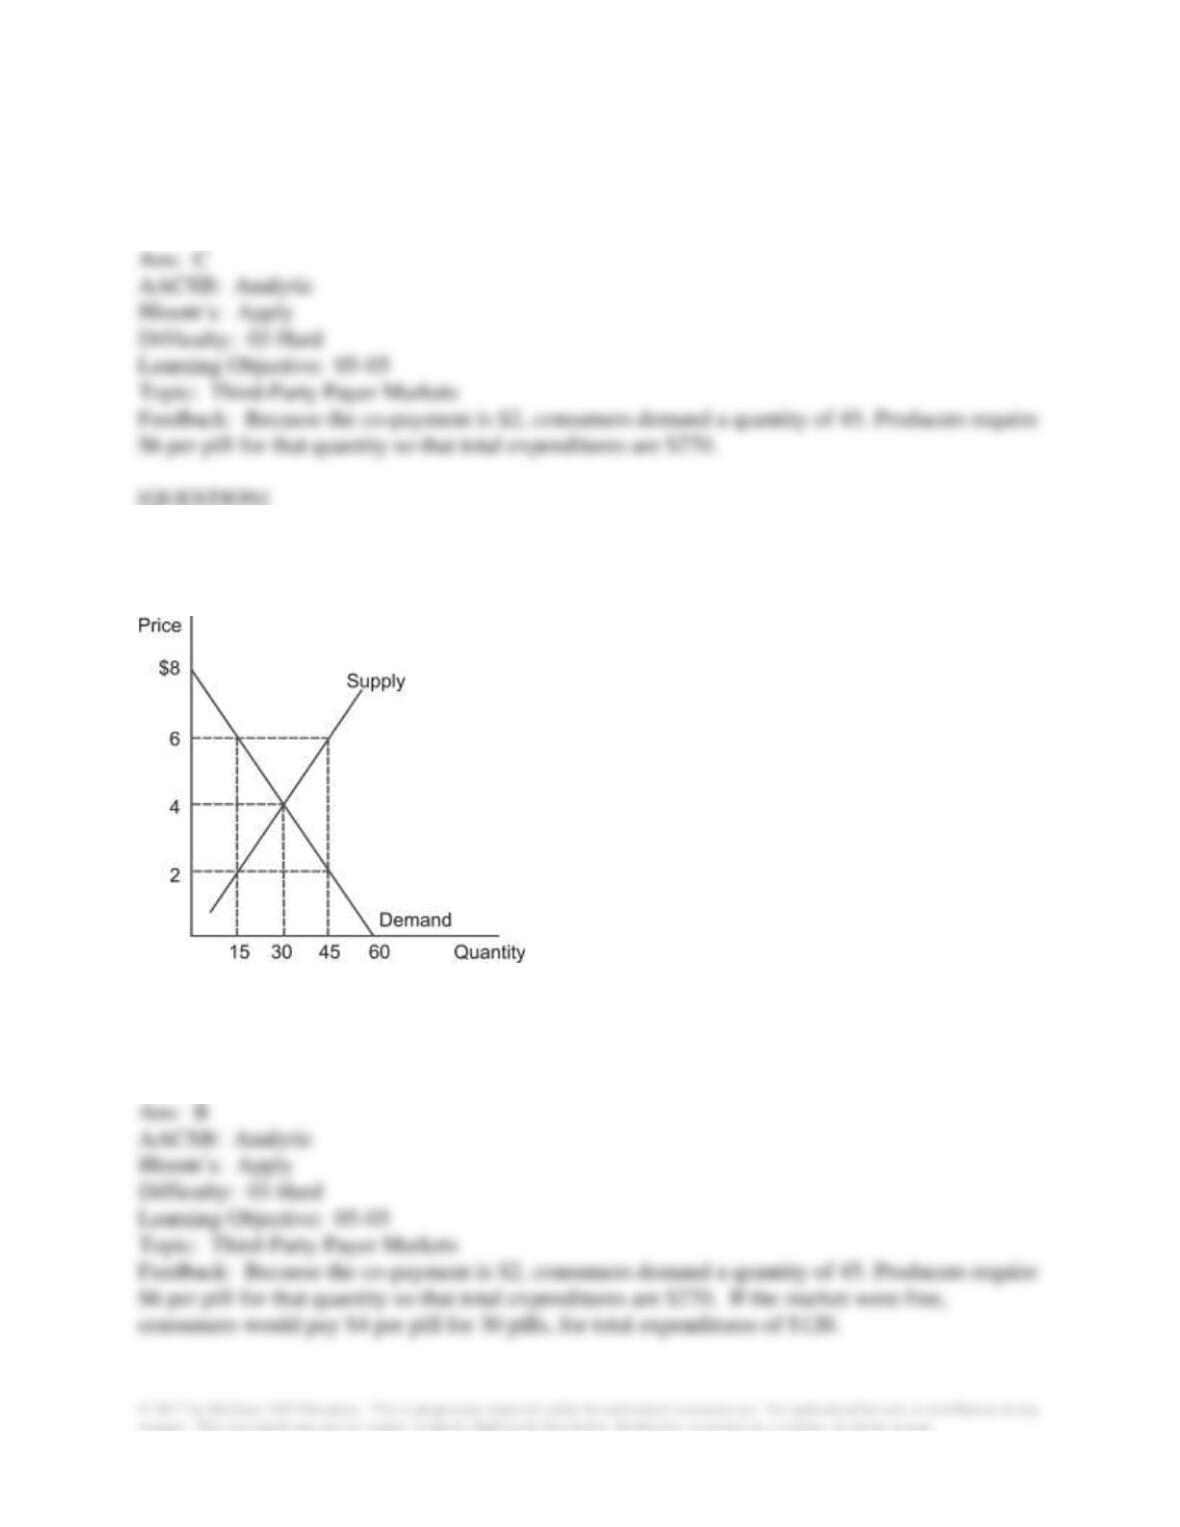
A. $30
B. $90
C. $270
D. $540
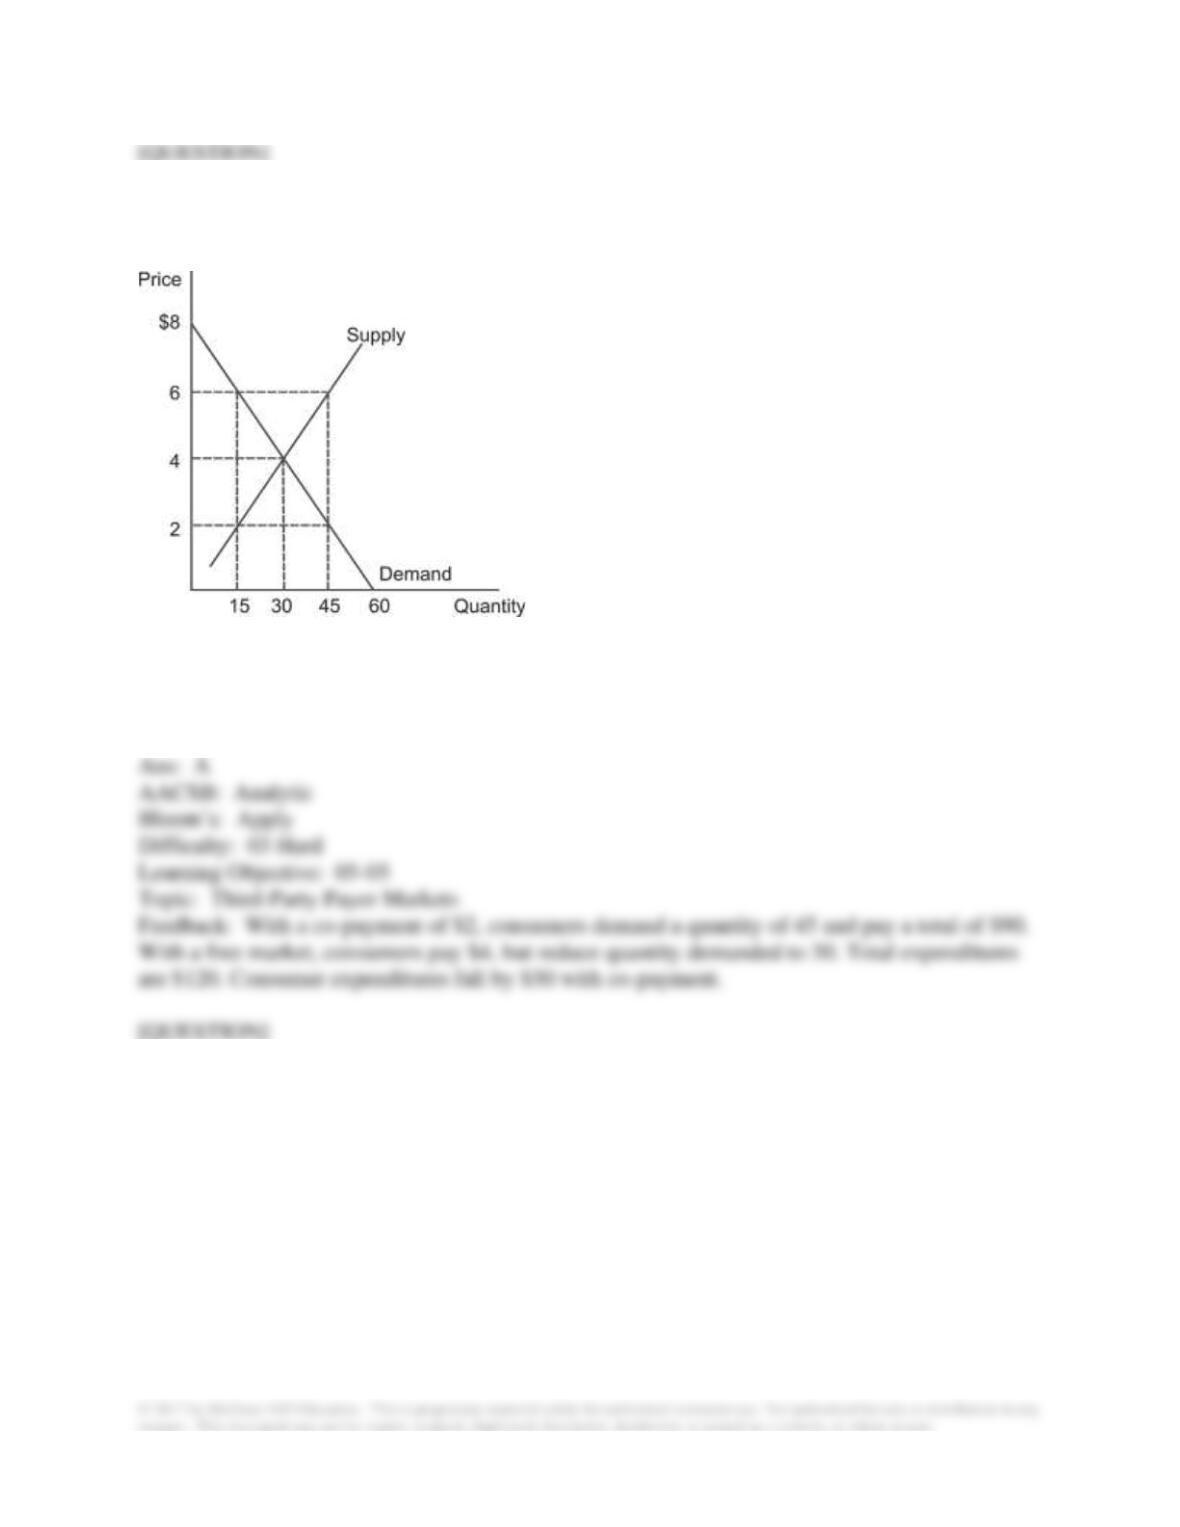
99. Refer to the graph shown that depicts a third-party payer market for prescription drugs. What
happens to total expenditures in this market if a $2 co-pay is established compared to a free-
market equilibrium?
A. Expenditures rise to $240
B. Expenditures rise to $270
C. Expenditures fall by $120
D. Expenditures remain at $120
100. Refer to the graph shown that depicts a third-party payer market for prescription drugs.
What happens to expenditures by consumers in this market if a $2 co-pay is established
compared to a free-market equilibrium?
A. Expenditures fall by $30
B. Expenditures rise by $90
C. Expenditures fall by $120
D. Expenditures remain at $150
101. Refer to the graph shown that depicts a third-party payer market for prescription drugs.
What is the cost of this program to the third-party if a $2 co-pay is established?
A. $270
B. $240
C. $180
D. $120
102. In a third-party payer system:
A. total expenditures generally fall.
B. total expenditures generally rise.
C. quantity demanded generally falls.
D. quantity supplied generally falls.
103. Refer to the table shown that depicts a third-party payer market. What is the cost of this
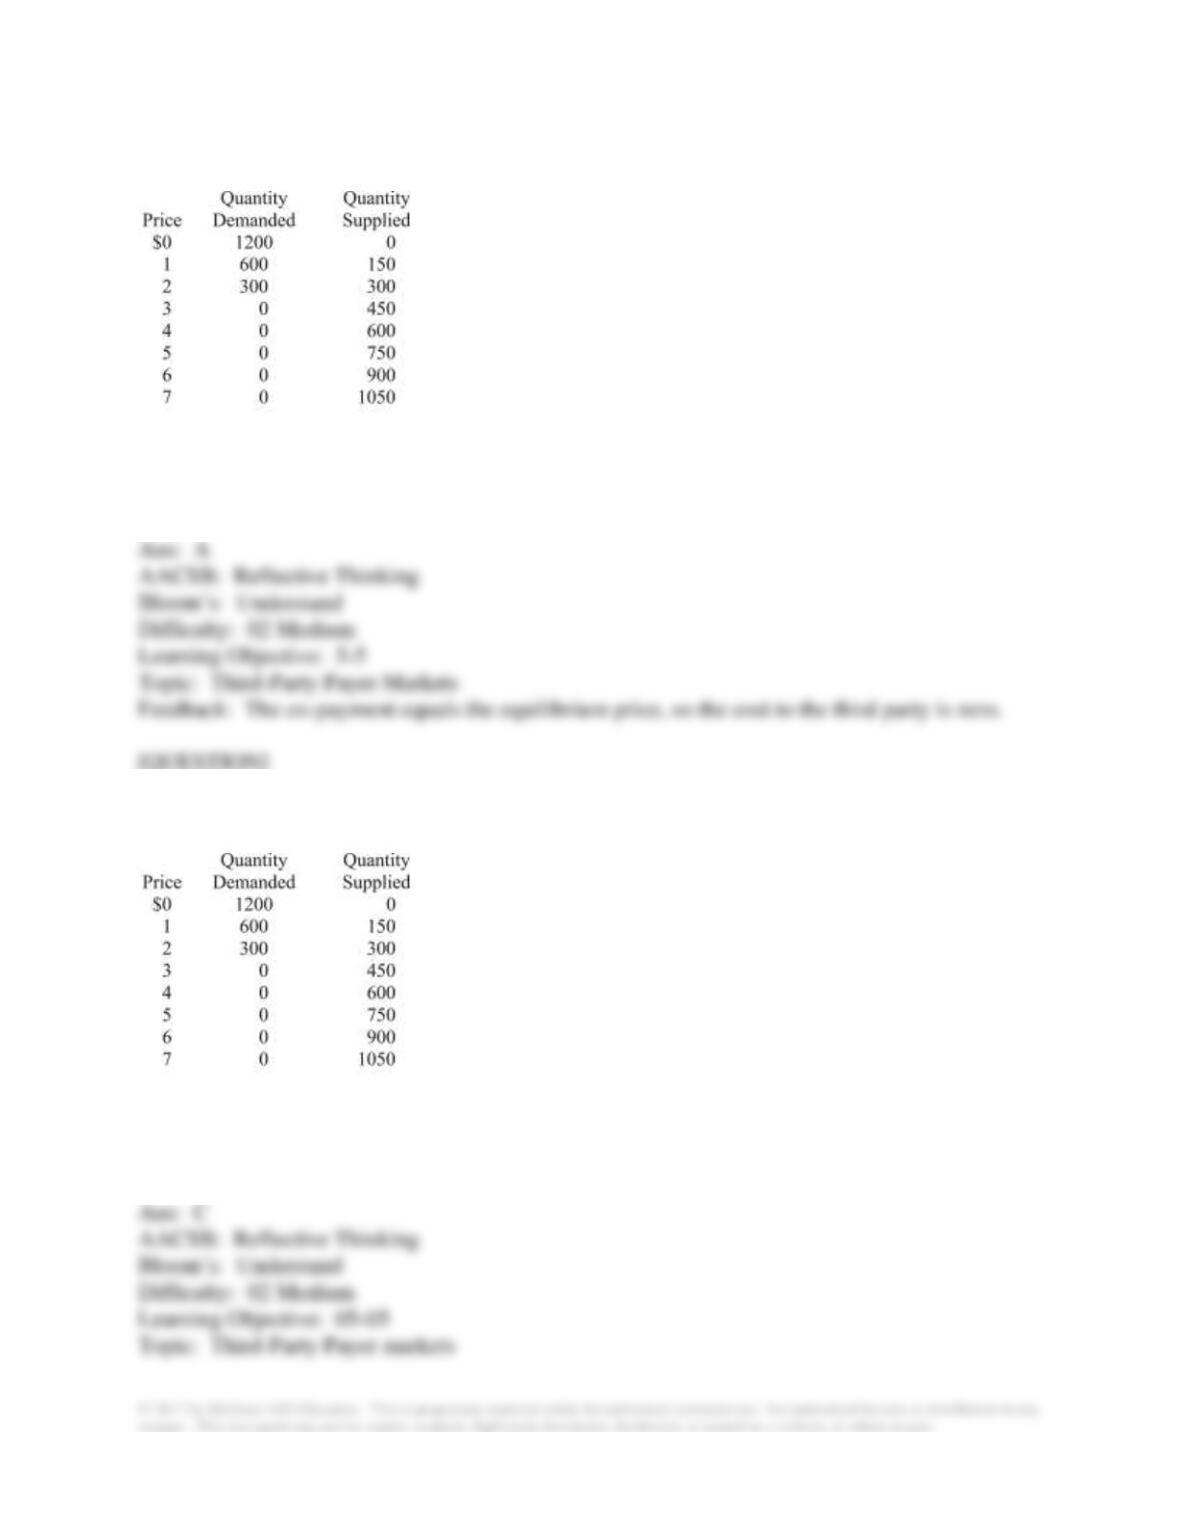
program to the third-party if a $2 co-pay is established?
A. $0
B. $150
C. $600
D. $1,200
104. Refer to the table shown that depicts a third-party payer market. What is the quantity
demanded if a $1 co-pay is established?
A. 0
B. 300
C. 600
D. 900
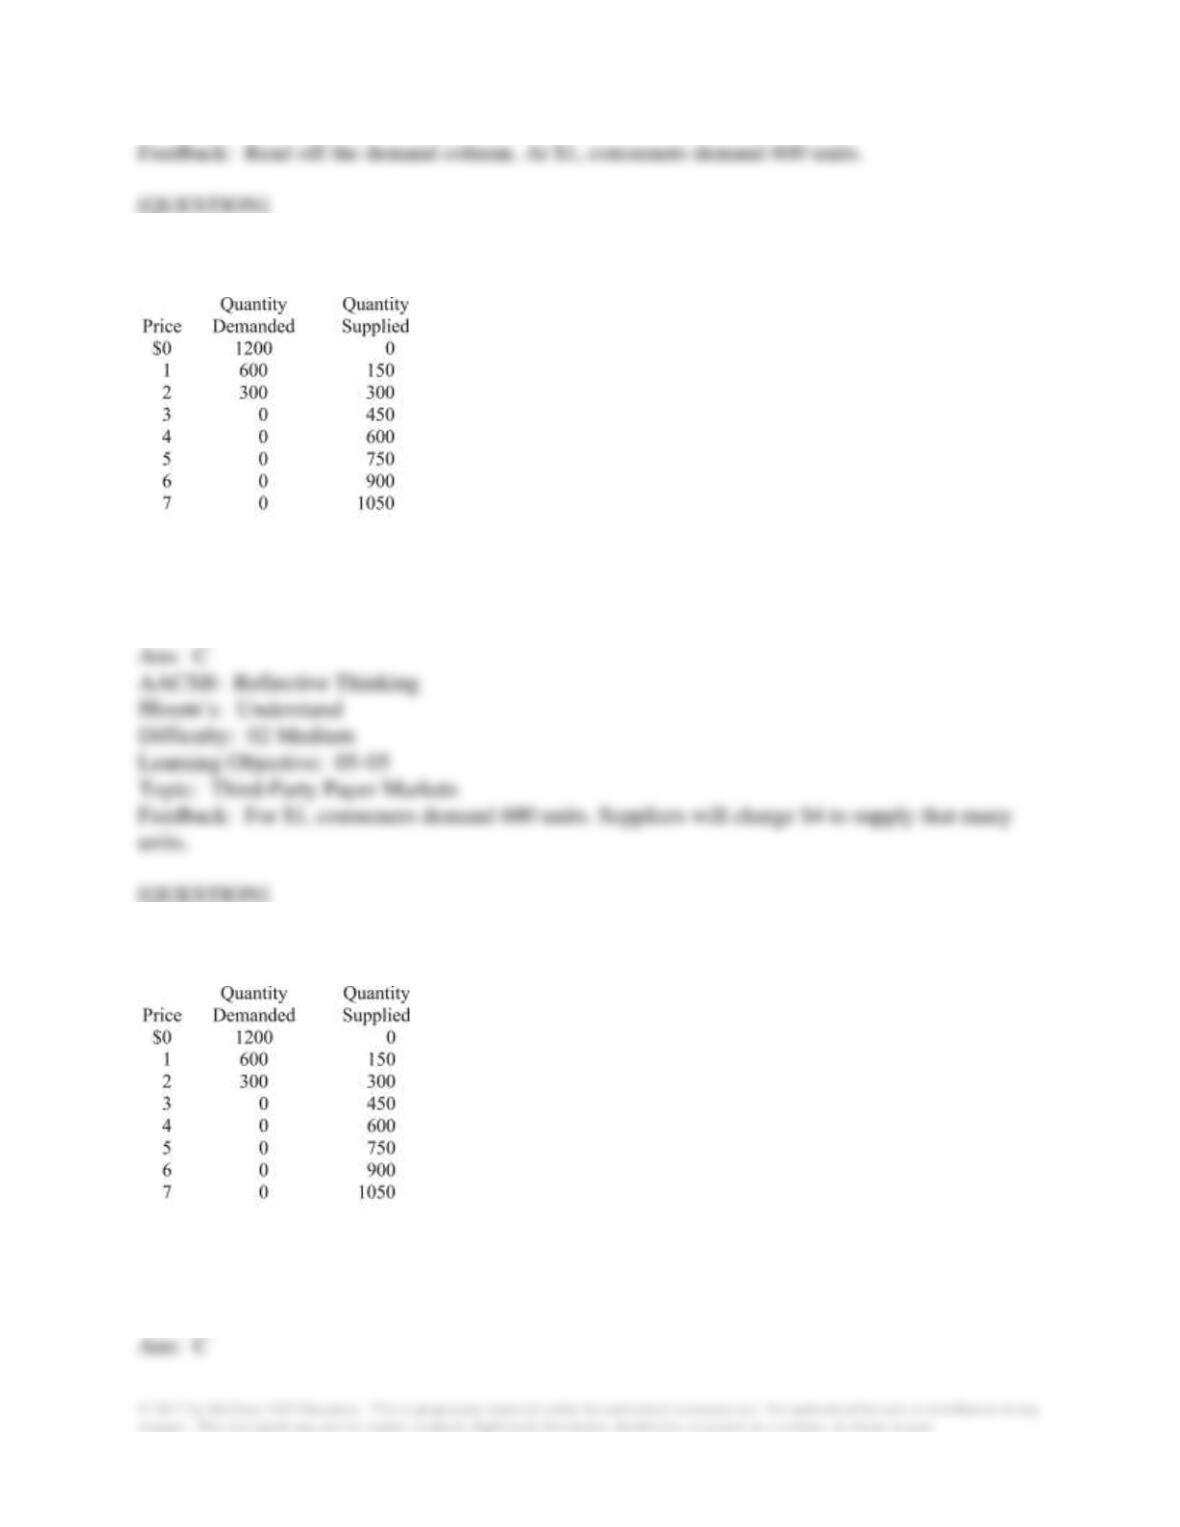
105. Refer to the table shown that depicts a third-party payer market. What is the price the
supplier will charge for the quantity consumers demand if a $1 co-pay is established?
A. $1
B. $2
C. $4
D. $7
106. Refer to the table shown that depicts a third-party payer market. What is the cost of this
program to the third-party if a $1 co-pay is established?
A. $0
B. $600
C. $1,800
D. $2,400
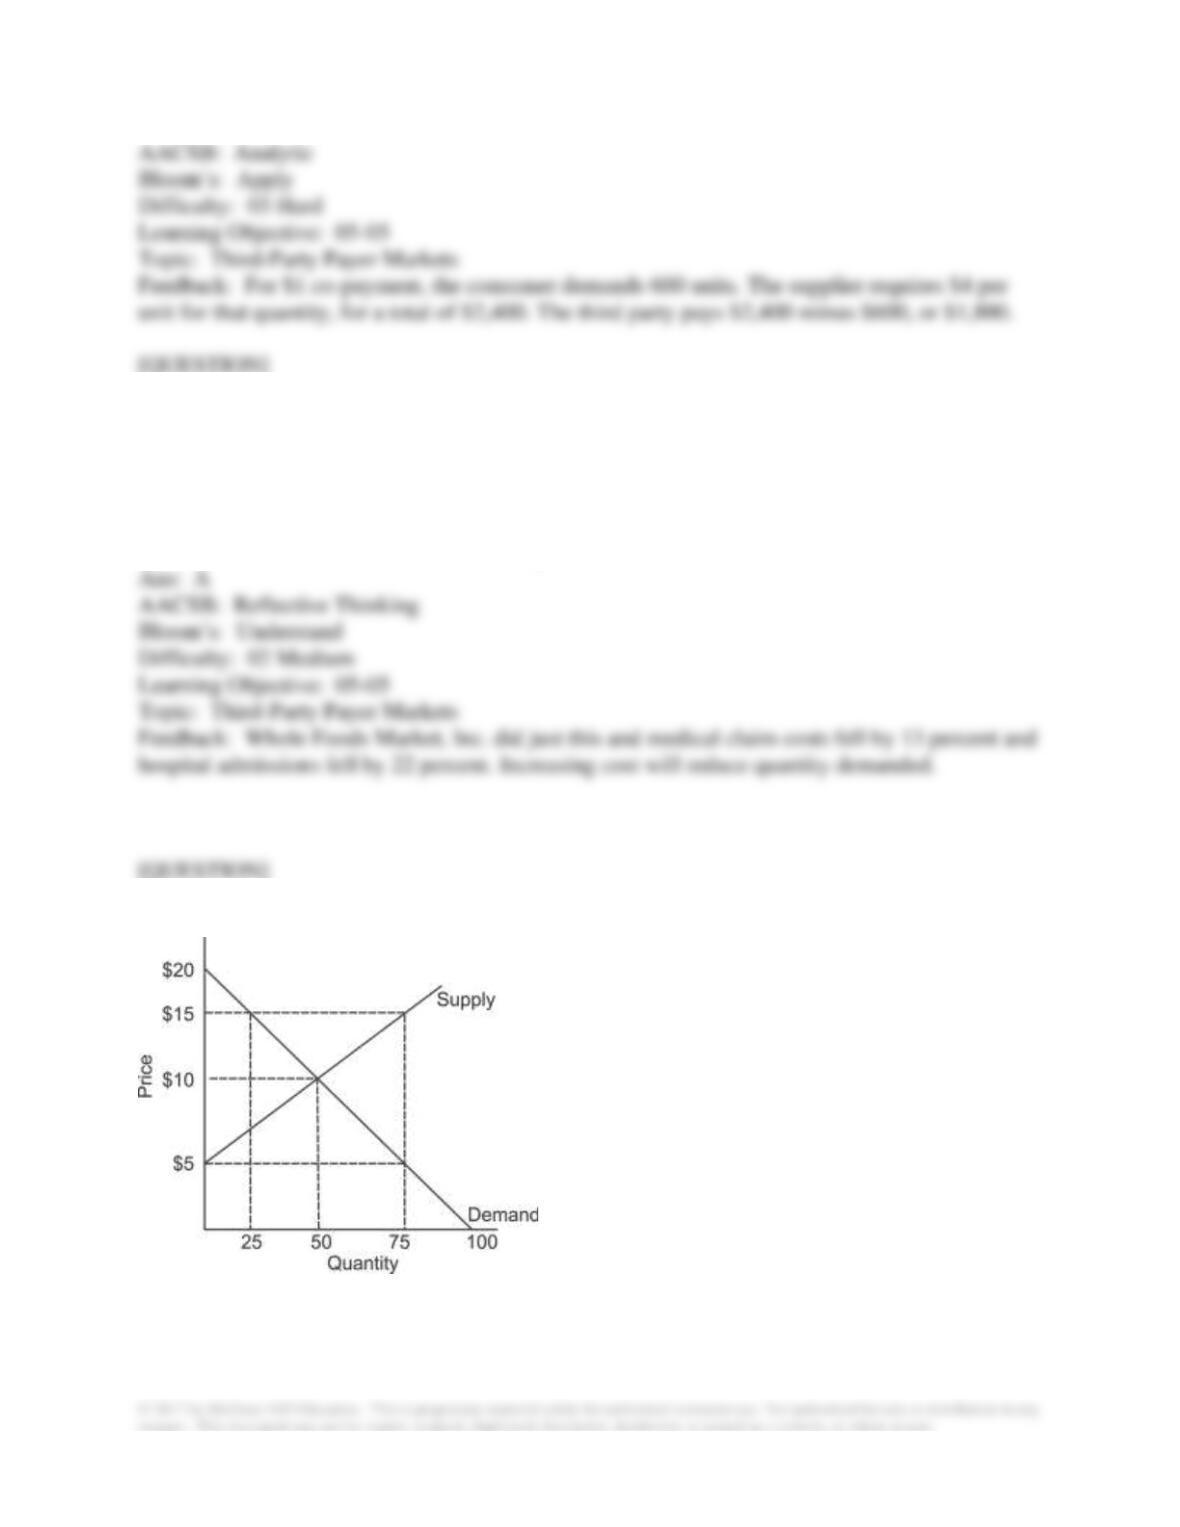
107. A company switches from a medical plan that covered all medical costs to a medical plan
with a high deductible, making employees responsible for the first $1,500 of healthcare costs.
Other things the same, a higher deductible is expected to:
A. reduce both medical claims and hospital admissions.
B. increase both medical claims and hospital admissions.
C. reduce medical claims and increase hospital admissions.
D. increase medical claims and reduce hospital admissions.
108. Refer to the graph shown. If buyers must pay $5, quantity demanded will equal:
A. 2.5.
B. 50.
C. 75.
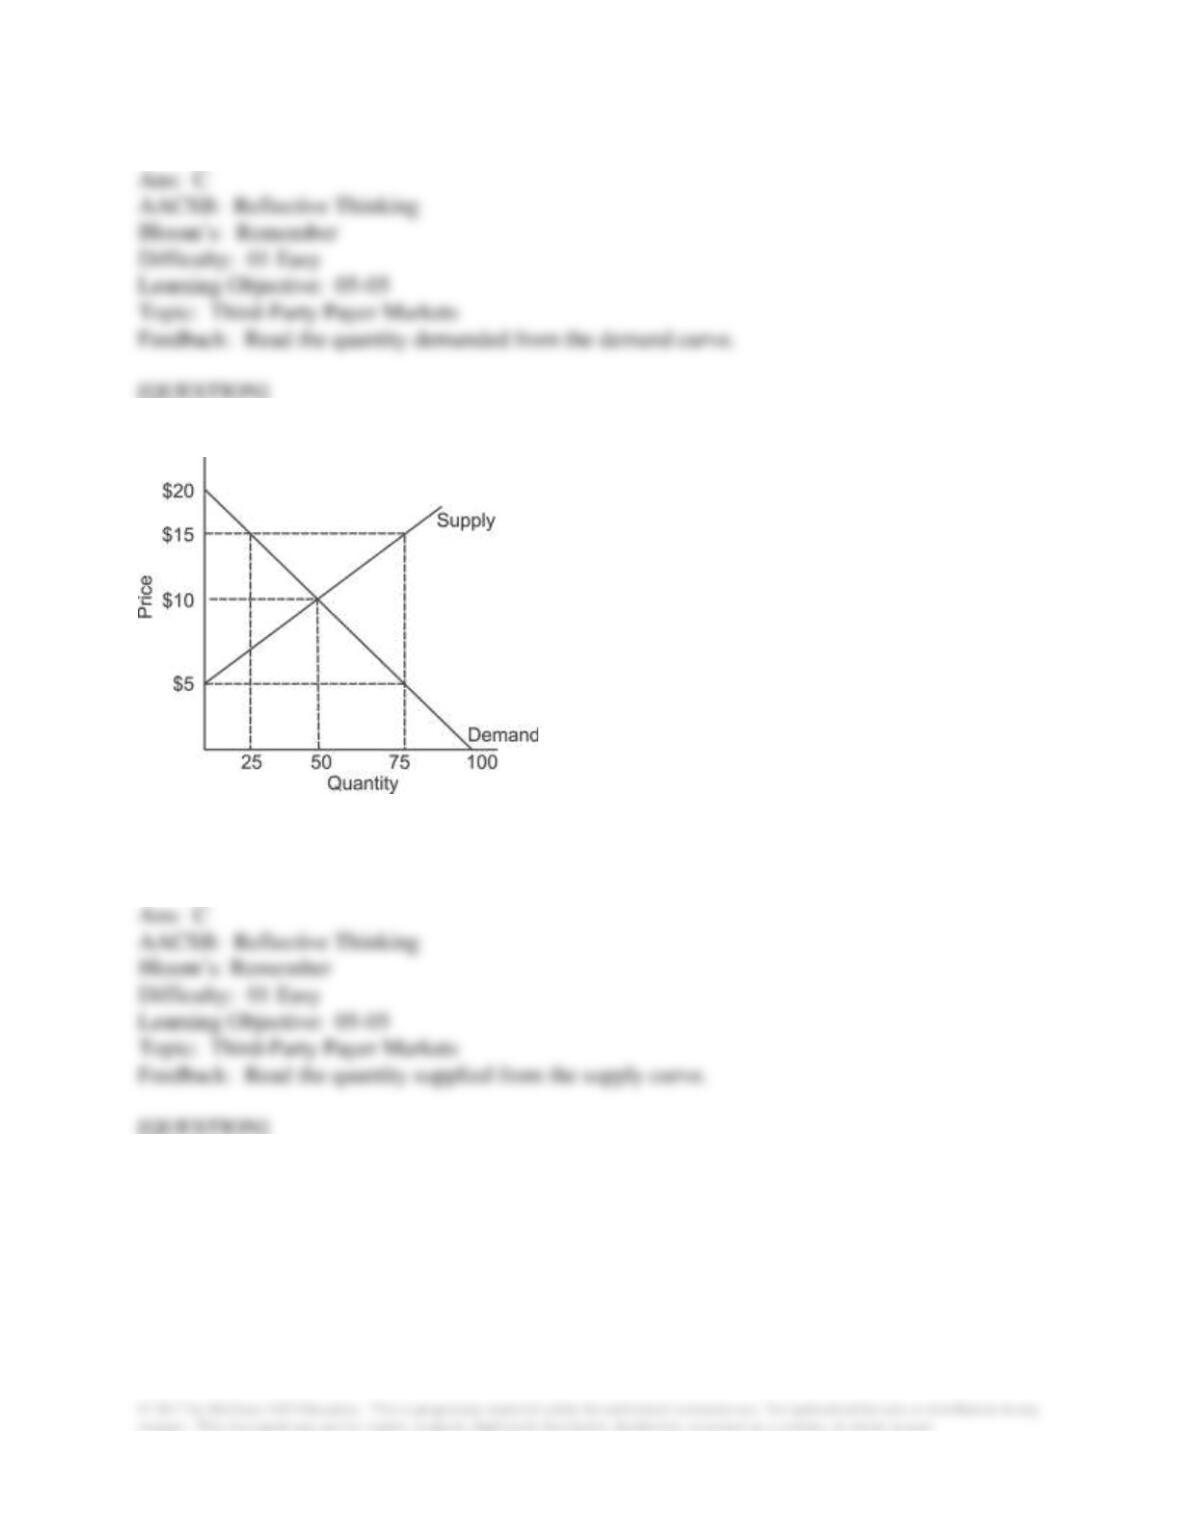
D. 100.
109. Refer to the graph shown. If sellers receive a price of $15, quantity supplied will equal:
A. 25.
B. 50.
C. 75.
D. 100.
110. Refer to the graph shown. If consumers have a $15 co-pay, total expenditure on the
product by both the third party and the consumer will equal: