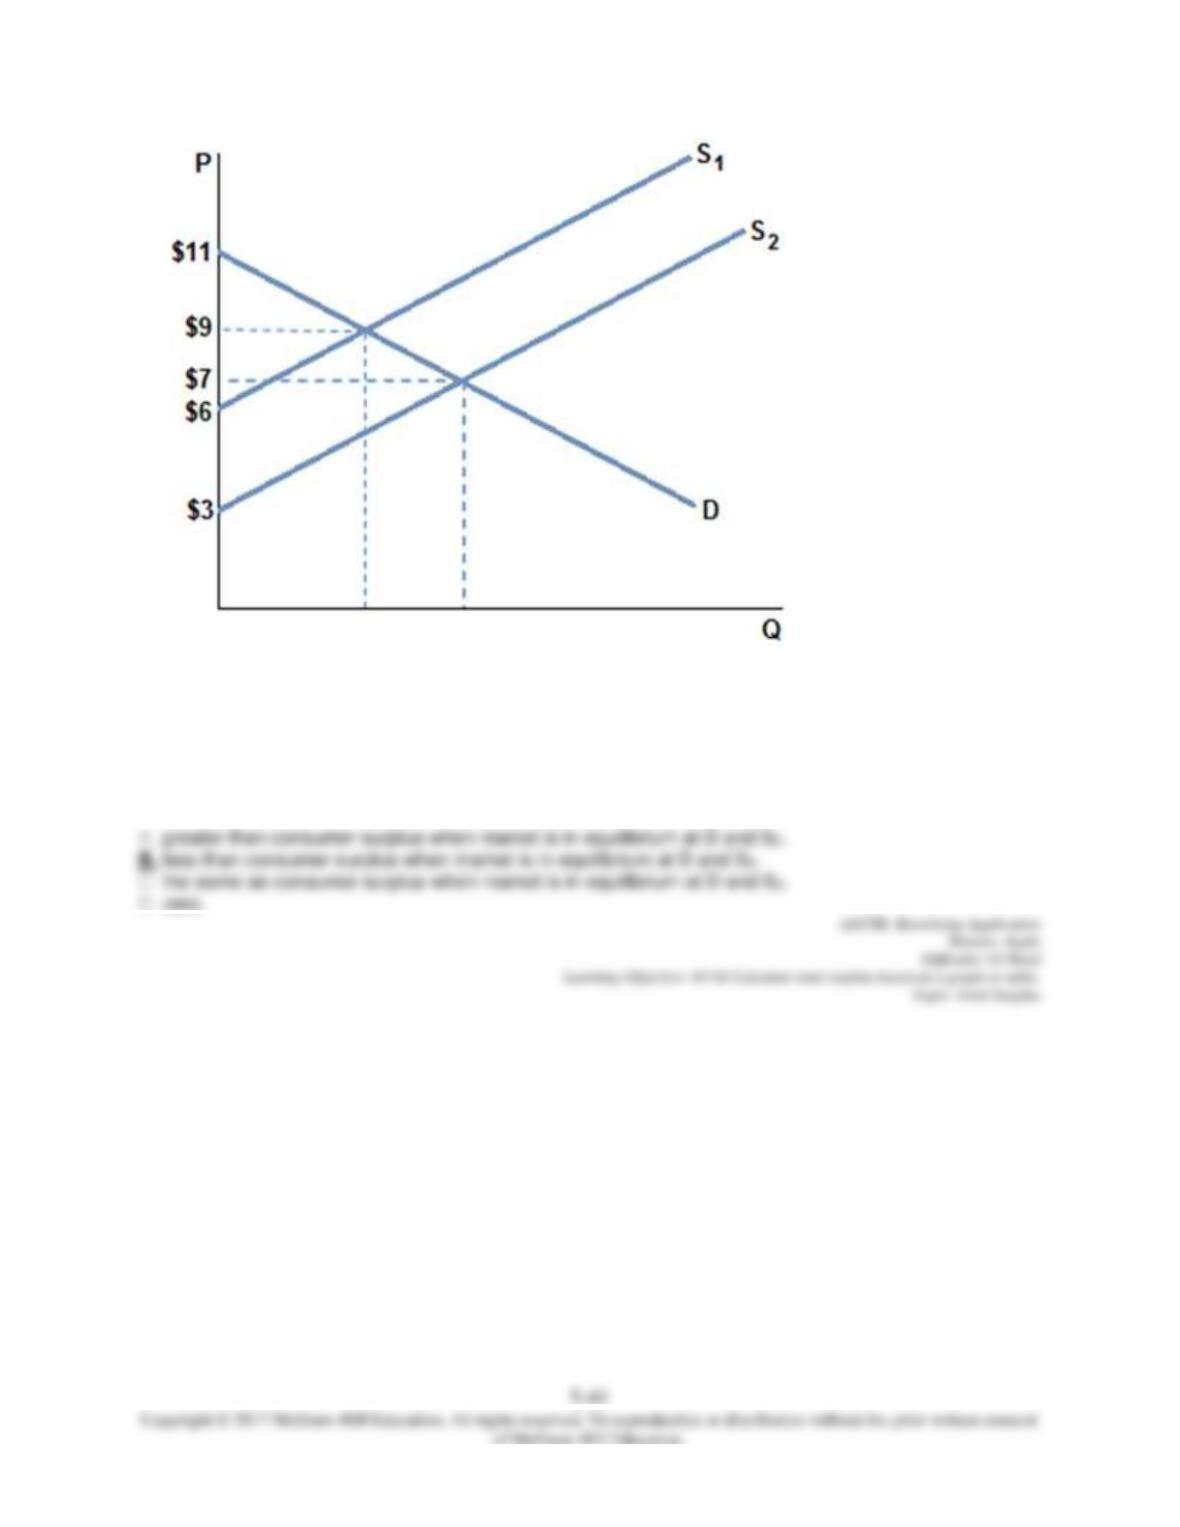
76.
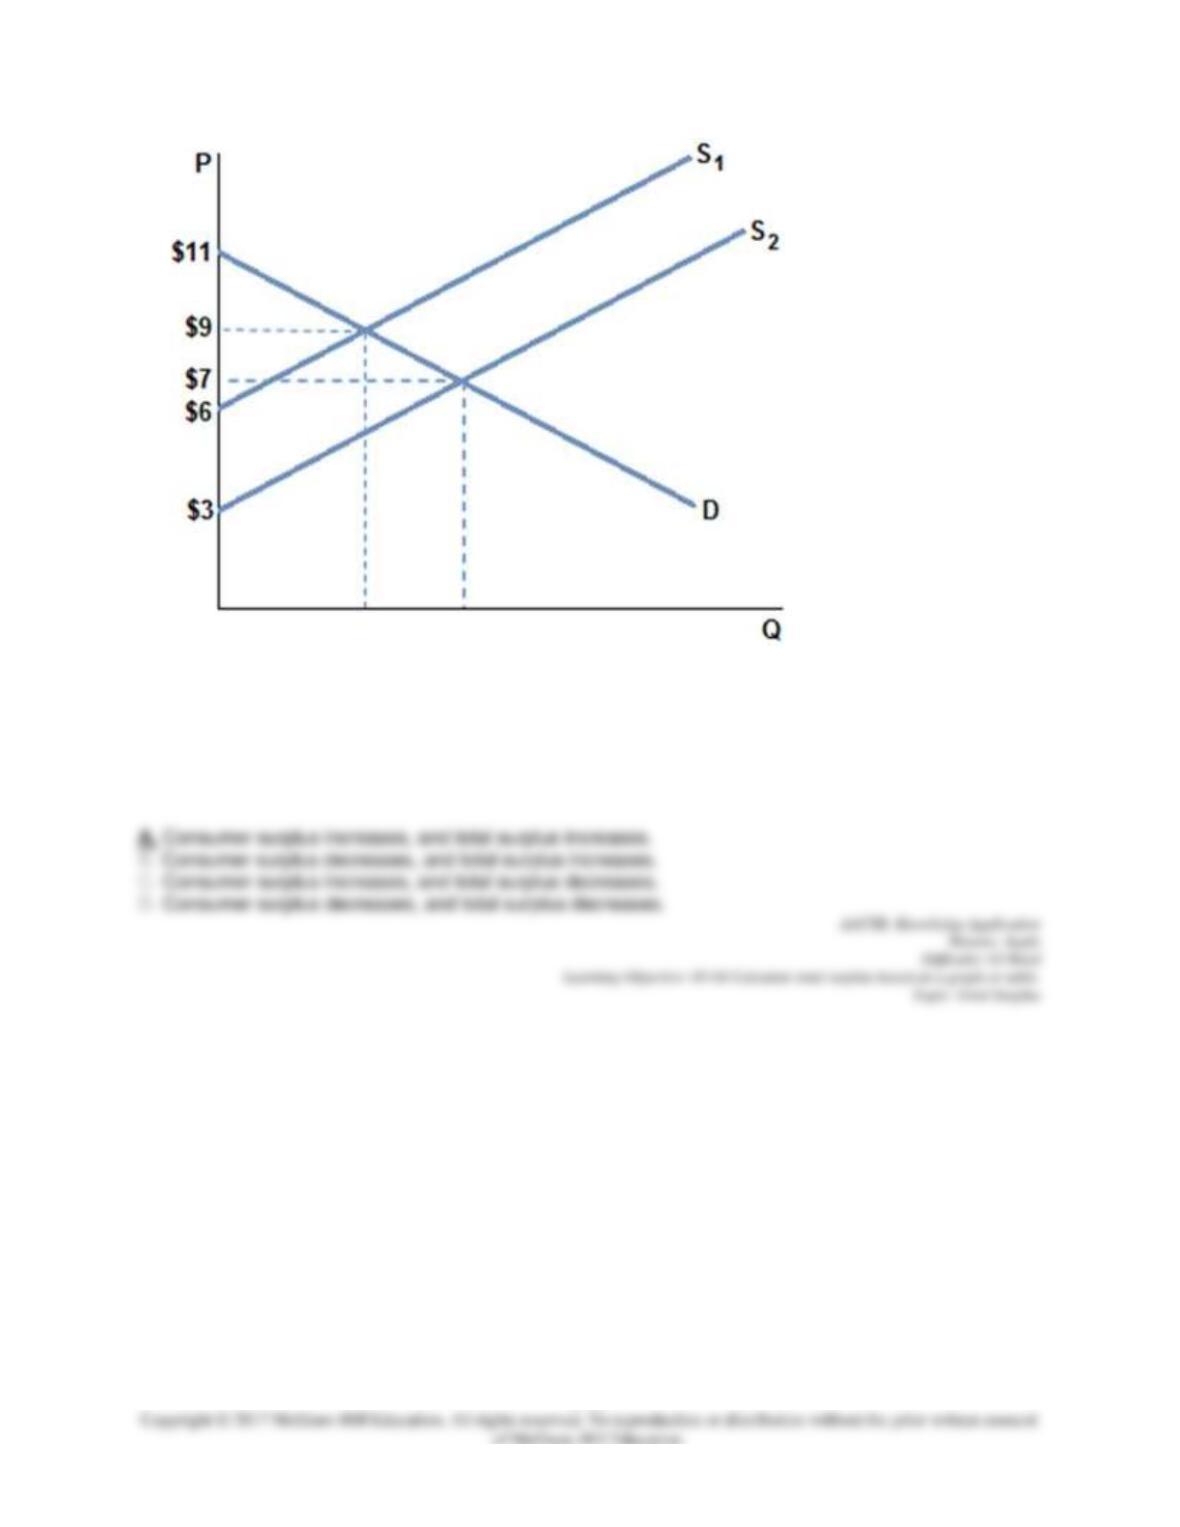
Assuming the market is in equilibrium in the graph shown with demand D and supply S1, consumer
surplus is:
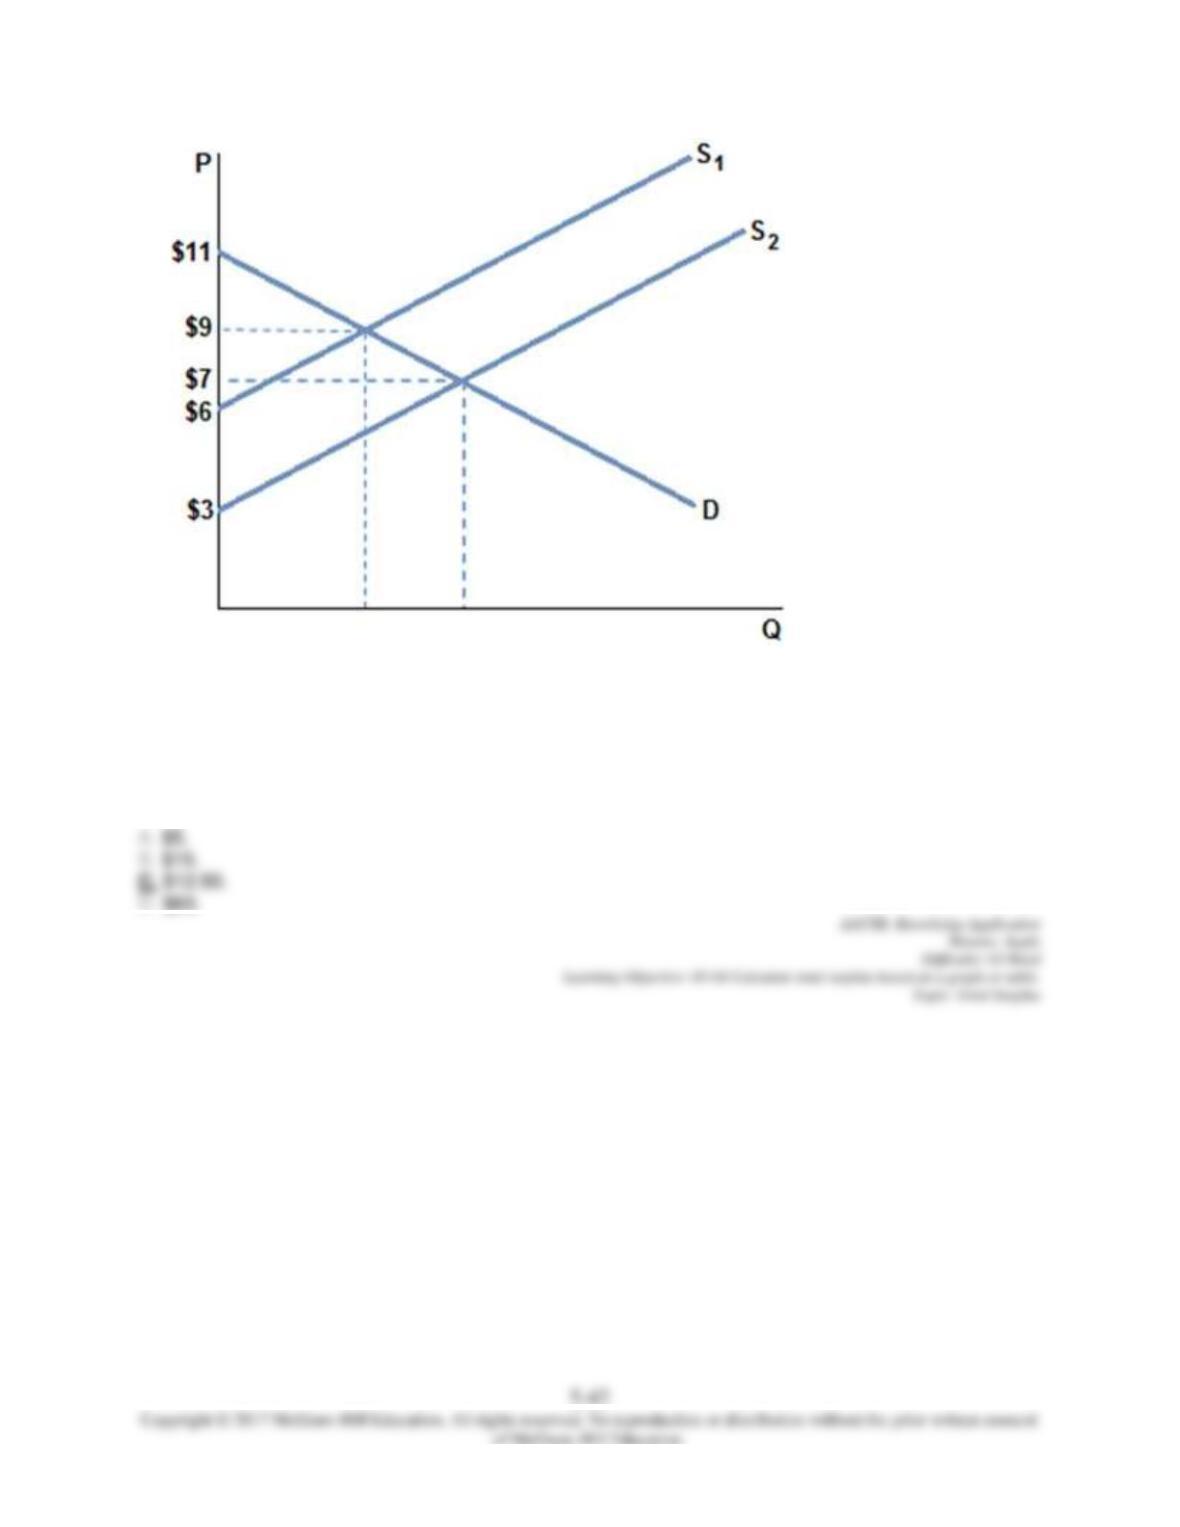
77.
Assume the market in the graph shown with demand D and supply S1 is in equilibrium at a quantity of 5
units. Total surplus is:
5-43
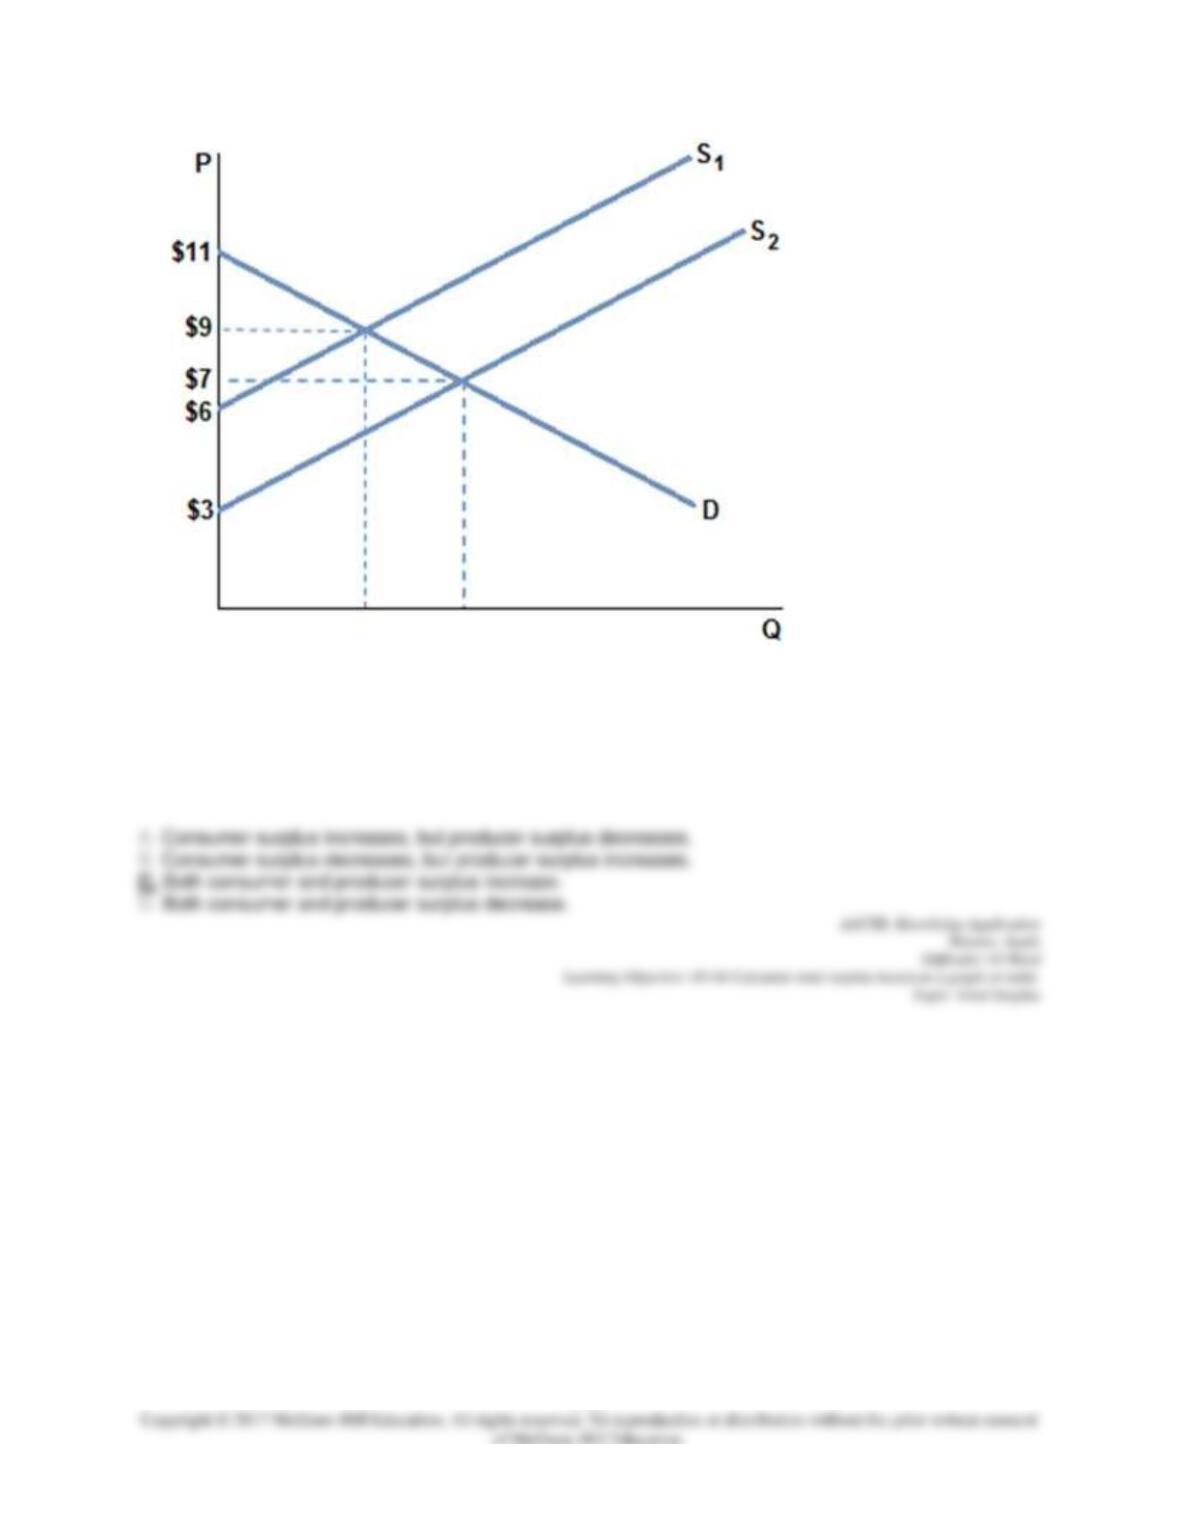
78.
Assume the market is in equilibrium in the graph shown at demand D and supply S1. If the supply curve
shifts to S2, and a new equilibrium is reached, which of the following is true?
5-44
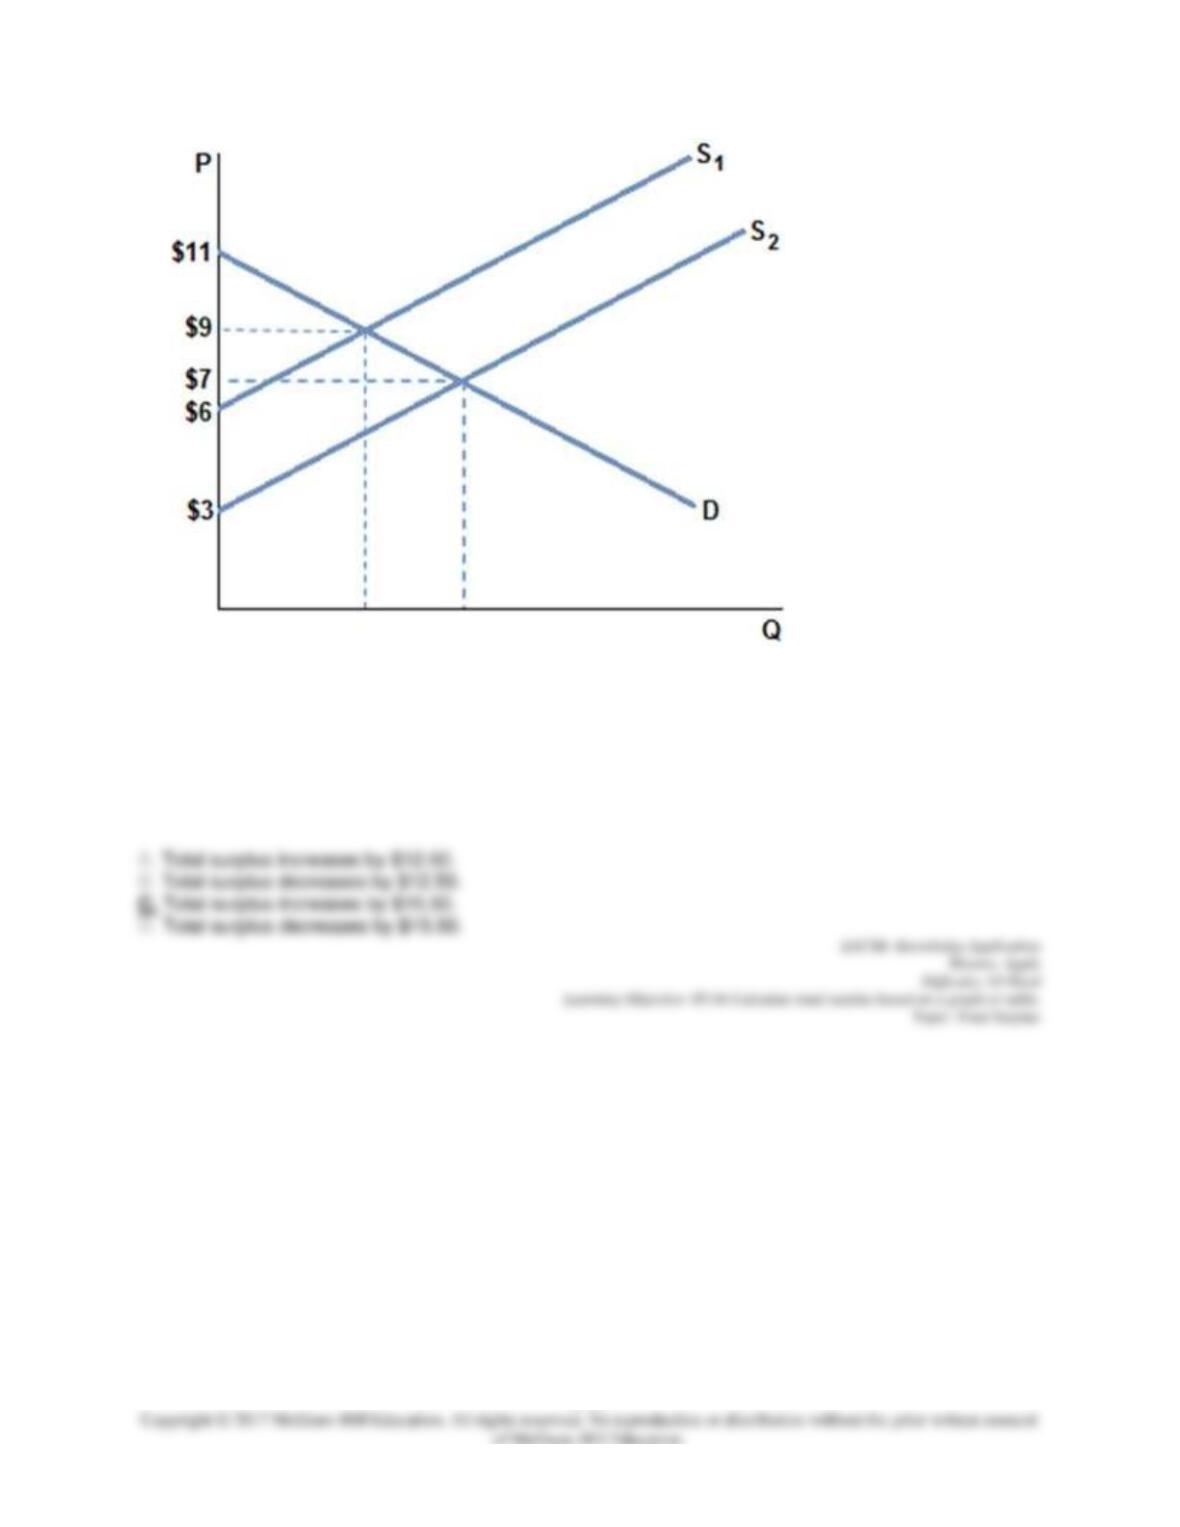
79.
Assume the market is in equilibrium in the graph shown at demand D and supply S1 (at a quantity of 5). If
the supply curve shifts to S2, and a new equilibrium is reached (at a quantity of 7), which of the following
is true?
5-45
80.
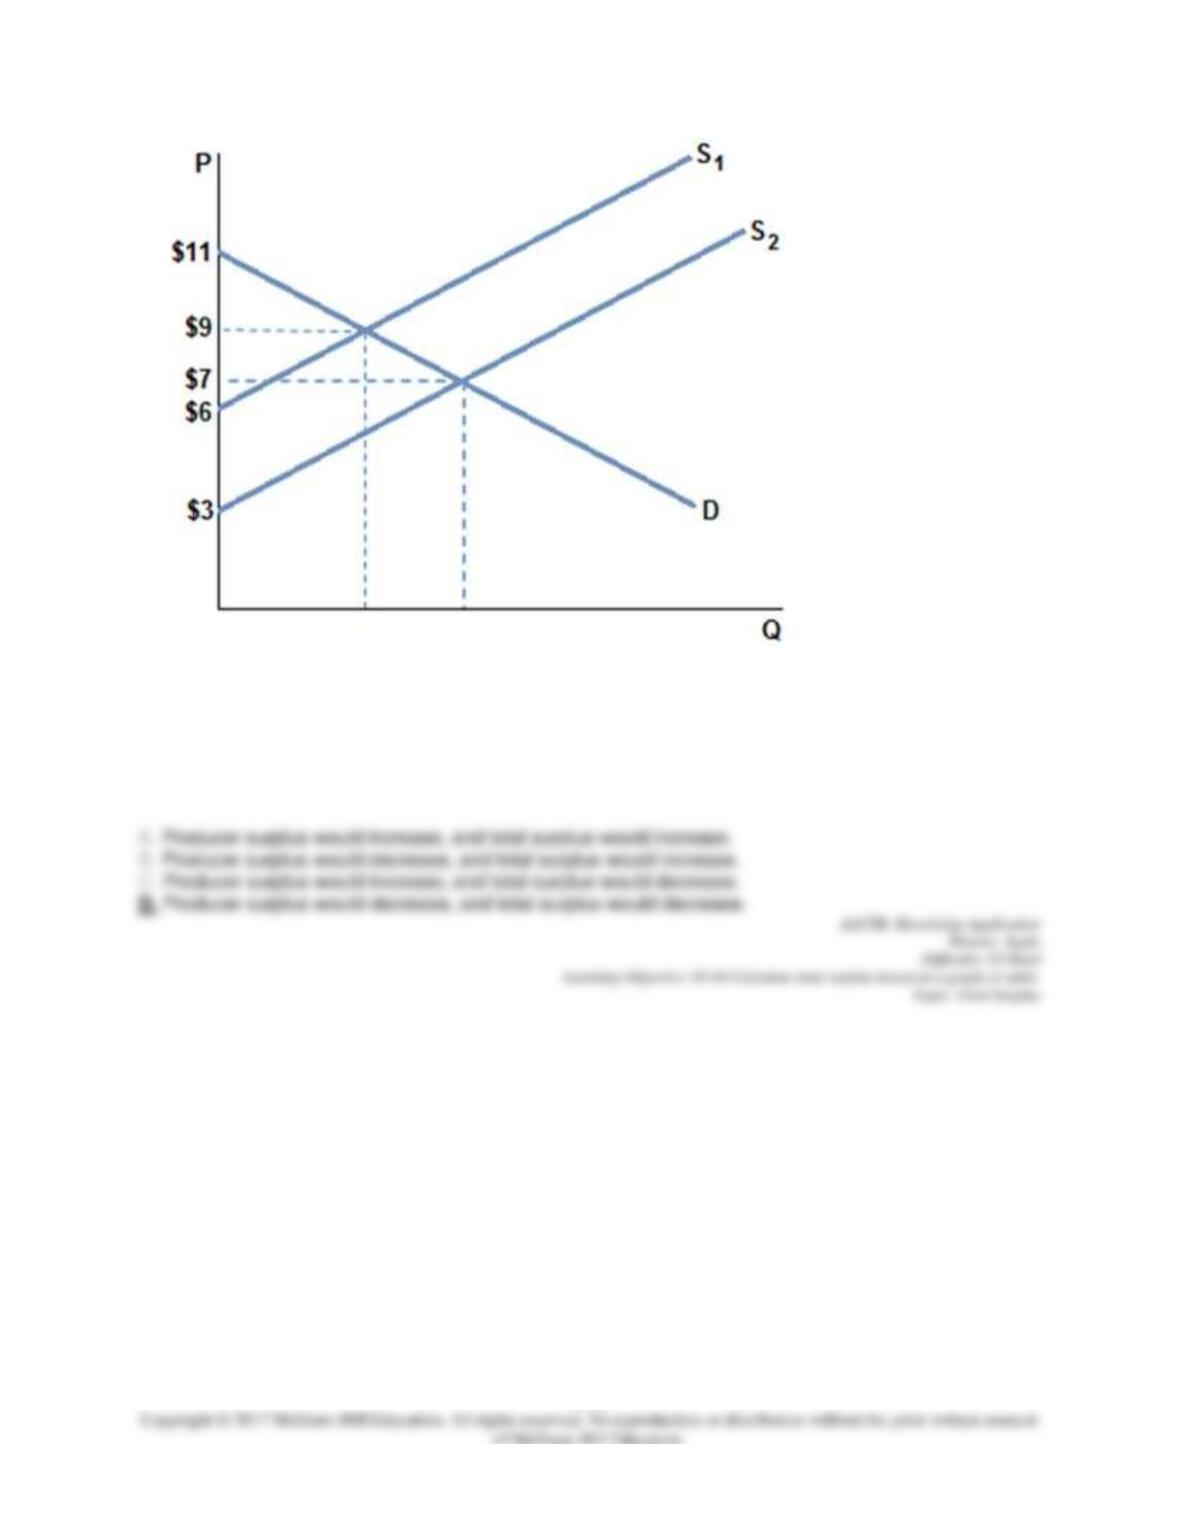
Assume the market is in equilibrium in the graph shown at demand D and supply S1. If the supply curve
shifts to S2, and a new equilibrium is reached, which of the following is true?
5-46
81.
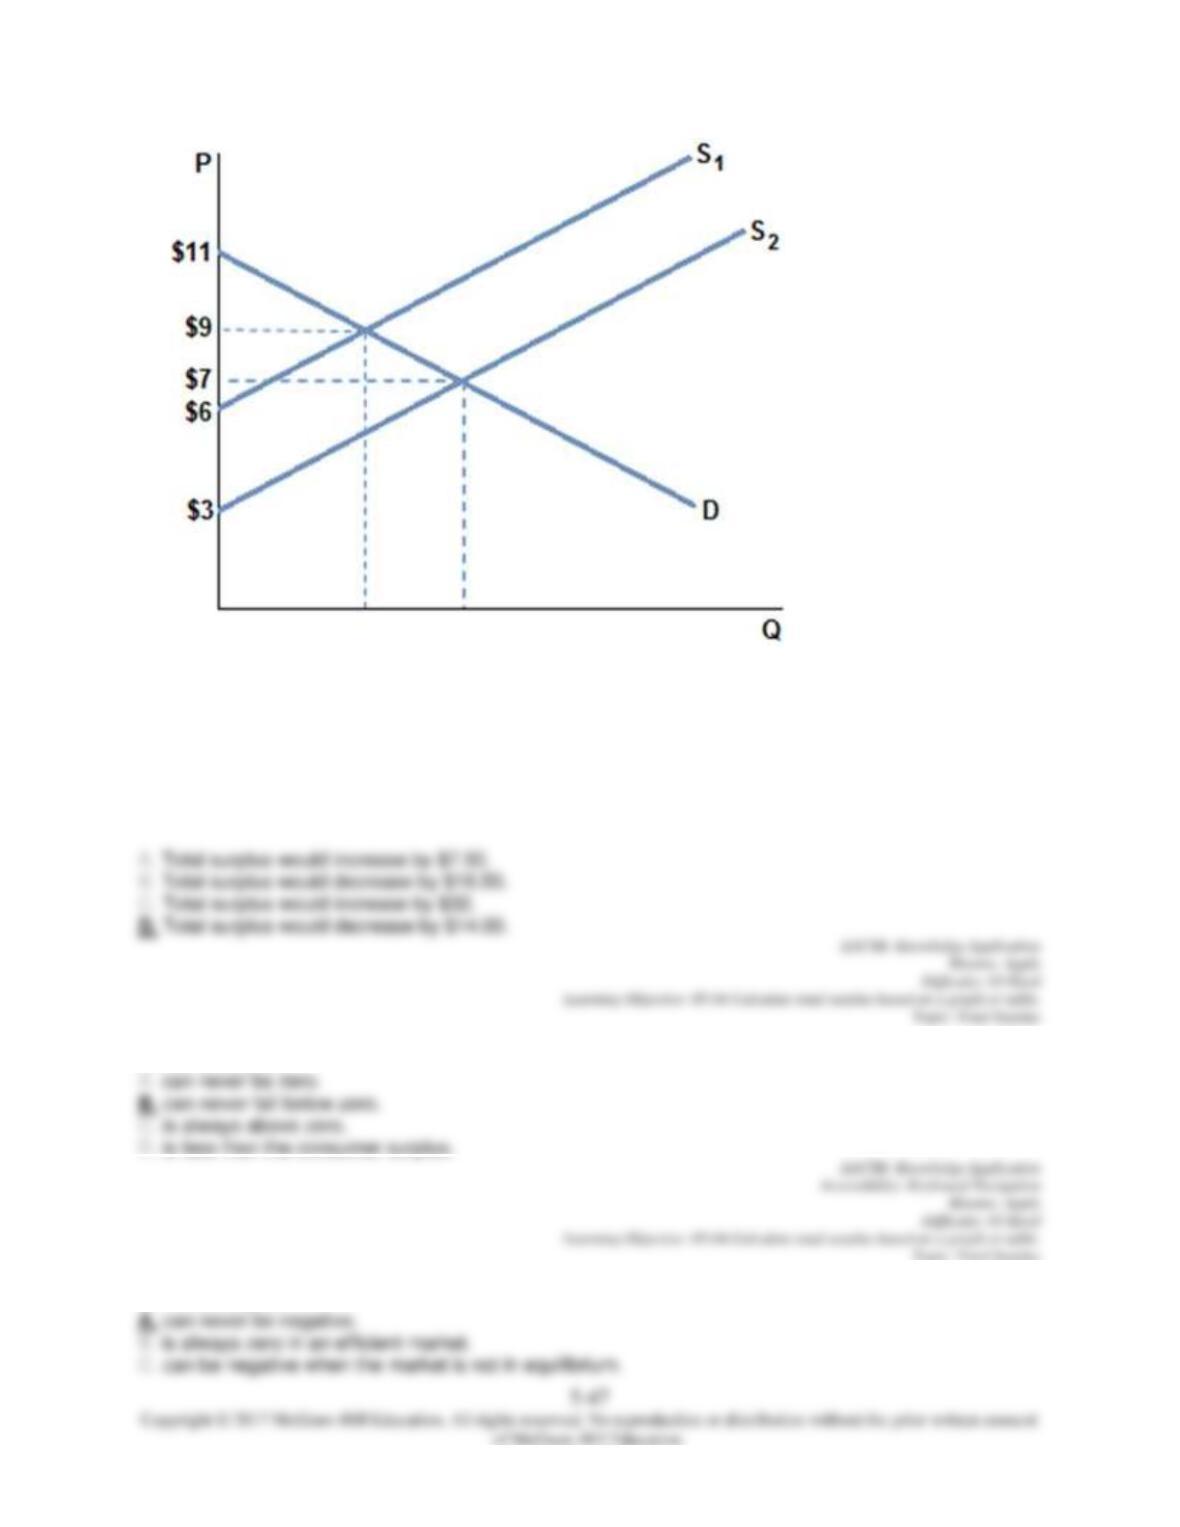
Assume the market is in equilibrium in the graph shown at demand D and supply S2. If the supply curve
shifts to S1, and a new equilibrium is reached, which of the following is true?
82.
Assume the market is in equilibrium in the graph shown at demand D and supply S2 (at a quantity of 6). If
the supply curve shifts to S1, and a new equilibrium is reached (at a quantity of 4), which of the following
is true?
83. Total surplus:
84. Total surplus:
85. Total surplus:
86.
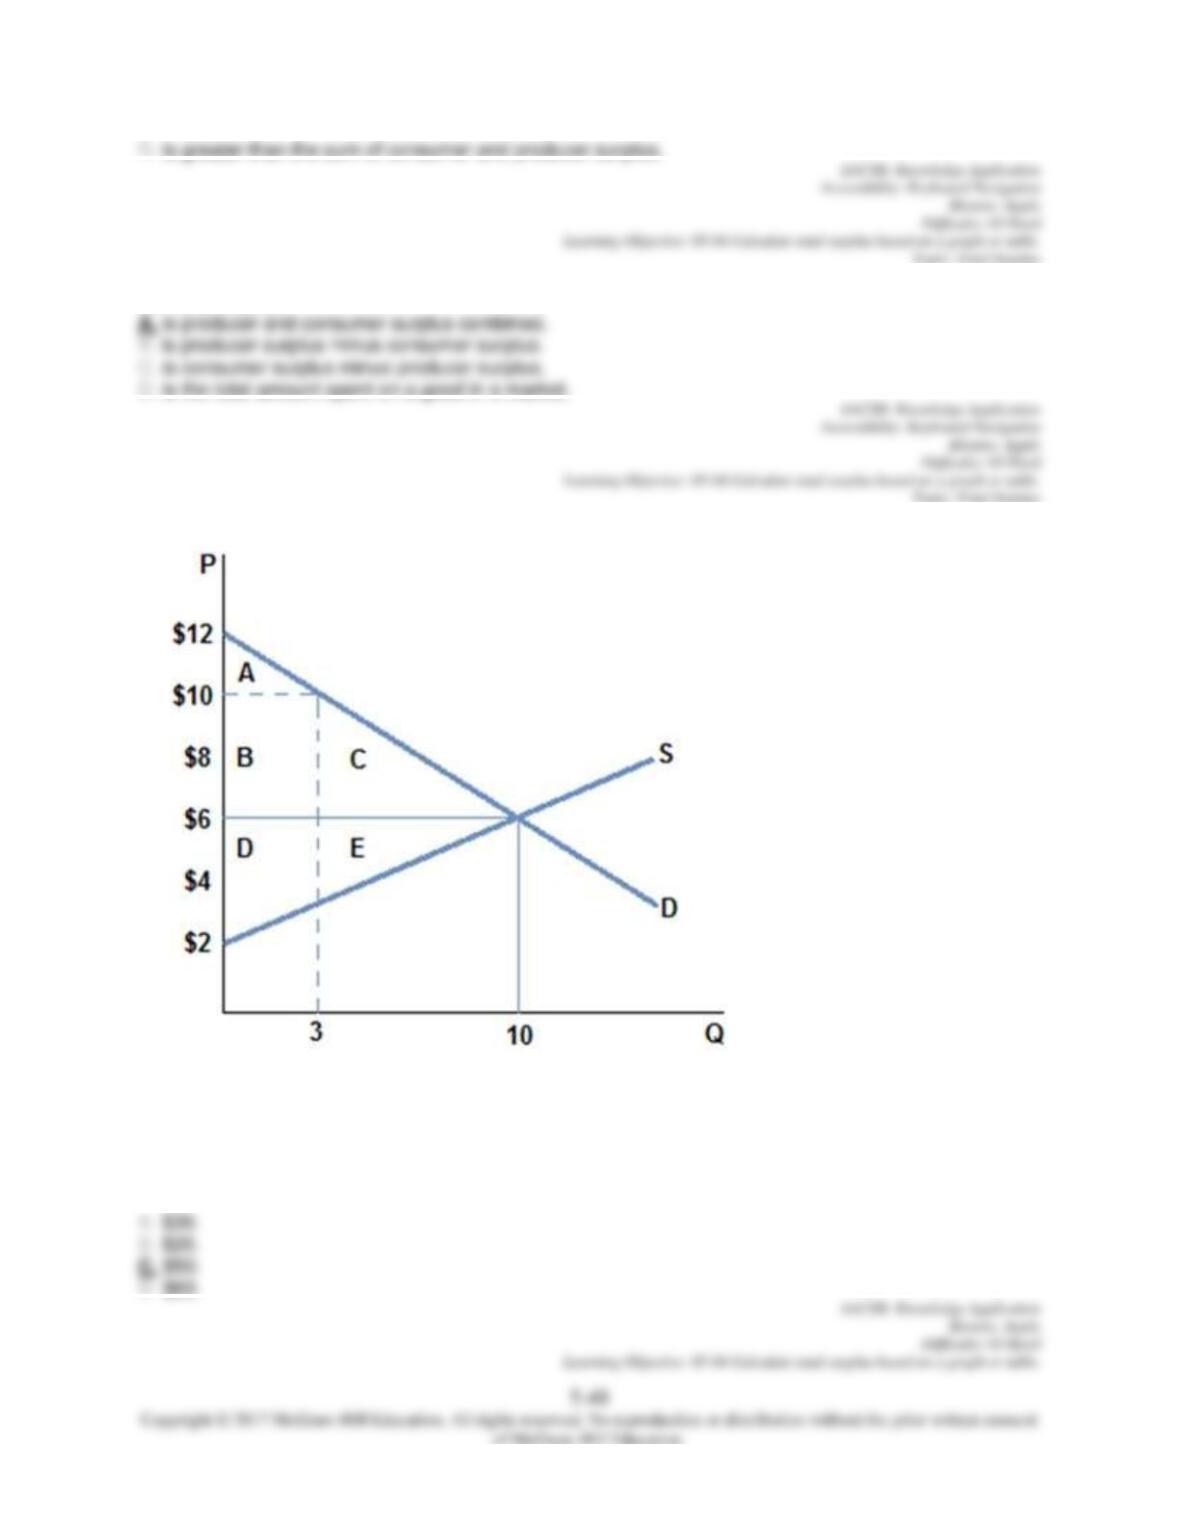
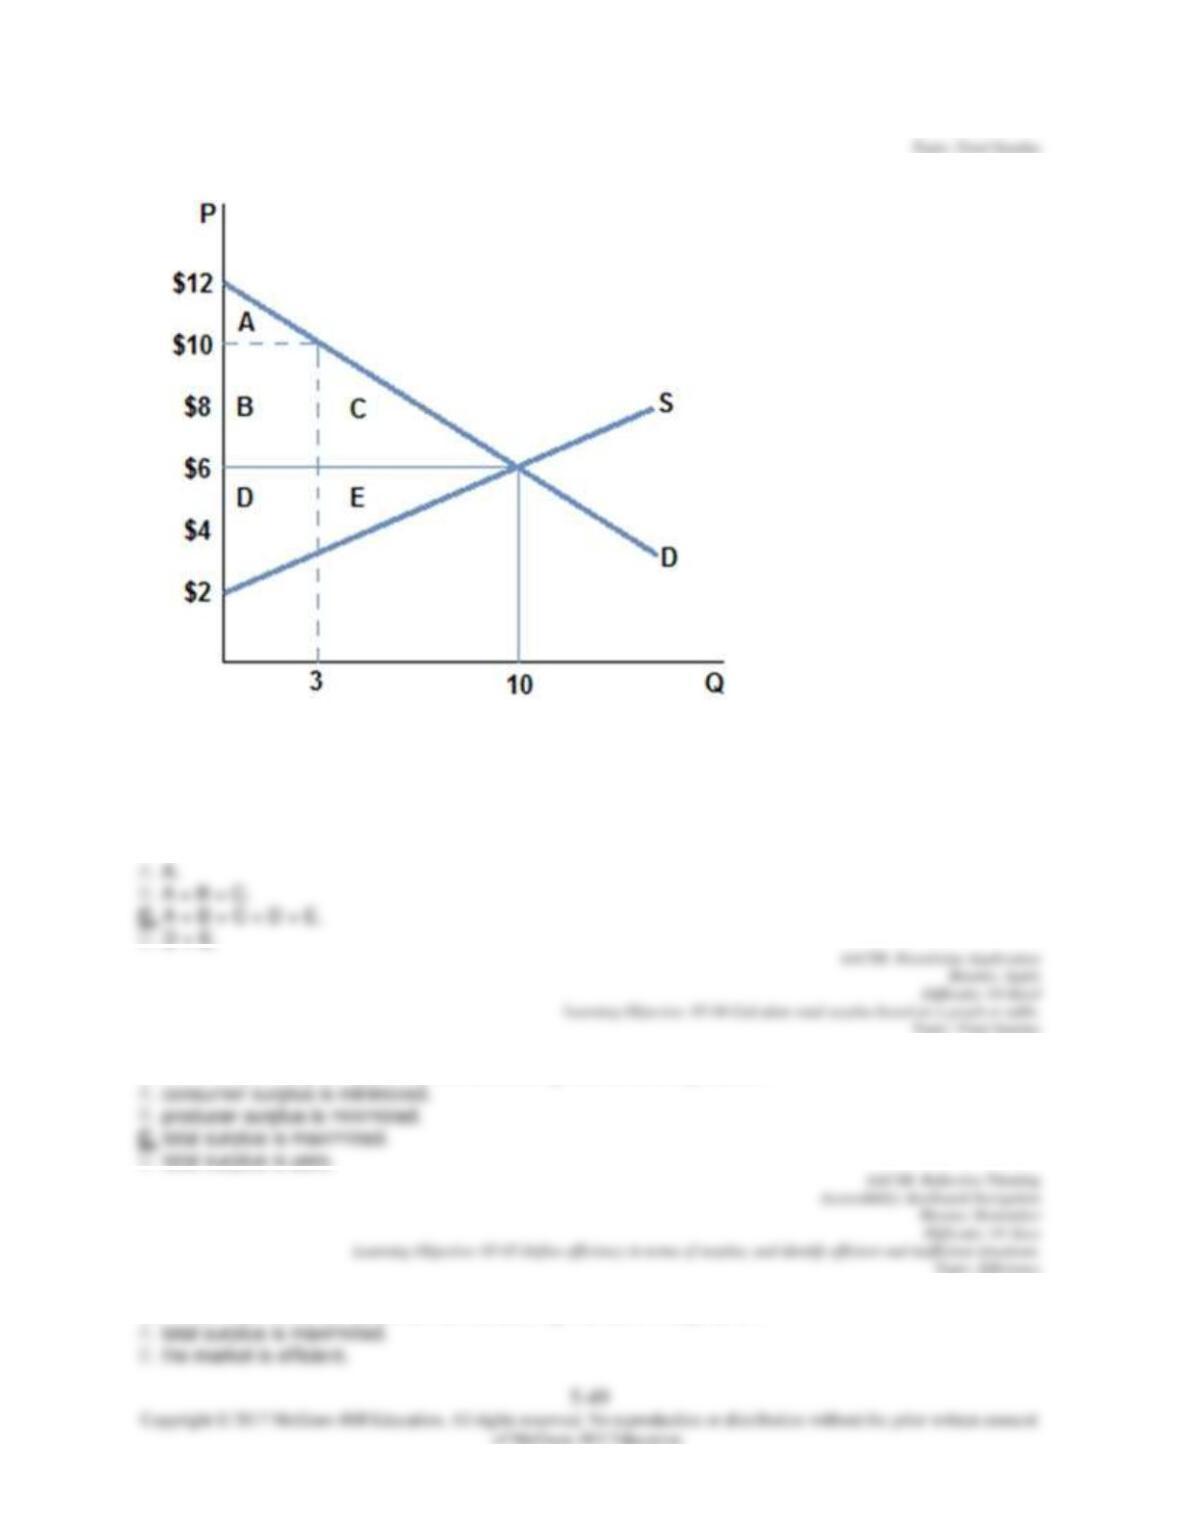
According to the graph shown, if the market is in equilibrium, total surplus is:
87.
According to the graph shown, if the market is in equilibrium, total surplus is area(s):
88. When a perfectly competitive, well-functioning market is in equilibrium:
89. When a perfectly competitive, well-functioning market is in equilibrium:
90. When a market is efficient:
91. Efficient markets:
92. When the market price is set above the equilibrium price:
93. When the market price is set below the equilibrium price:
94. When a perfectly competitive, well-functioning market is not in equilibrium:
5-51
95. When a perfectly competitive, well-functioning market is not in equilibrium:
96.
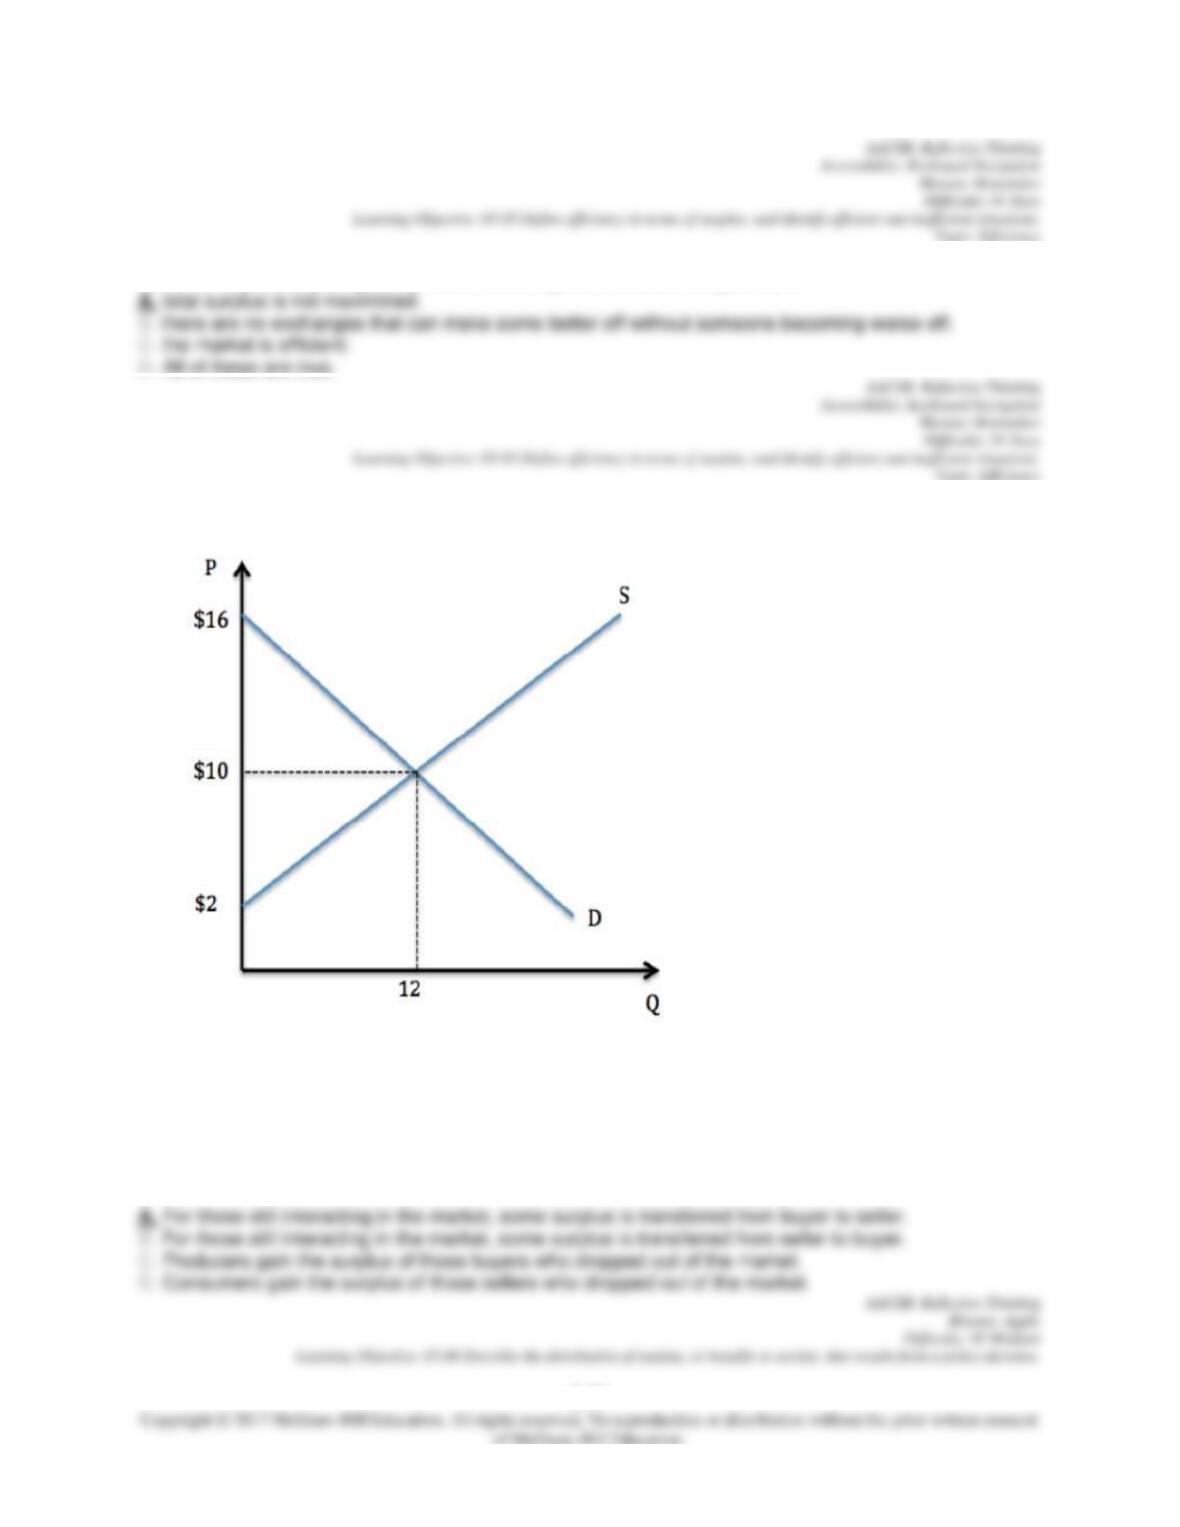
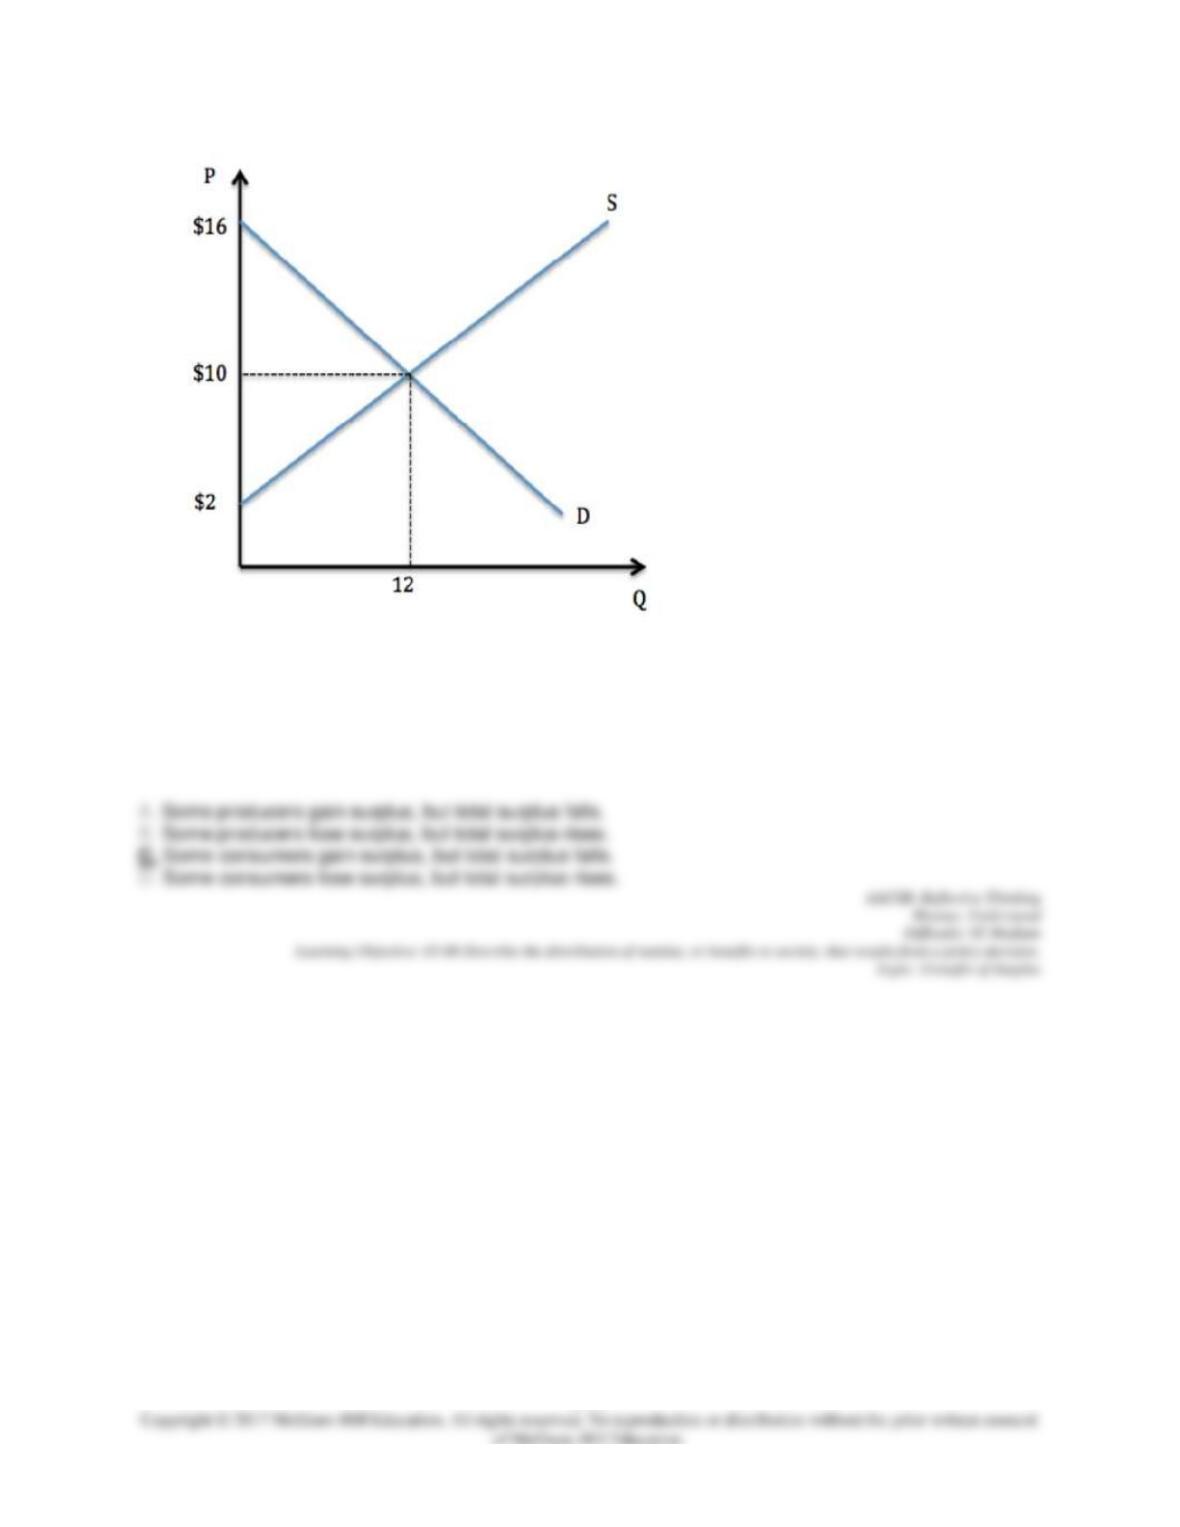
Assume the market was in equilibrium in the graph shown. If the market price were set to $12, which of
the following is true?
5-52
97.
Assume the market was in equilibrium in the graph shown. If the market price were set to $6, which of the
following is true?
5-53
98.
Assume the market was in equilibrium in the graph shown. If the market price gets set to $7, which of the
following is true?
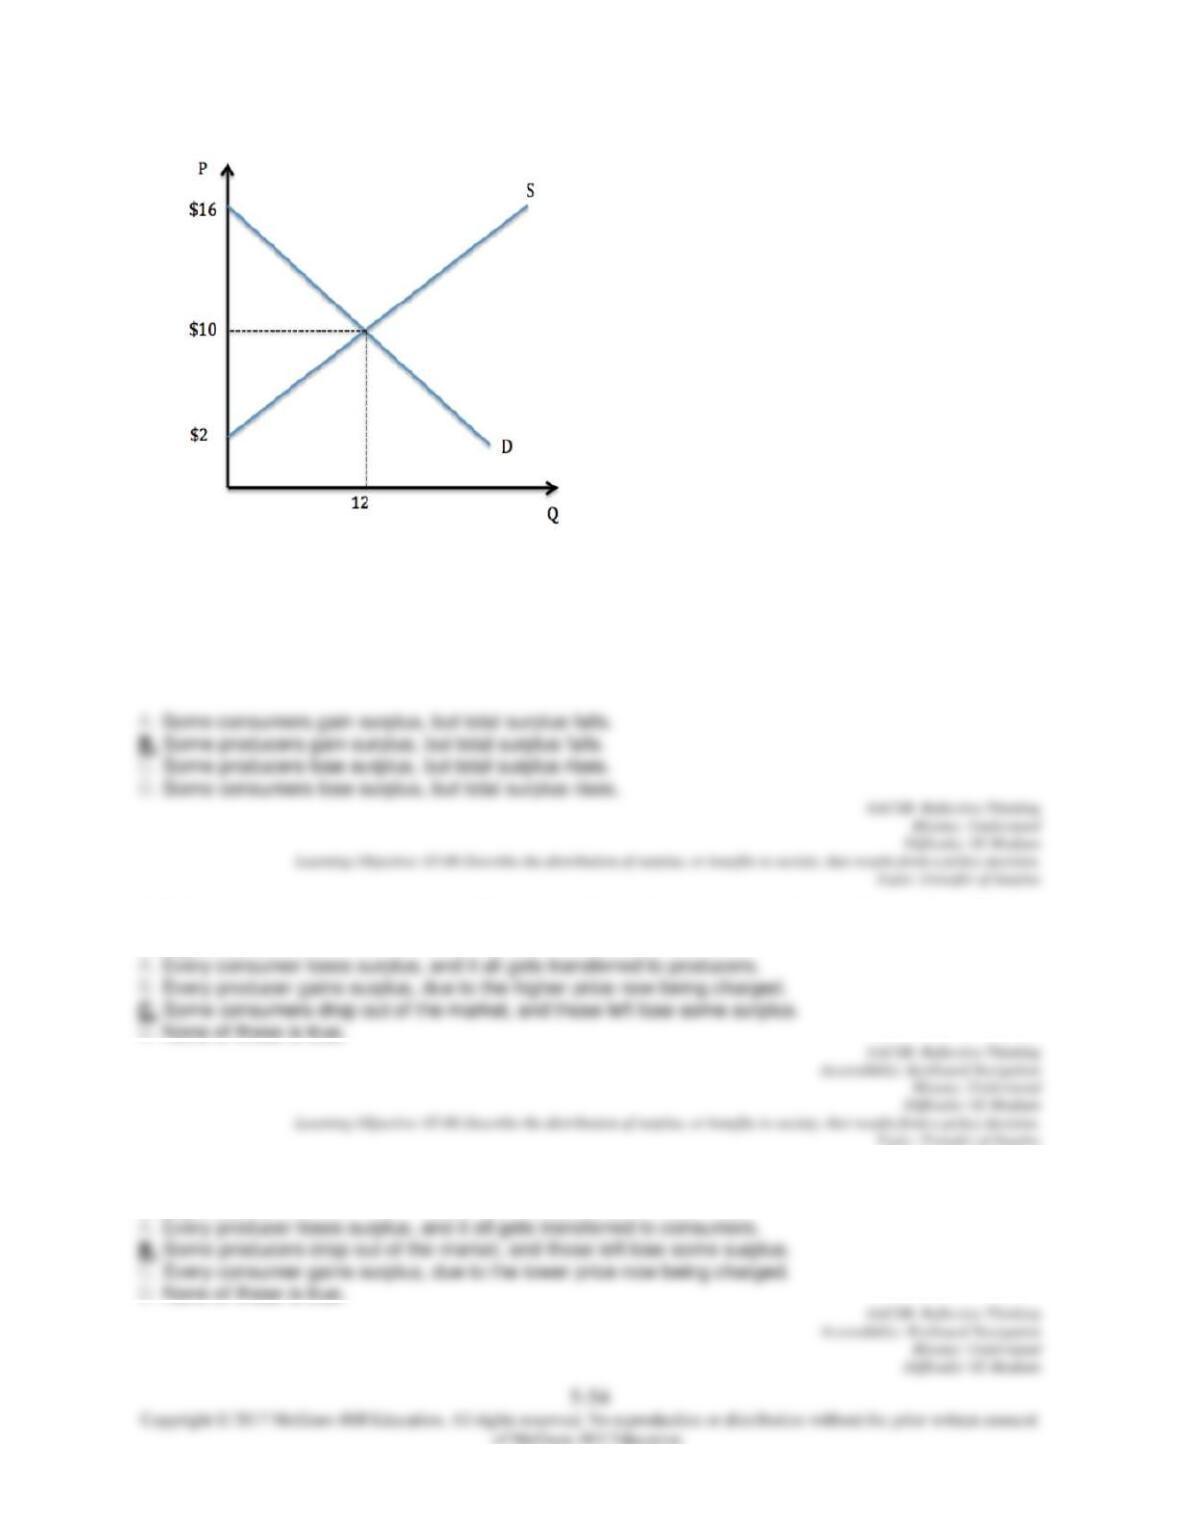
99.
Assume the market was in equilibrium in the graph shown. If the market price gets set to $14, which of
the following is true?
100. Assume a market price gets set artificially high-that is, it gets set above the equilibrium price. This
change means:
101. Assume a market price gets set artificially low-that is, it gets set below the equilibrium price. This
change means:
102. Assume a market that has an equilibrium price of $4. If the market price is set at $8, which of the
103. Assume a market that has an equilibrium price of $7. If the market price is set at $3, which of the
following is true?
104. Assume a market that has an equilibrium price of $5. If the market price is set at $9, producer
surplus:
105. Assume a market that has an equilibrium price of $8. If the market price is set at $7, consumer
surplus:
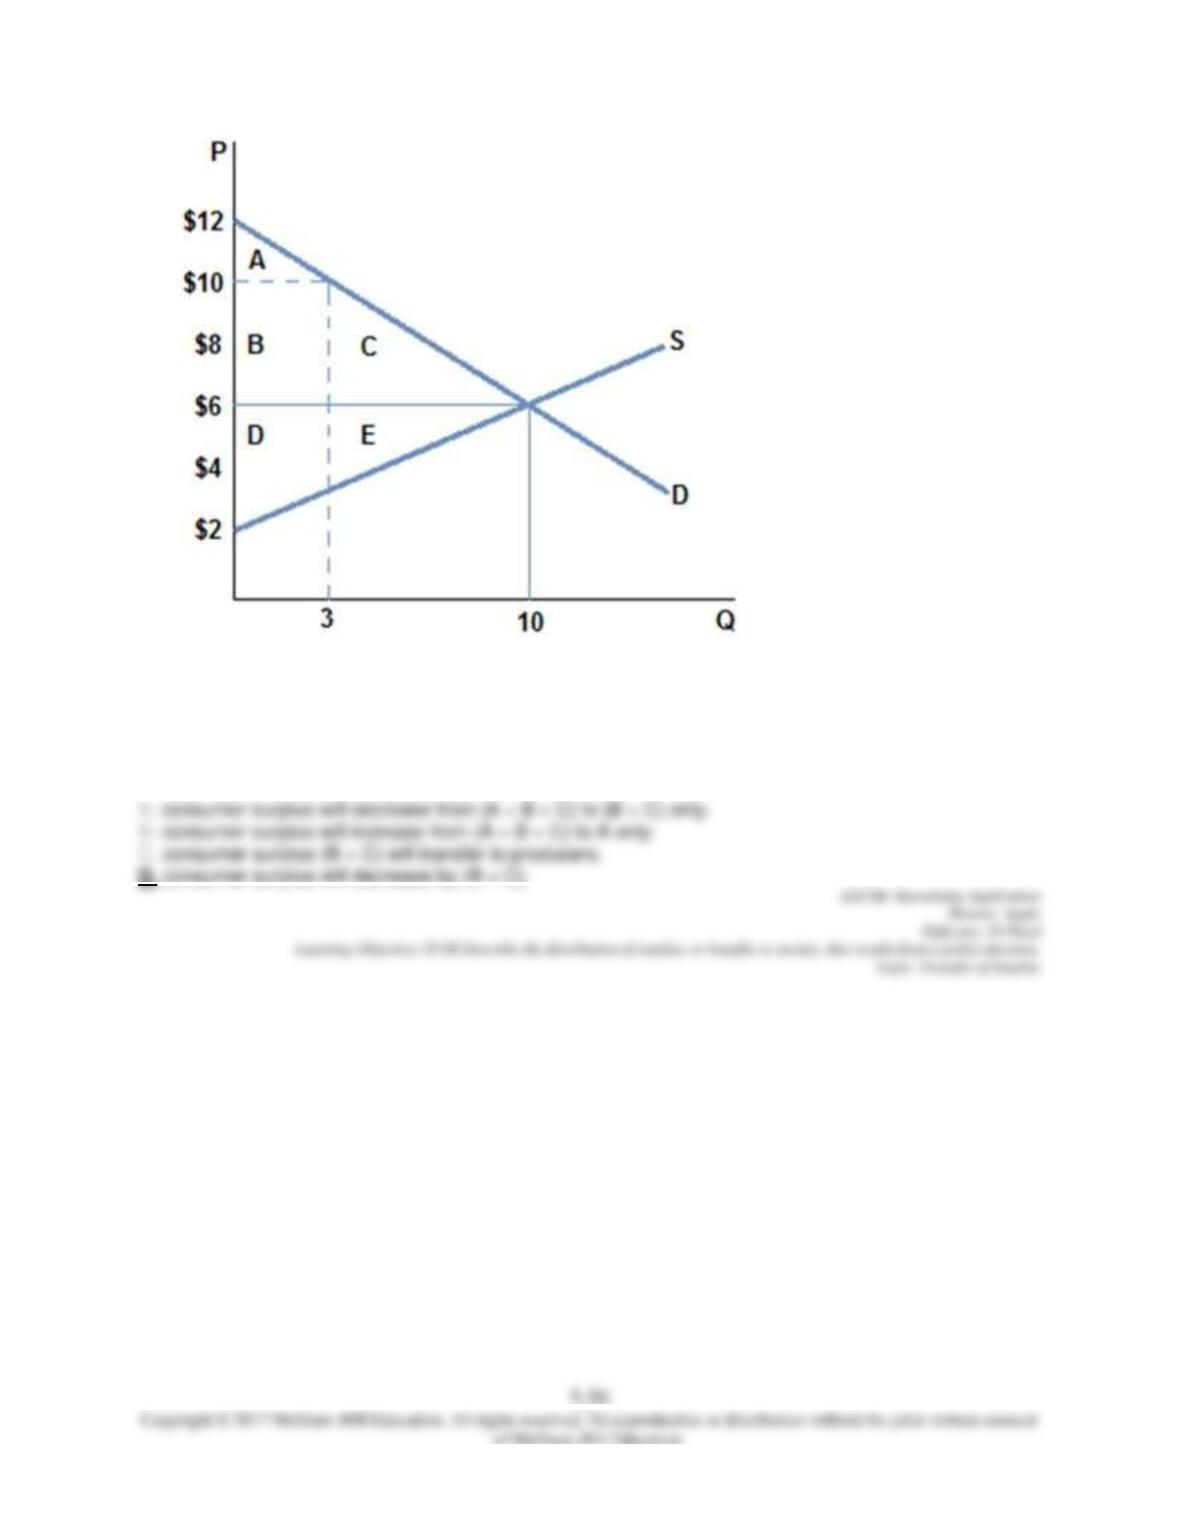
106.
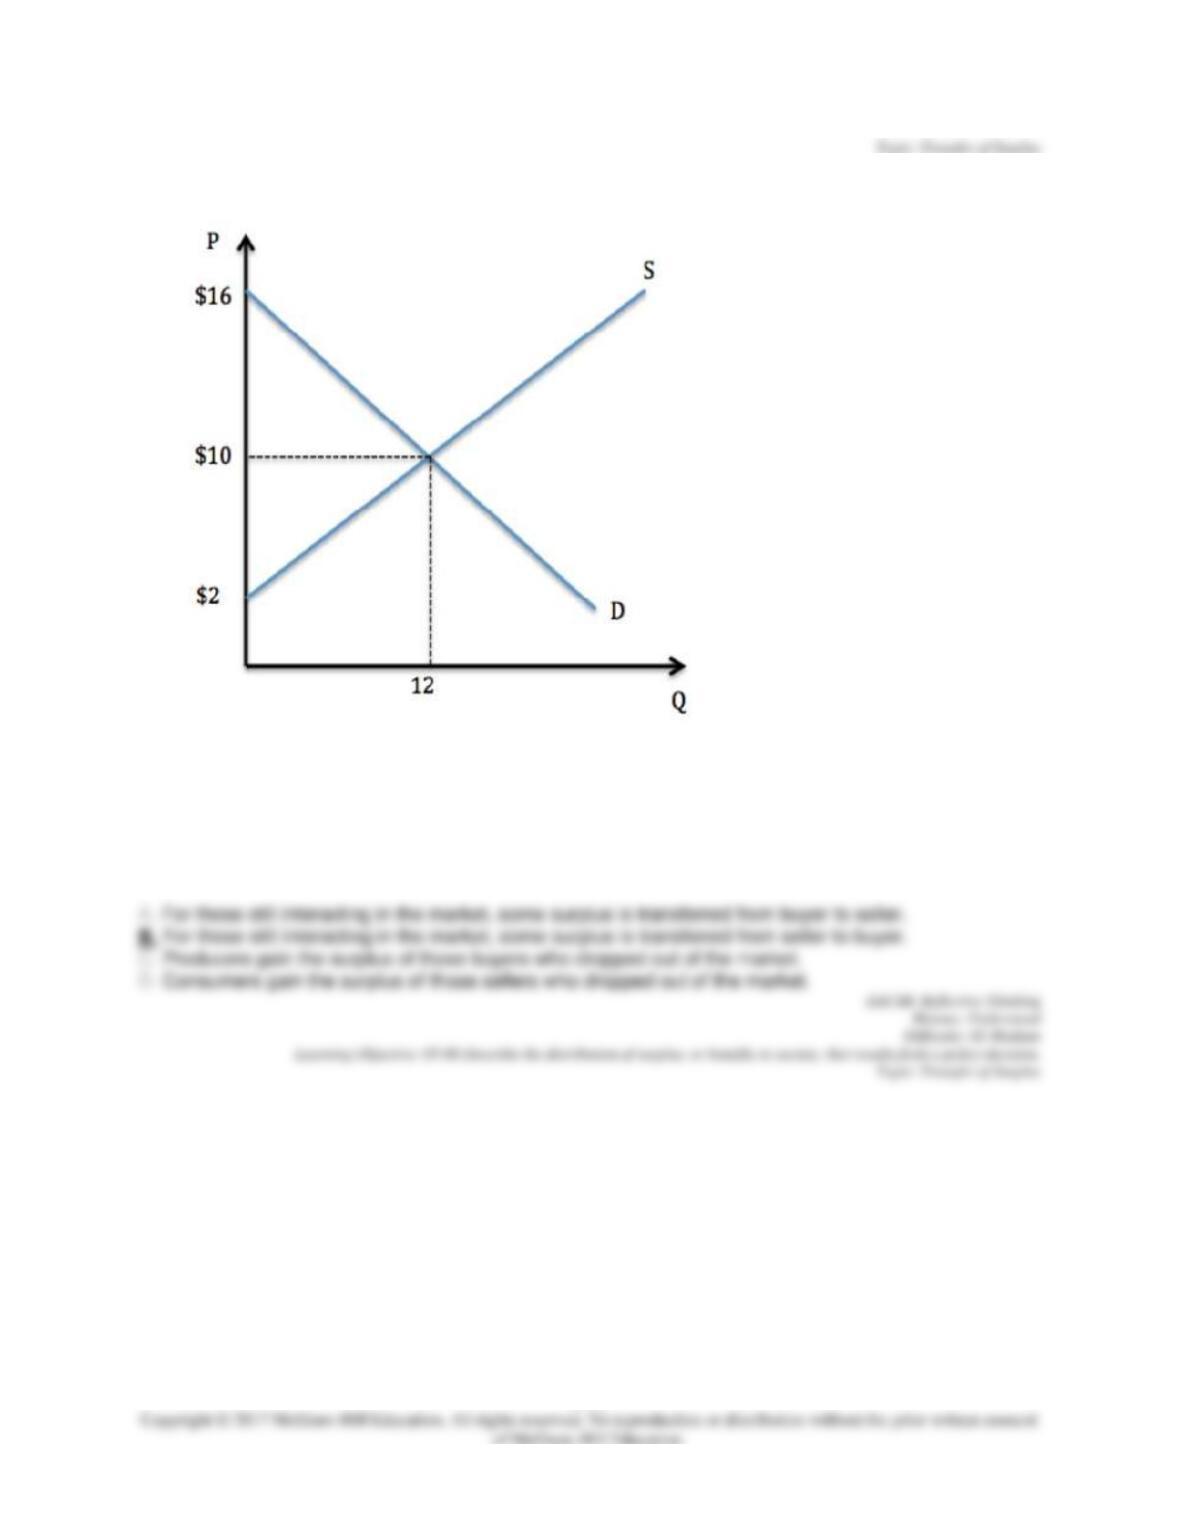
According to the graph shown, if the market goes from equilibrium to having its price set at $10 then: