5-21
52. Assume there are three hardware stores, each willing to sell one standard model hammer in a given
time period. House Depot can offer their hammer for a minimum of $7. Lace Hardware can offer the
hammer for a minimum of $10. Bob’s Hardware store can offer the hammer at a minimum price of $13.
Given the scenario described, if the market price of hammers increased from $9 to $13:
53. Assume there are three hardware stores, each willing to sell one standard model hammer in a given
time period. House Depot can offer their hammer for a minimum of $7. Lace Hardware can offer the
hammer for a minimum of $10. Bob’s Hardware store can offer the hammer at a minimum price of $13.
Given the scenario described, if the market price of hammers increased from $8 to $12, producer surplus
would:
5-22
54. Assume there are three hardware stores, each willing to sell one standard model hammer in a given
time period. House Depot can offer their hammer for a minimum of $7. Lace Hardware can offer the
hammer for a minimum of $10. Bob’s Hardware store can offer the hammer at a minimum price of $13.
Given the scenario described, if the market price of hammers increased from $9 to $12, total producer
surplus would increase by:
55. Assume there are three hardware stores, each willing to sell one standard model hammer in a given
time period. House Depot can offer their hammer for a minimum of $7. Lace Hardware can offer the
hammer for a minimum of $10. Bob’s Hardware store can offer the hammer at a minimum price of $13.
Given the scenario described, if the market price of hammers increased from $8 to $14, total producer
surplus would:
56. Assume there are three hardware stores, each willing to sell one standard model hammer in a given
time period. House Depot can offer their hammer for a minimum of $7. Lace Hardware can offer the
hammer for a minimum of $10. Bob’s Hardware store can offer the hammer at a minimum price of $13.
Given the scenario described, if the market price of hammers increased from $9 to $13:
57.
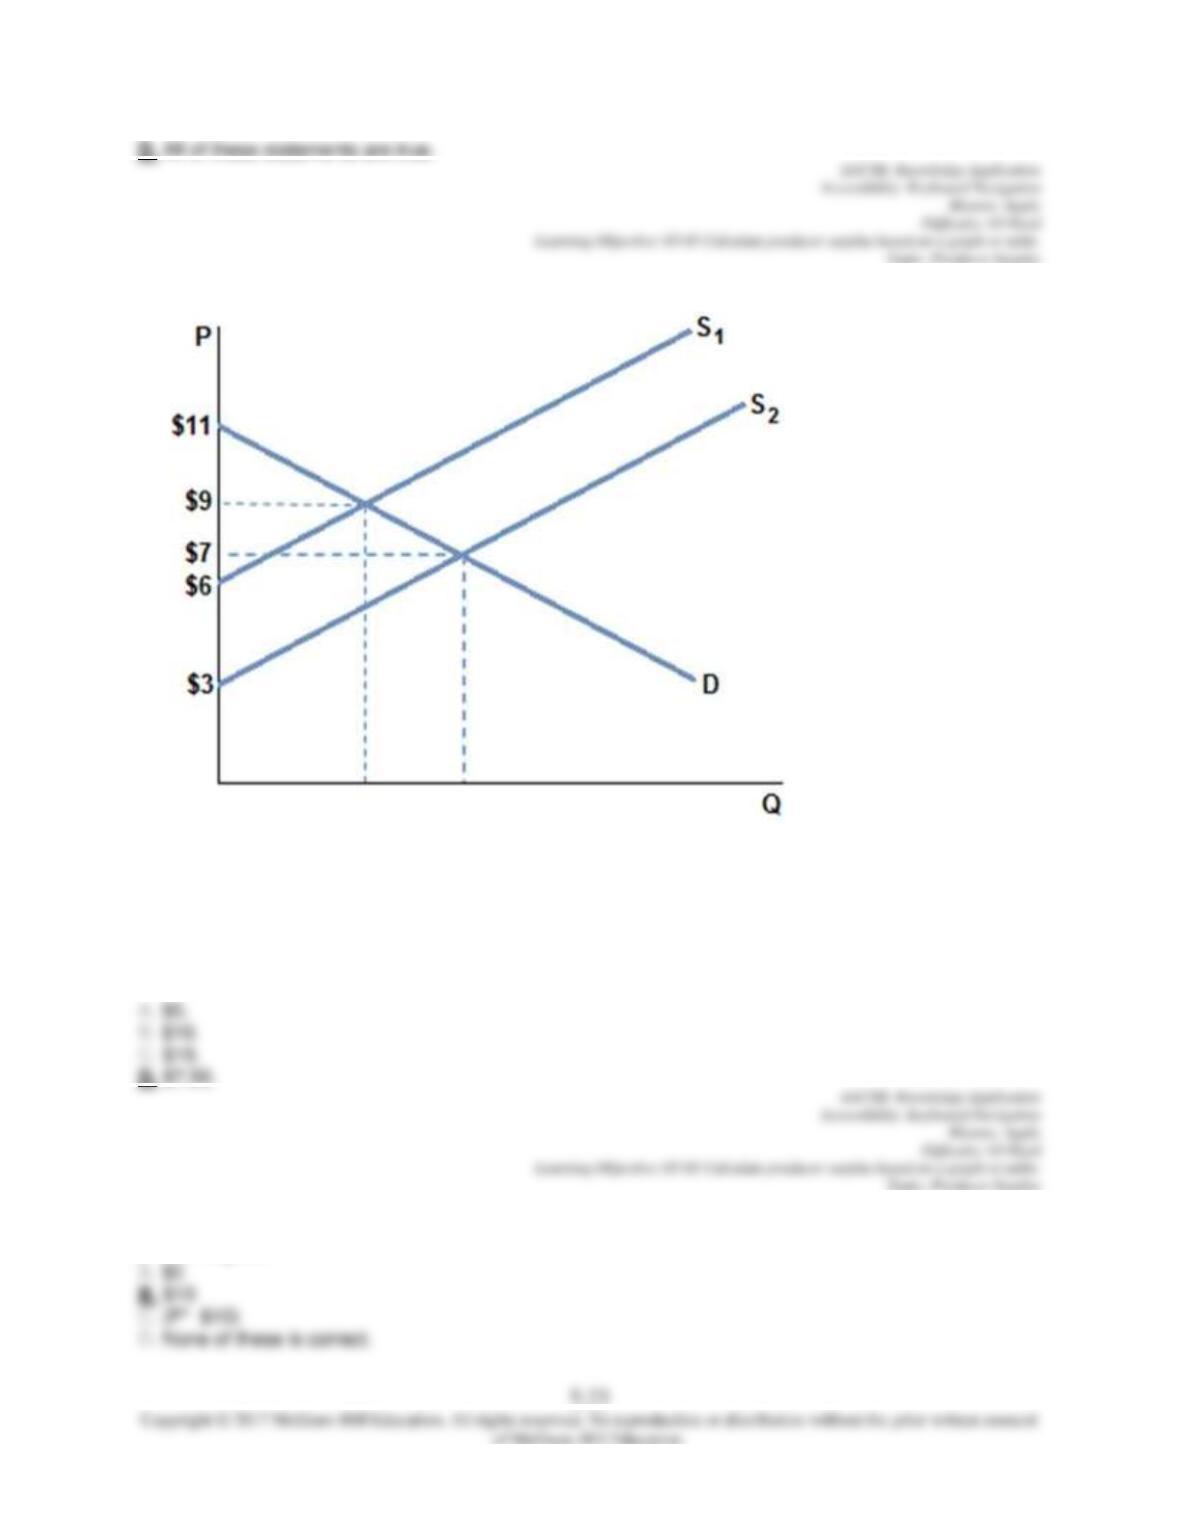
Assume the market in the graph shown with demand D and supply S1 is in equilibrium at a quantity of 5
units. Producer surplus is:
58. What is the producer surplus earned by a seller whose willingness to sell is $10 below the market
price of a good?
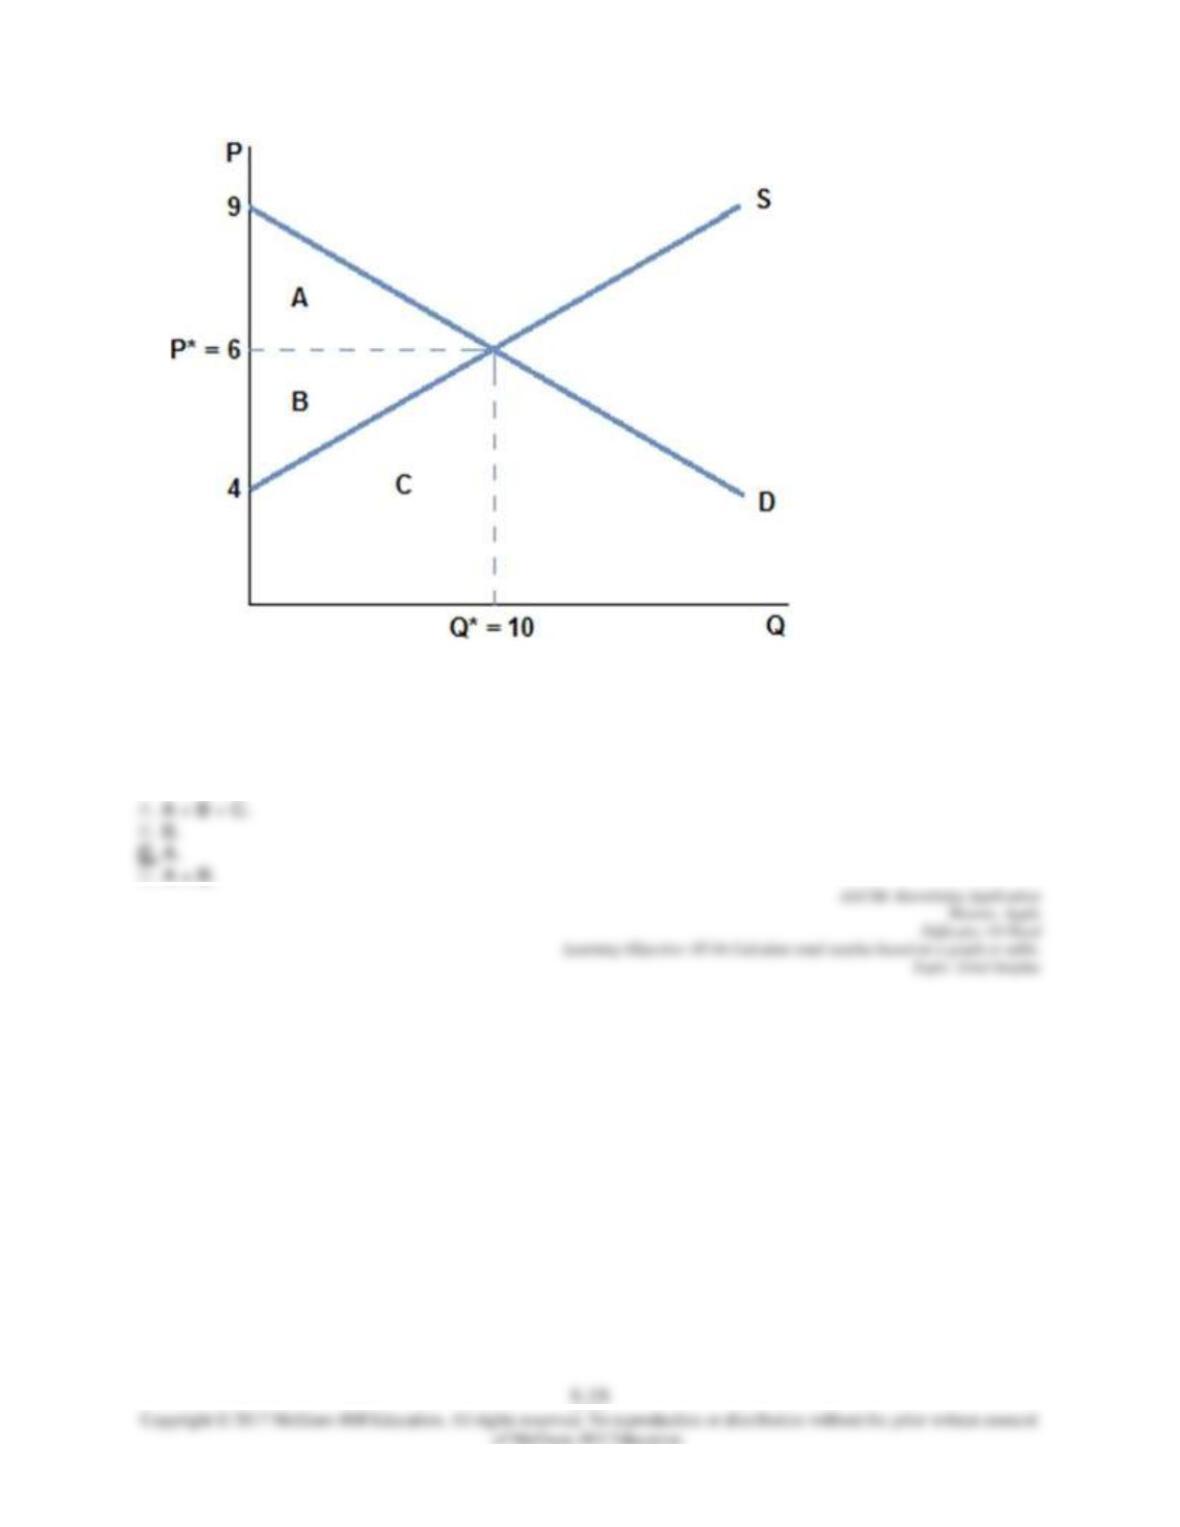
59.
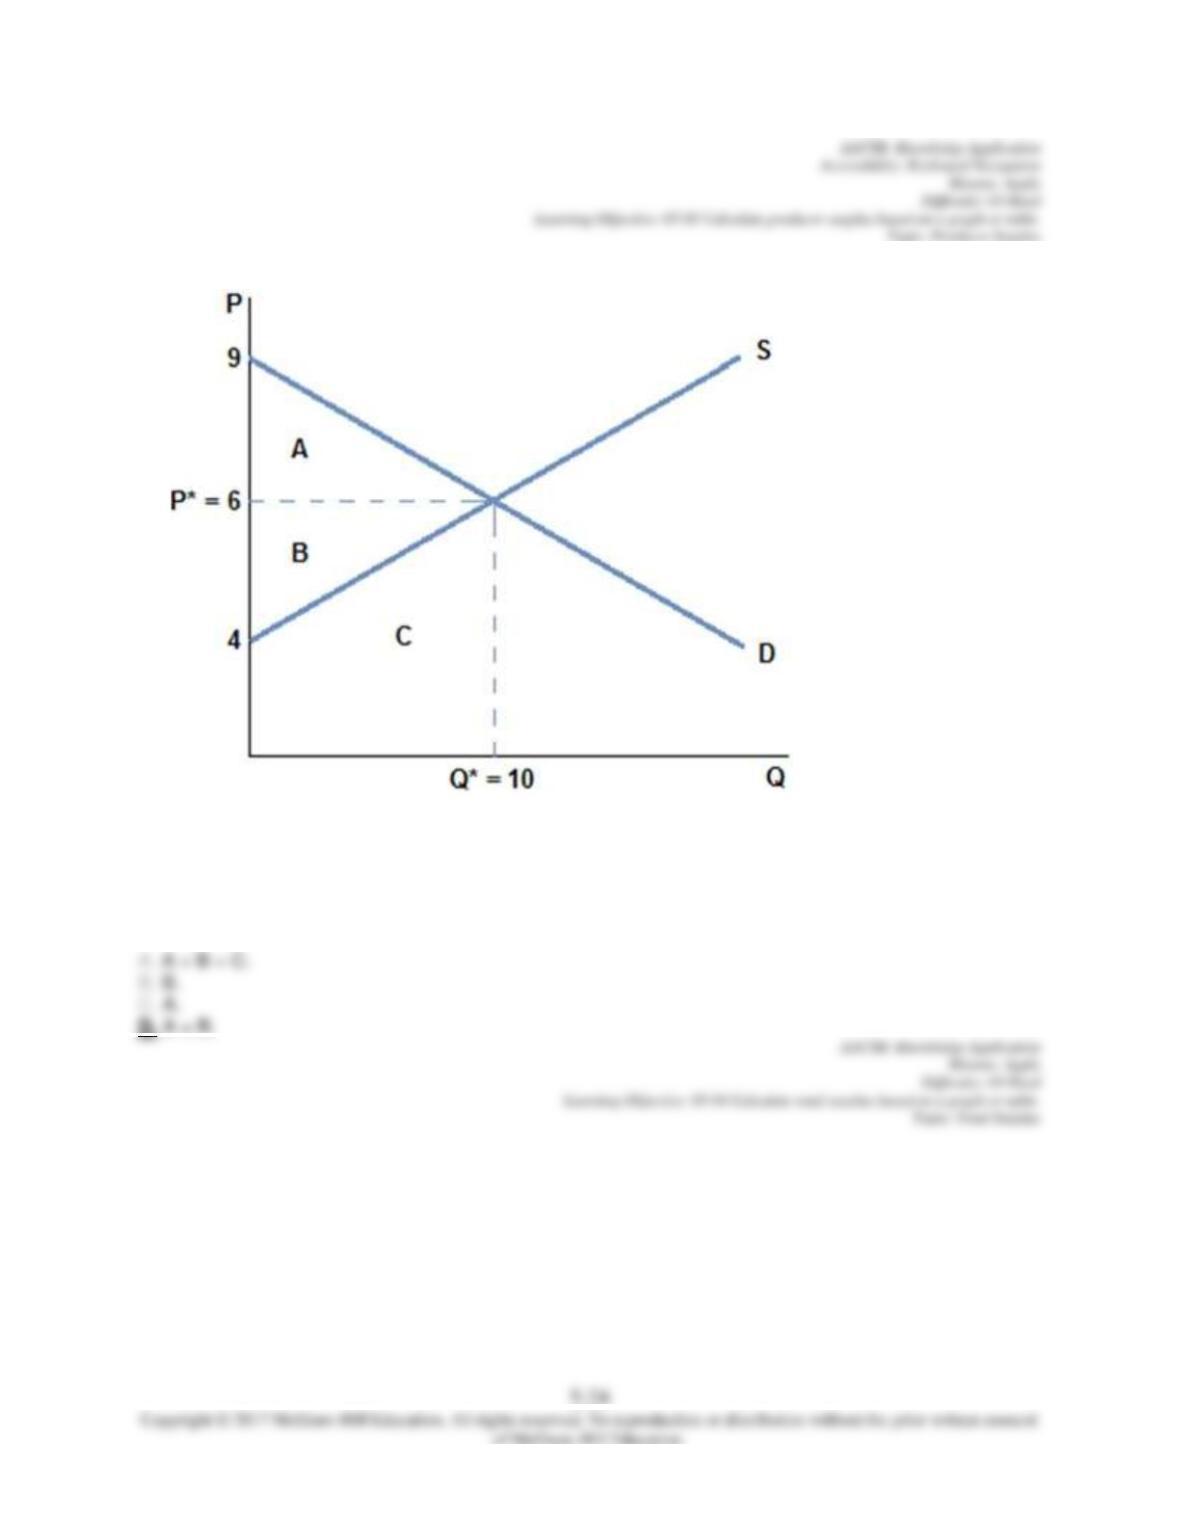
According to the graph shown, total surplus is area:
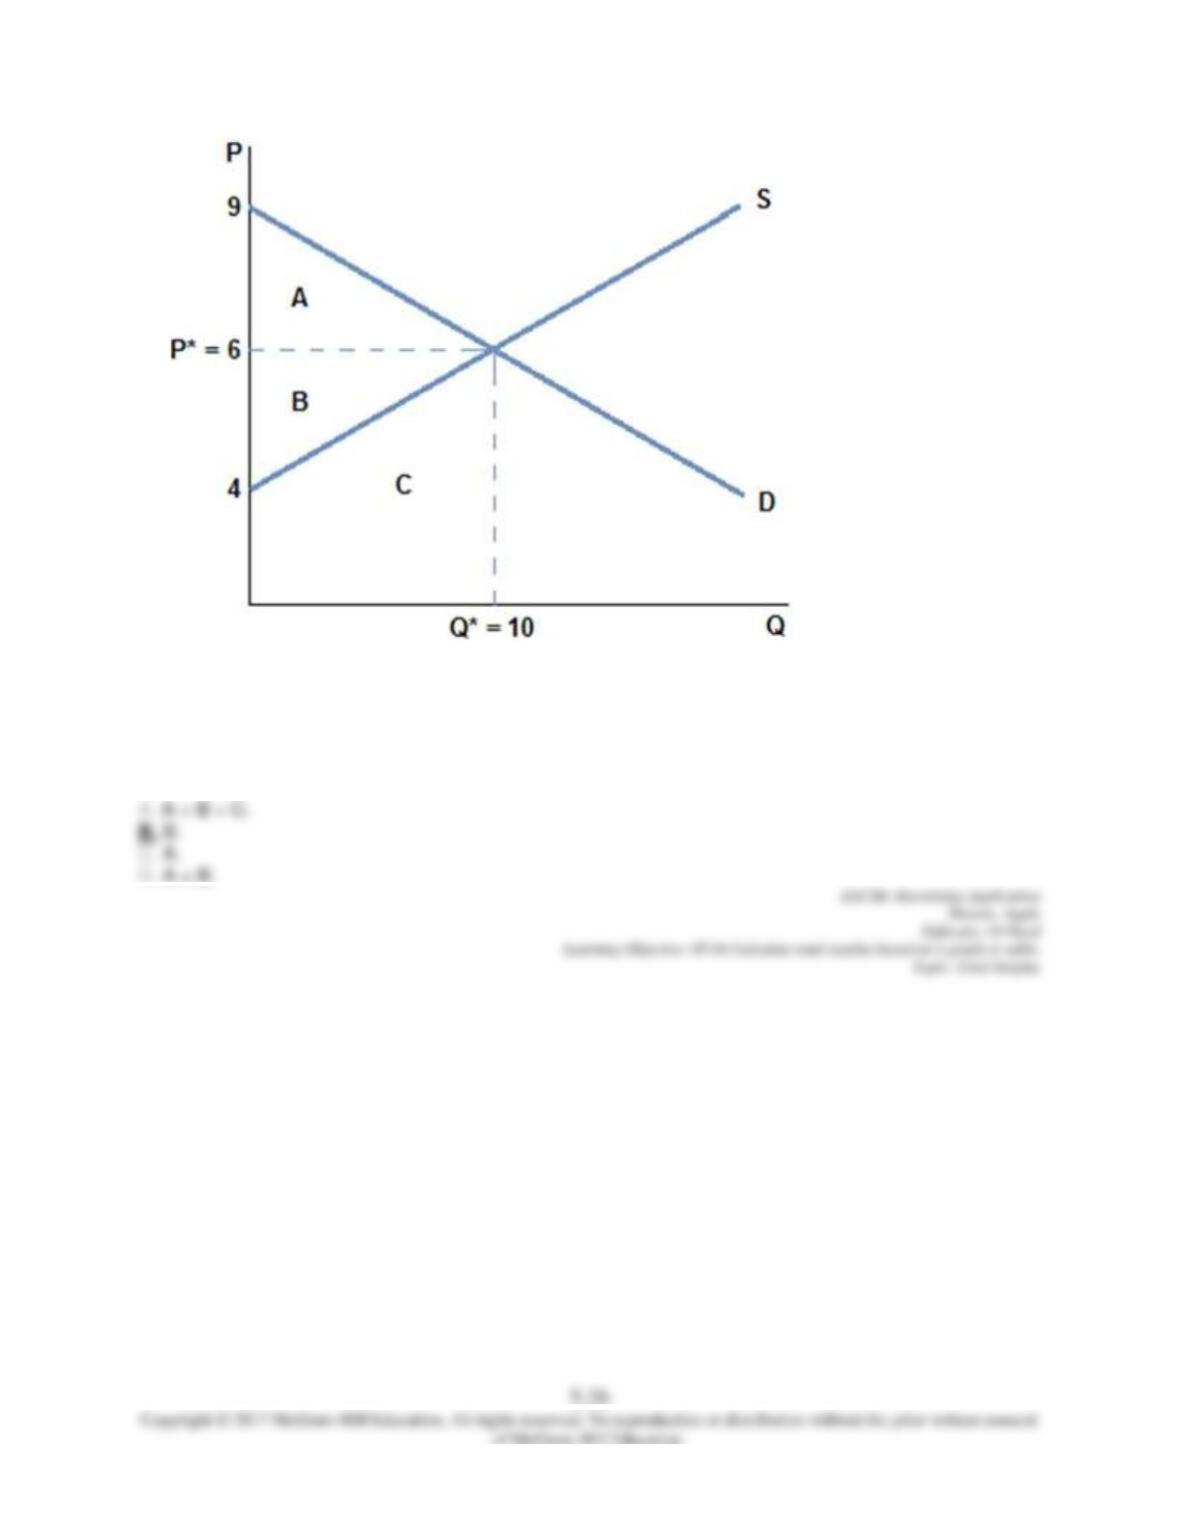
60.
According to the graph shown, consumer surplus is area:
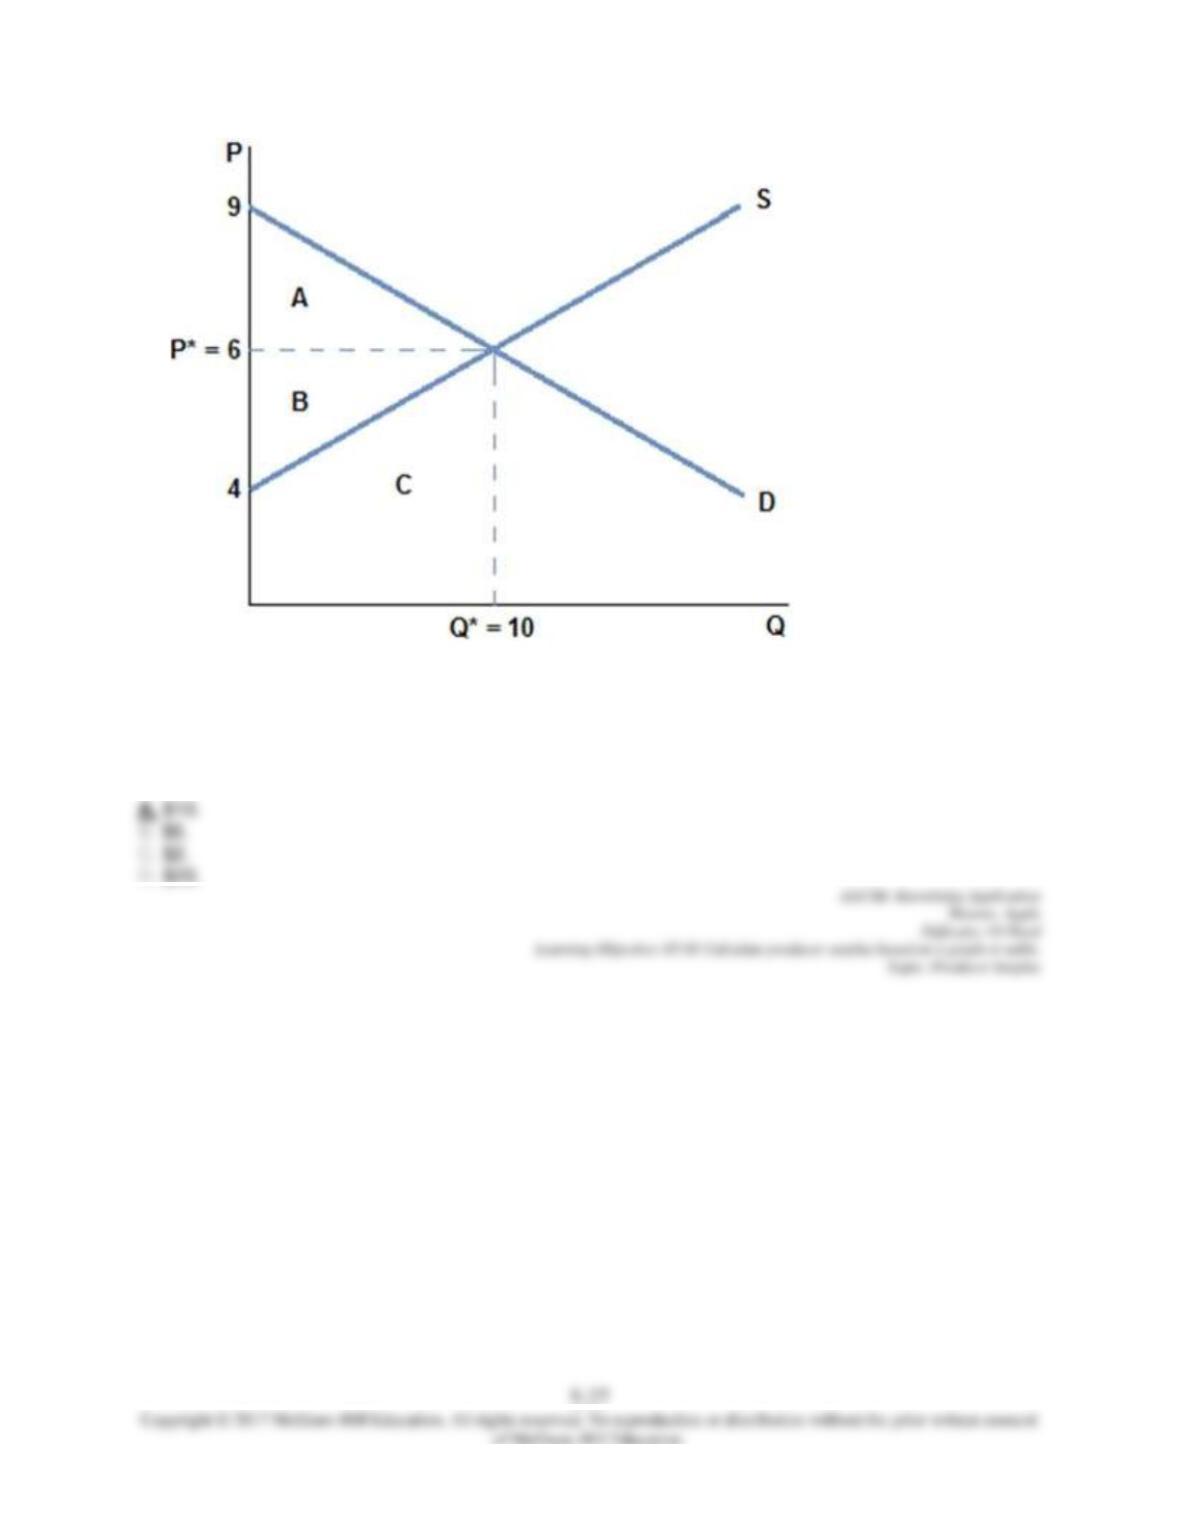
61.
According to the graph shown, producer surplus is area:
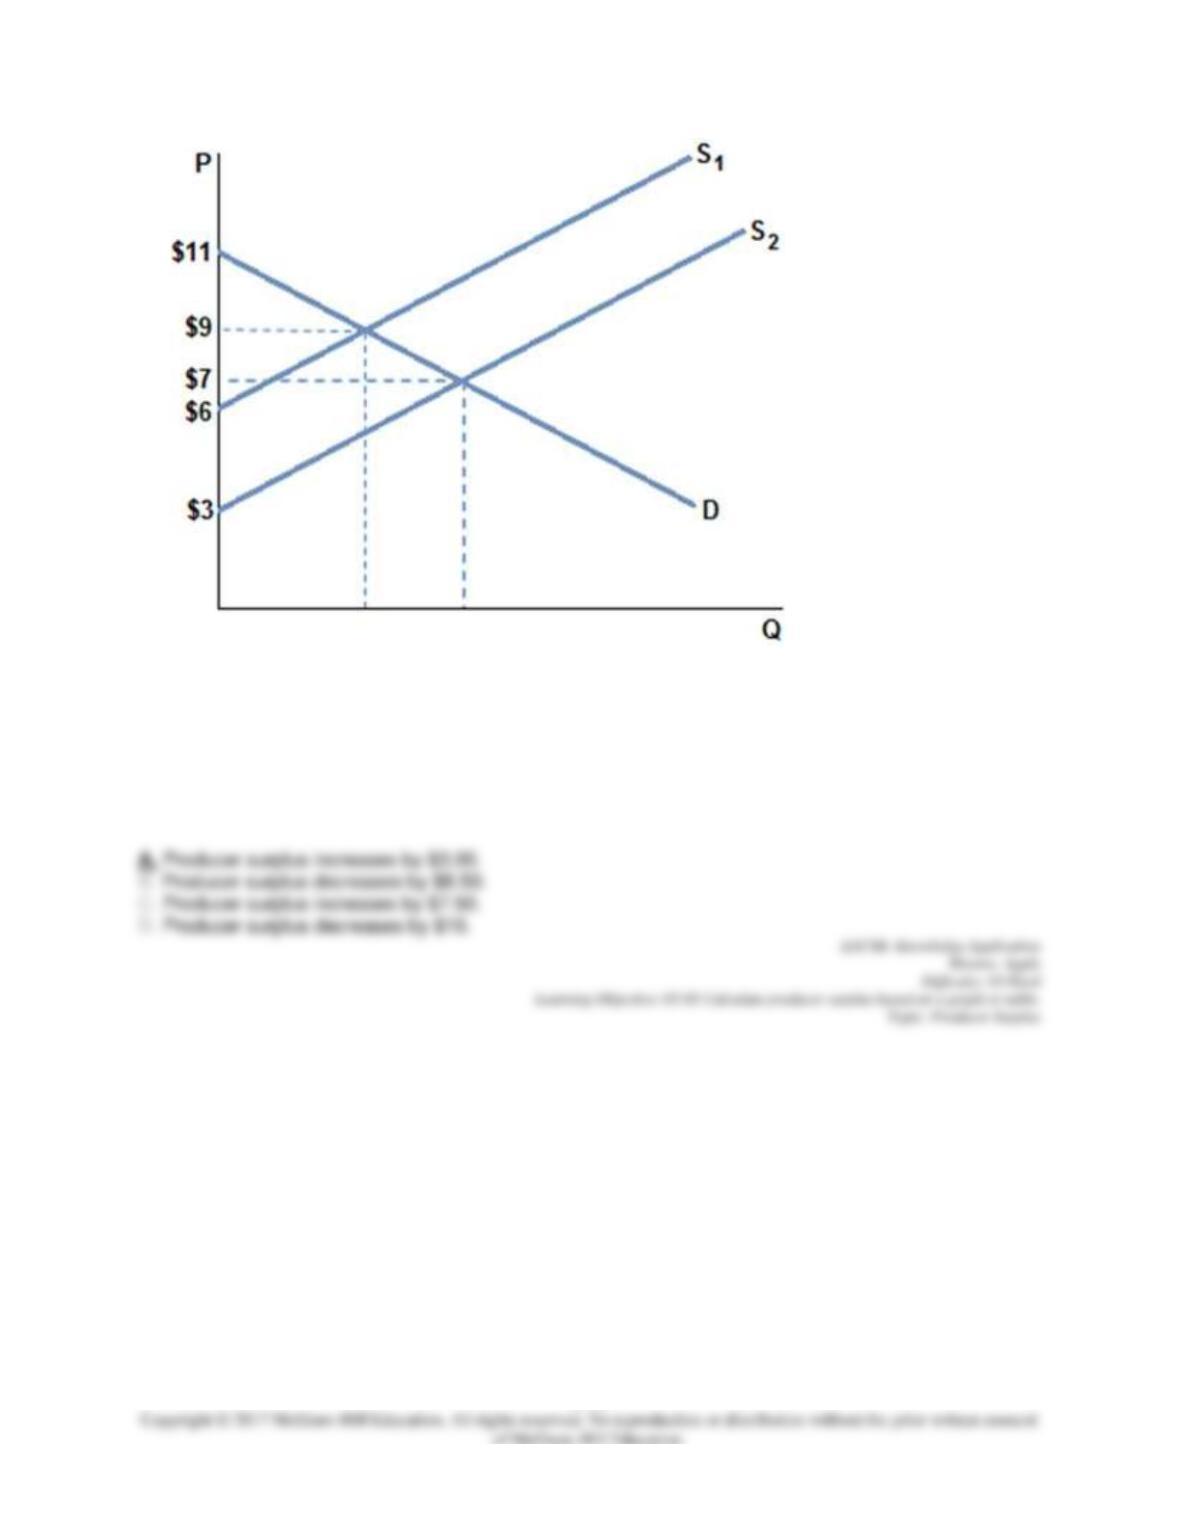
62.
According to the graph shown, producer surplus is:
5-28
63.
Assume the market is in equilibrium in the graph shown at demand D and supply S1. If the supply curve
shifts to S2, and a new equilibrium is reached, equilibrium quantity will increase from 4 to 4.5 units. Which
of the following is true?
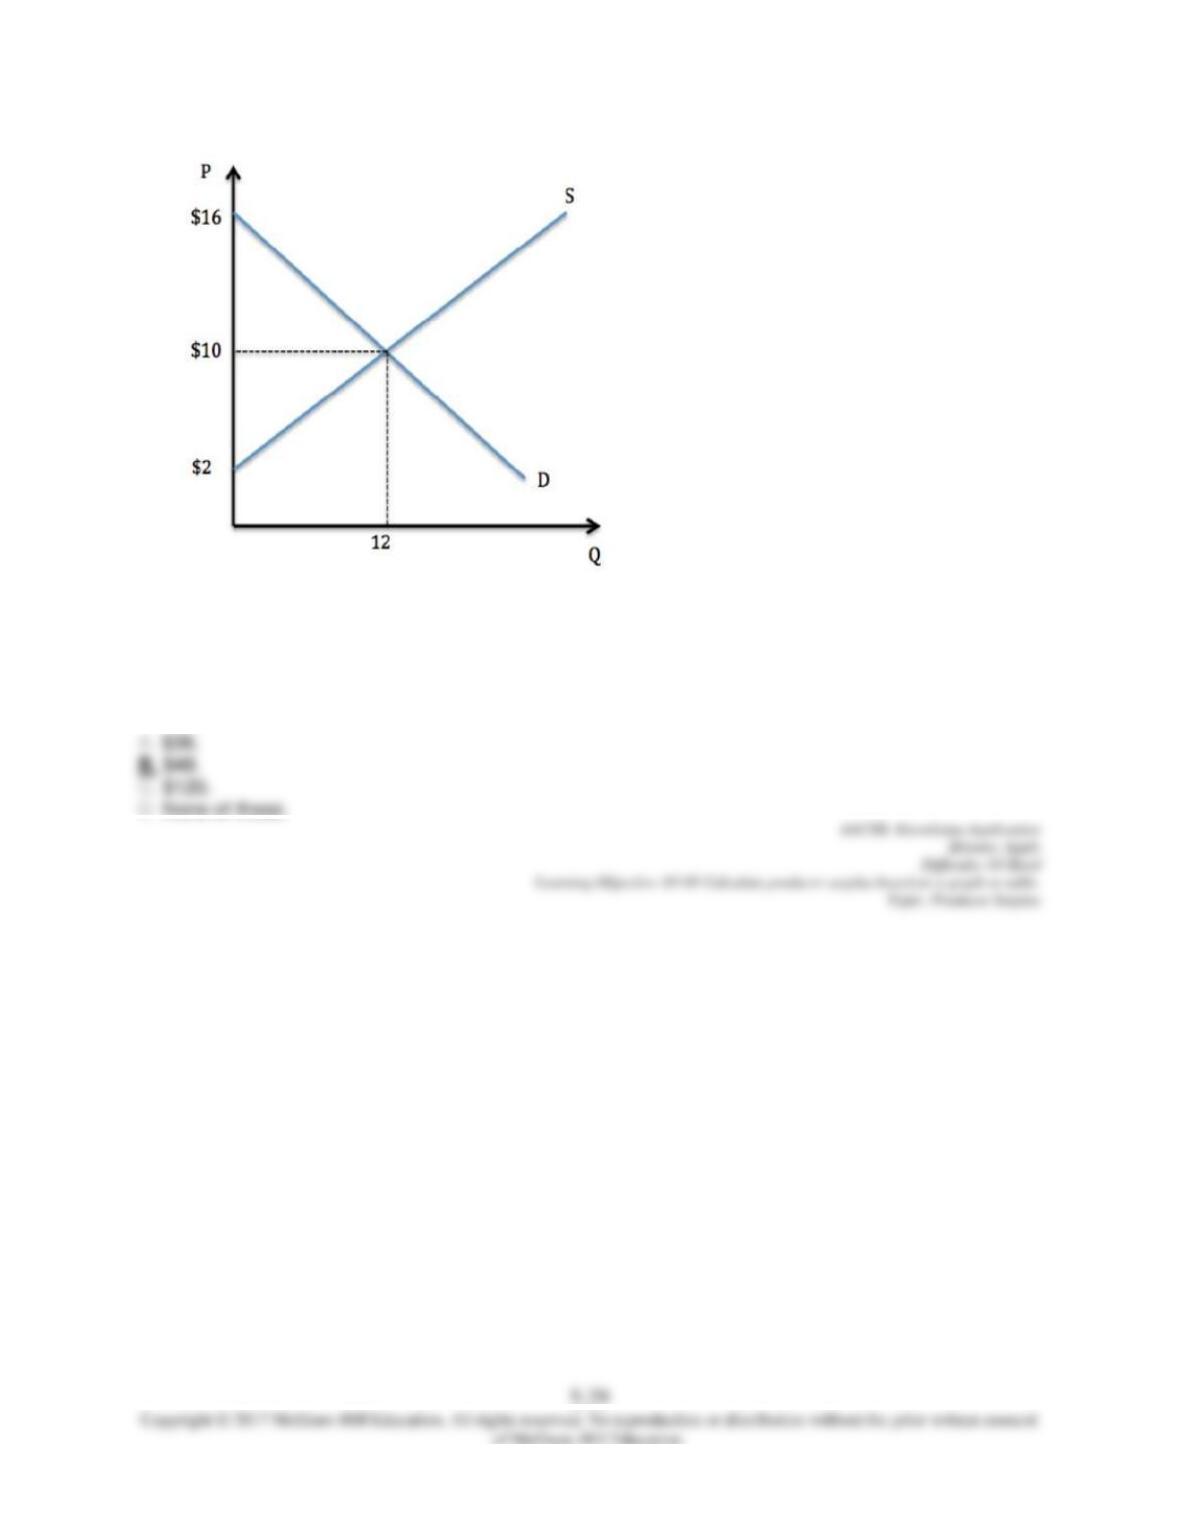
64.
According to the graph shown, producer surplus is:
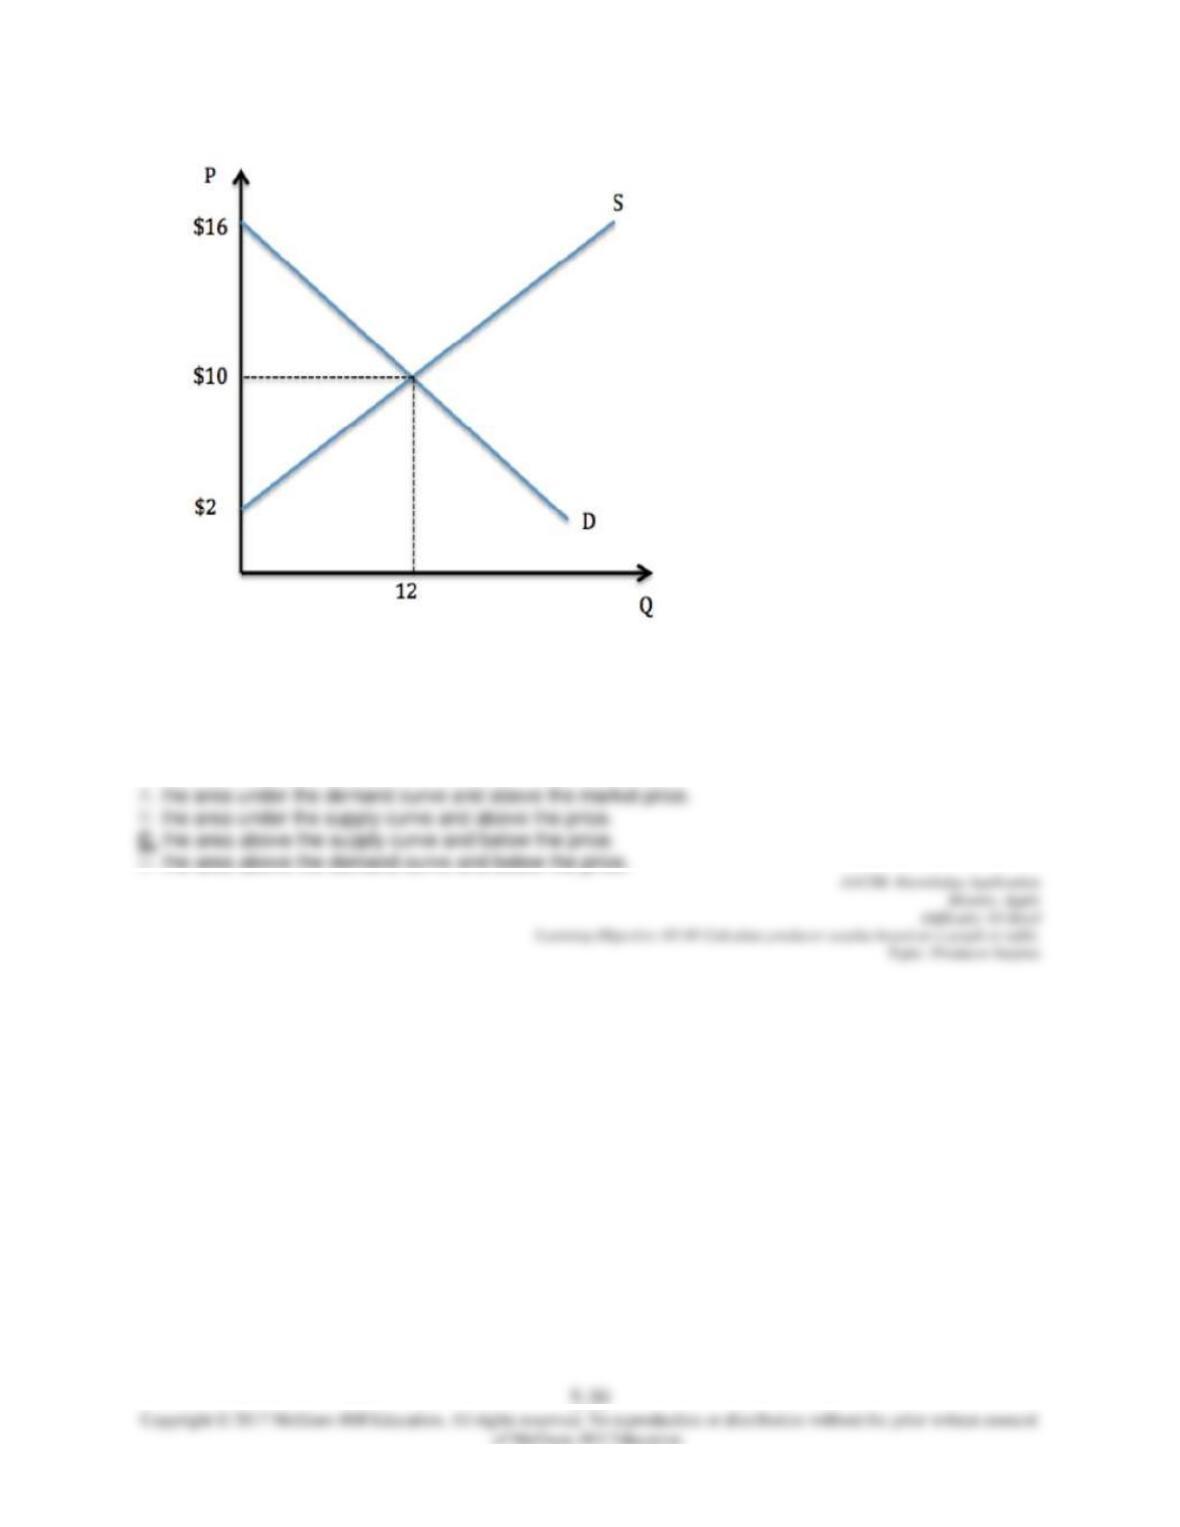
65.
According to the graph shown, producer surplus is:
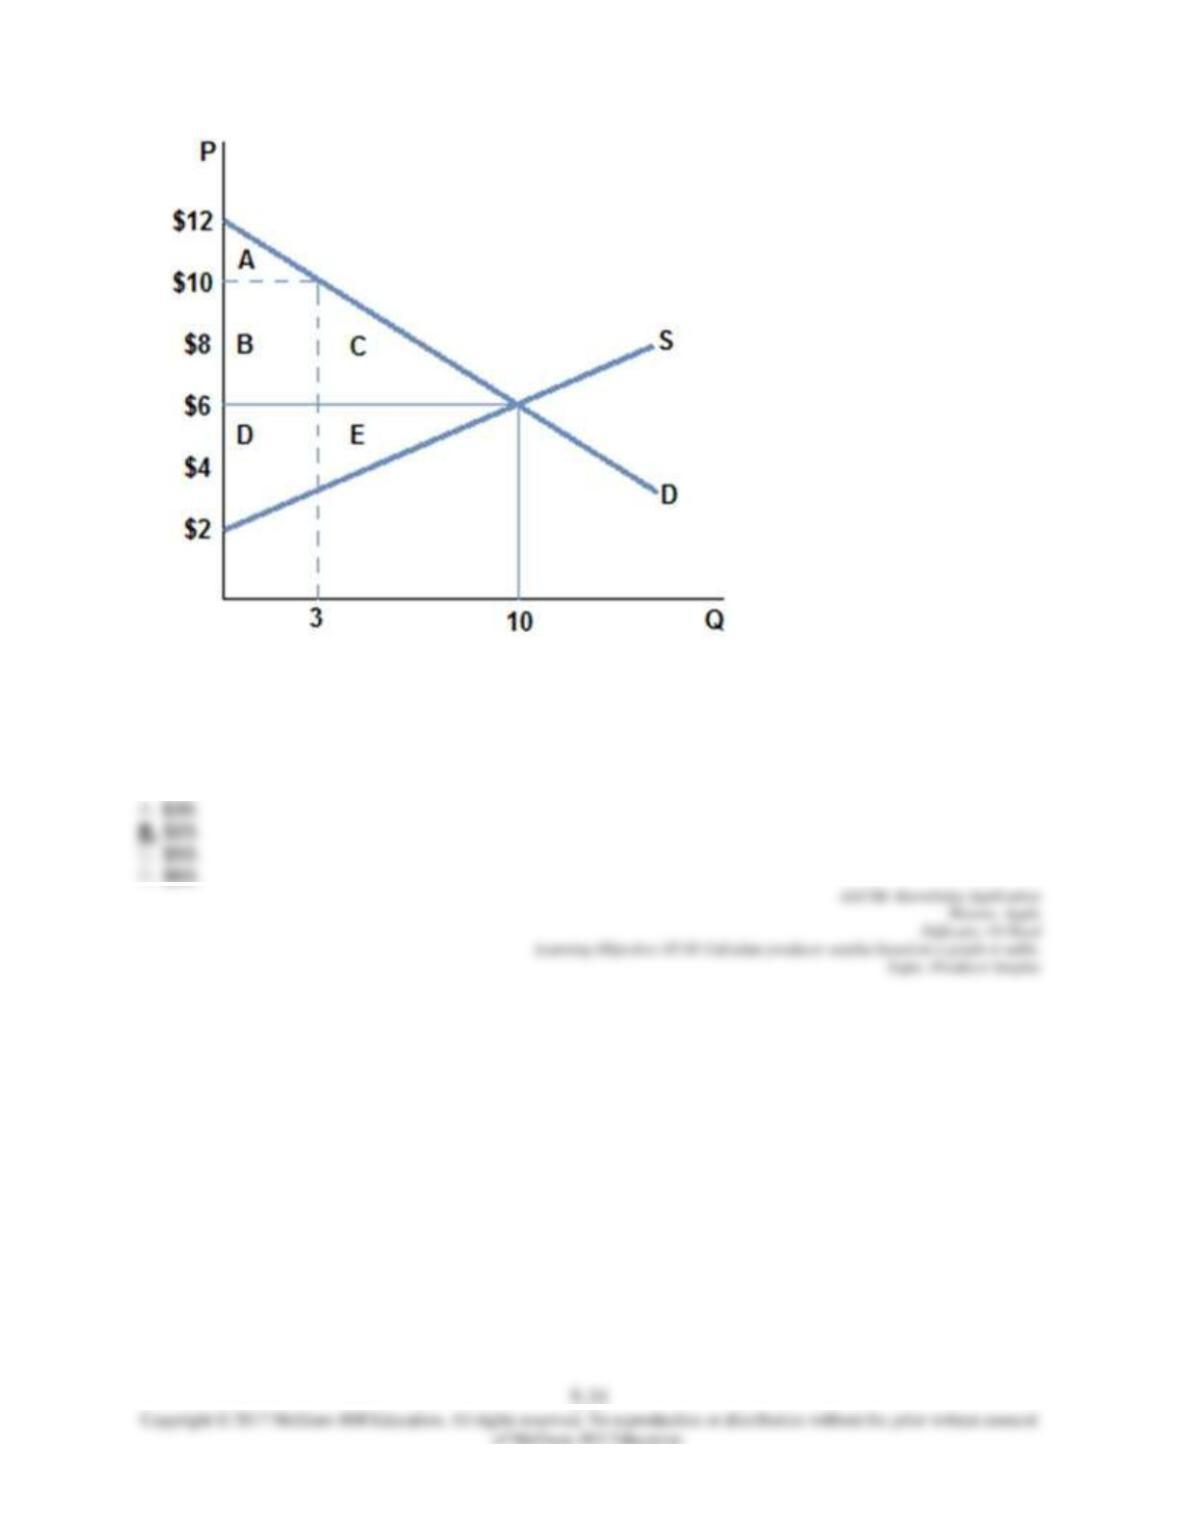
66.
According to the graph shown, if the market is in equilibrium, producer surplus is:
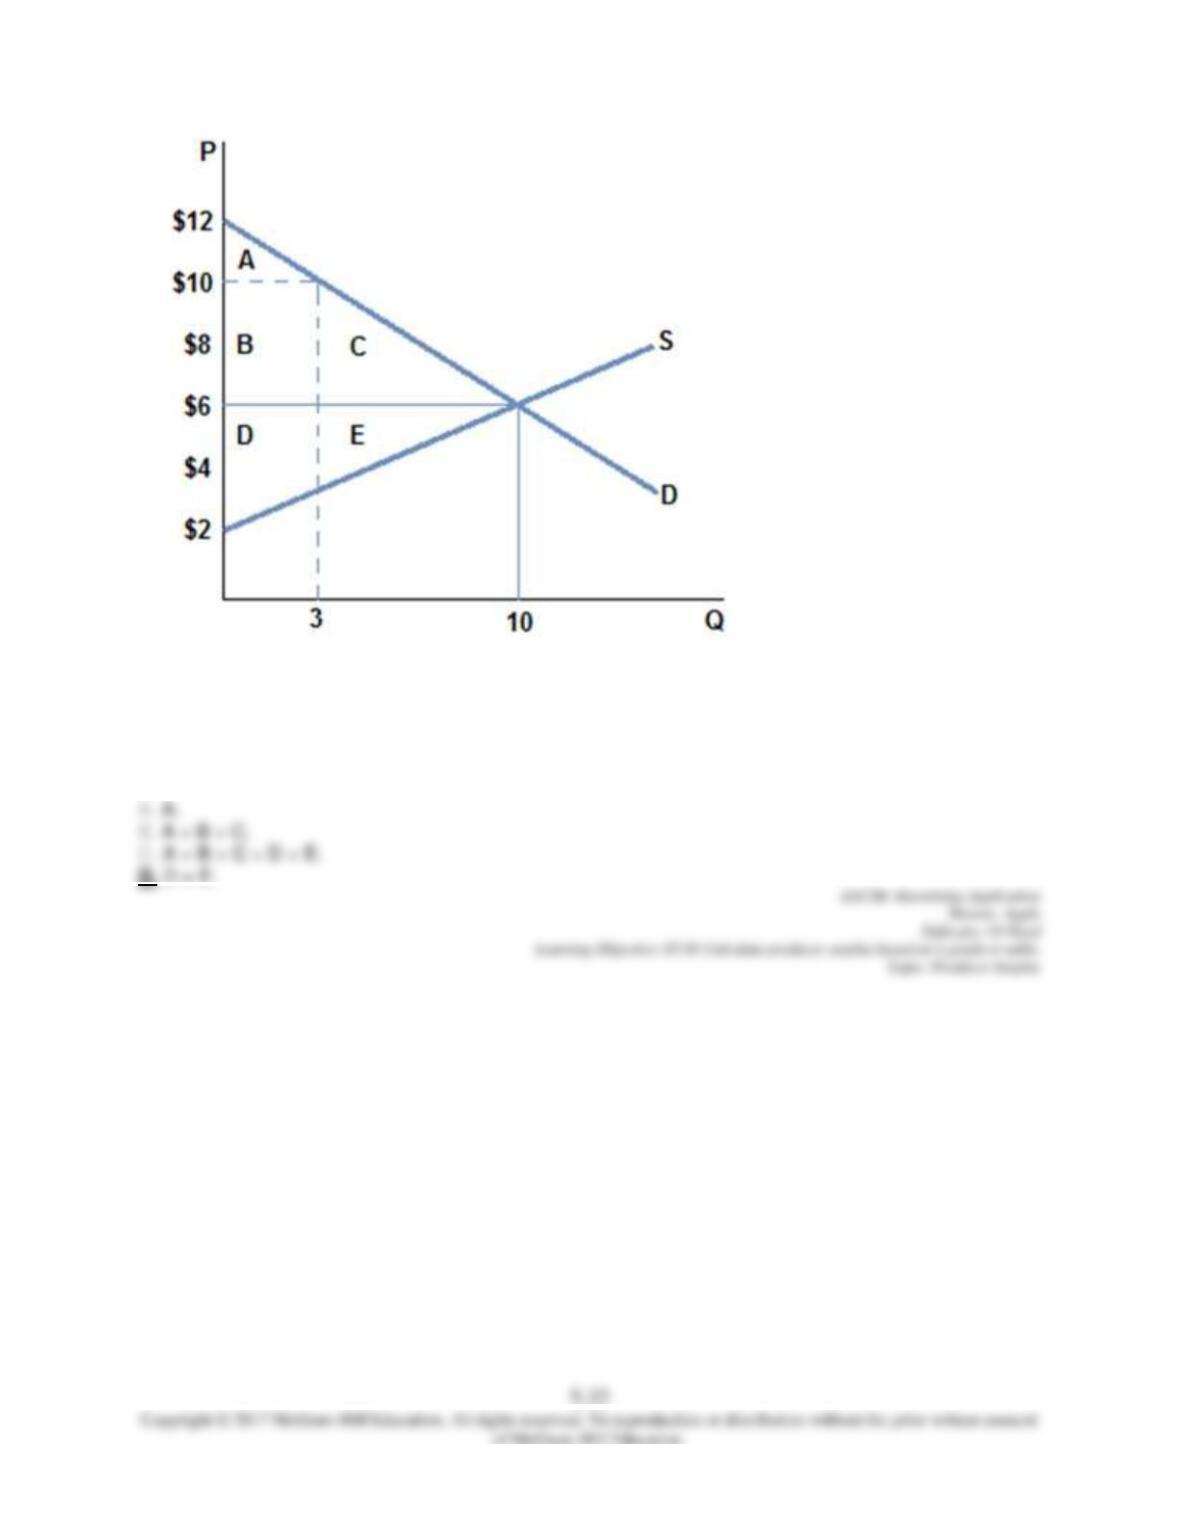
67.
According to the graph shown, if the market is in equilibrium, producer surplus is area:
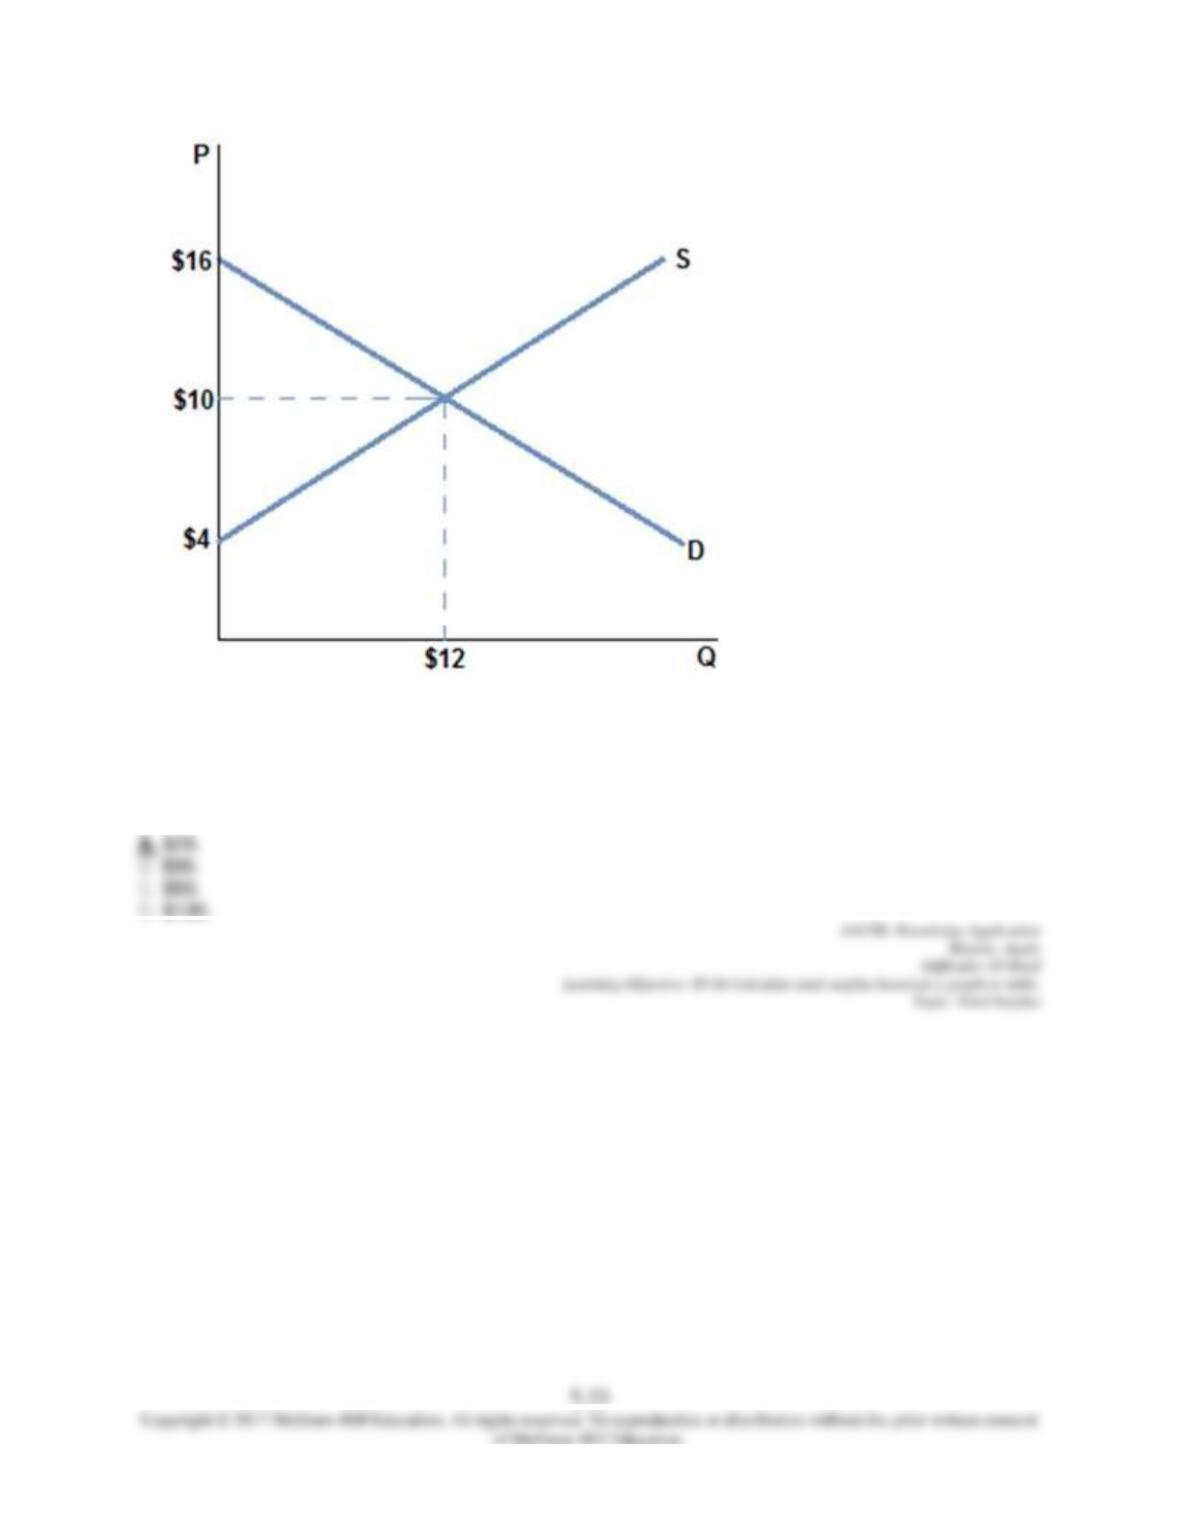
68.
According to the graph shown, total surplus is:
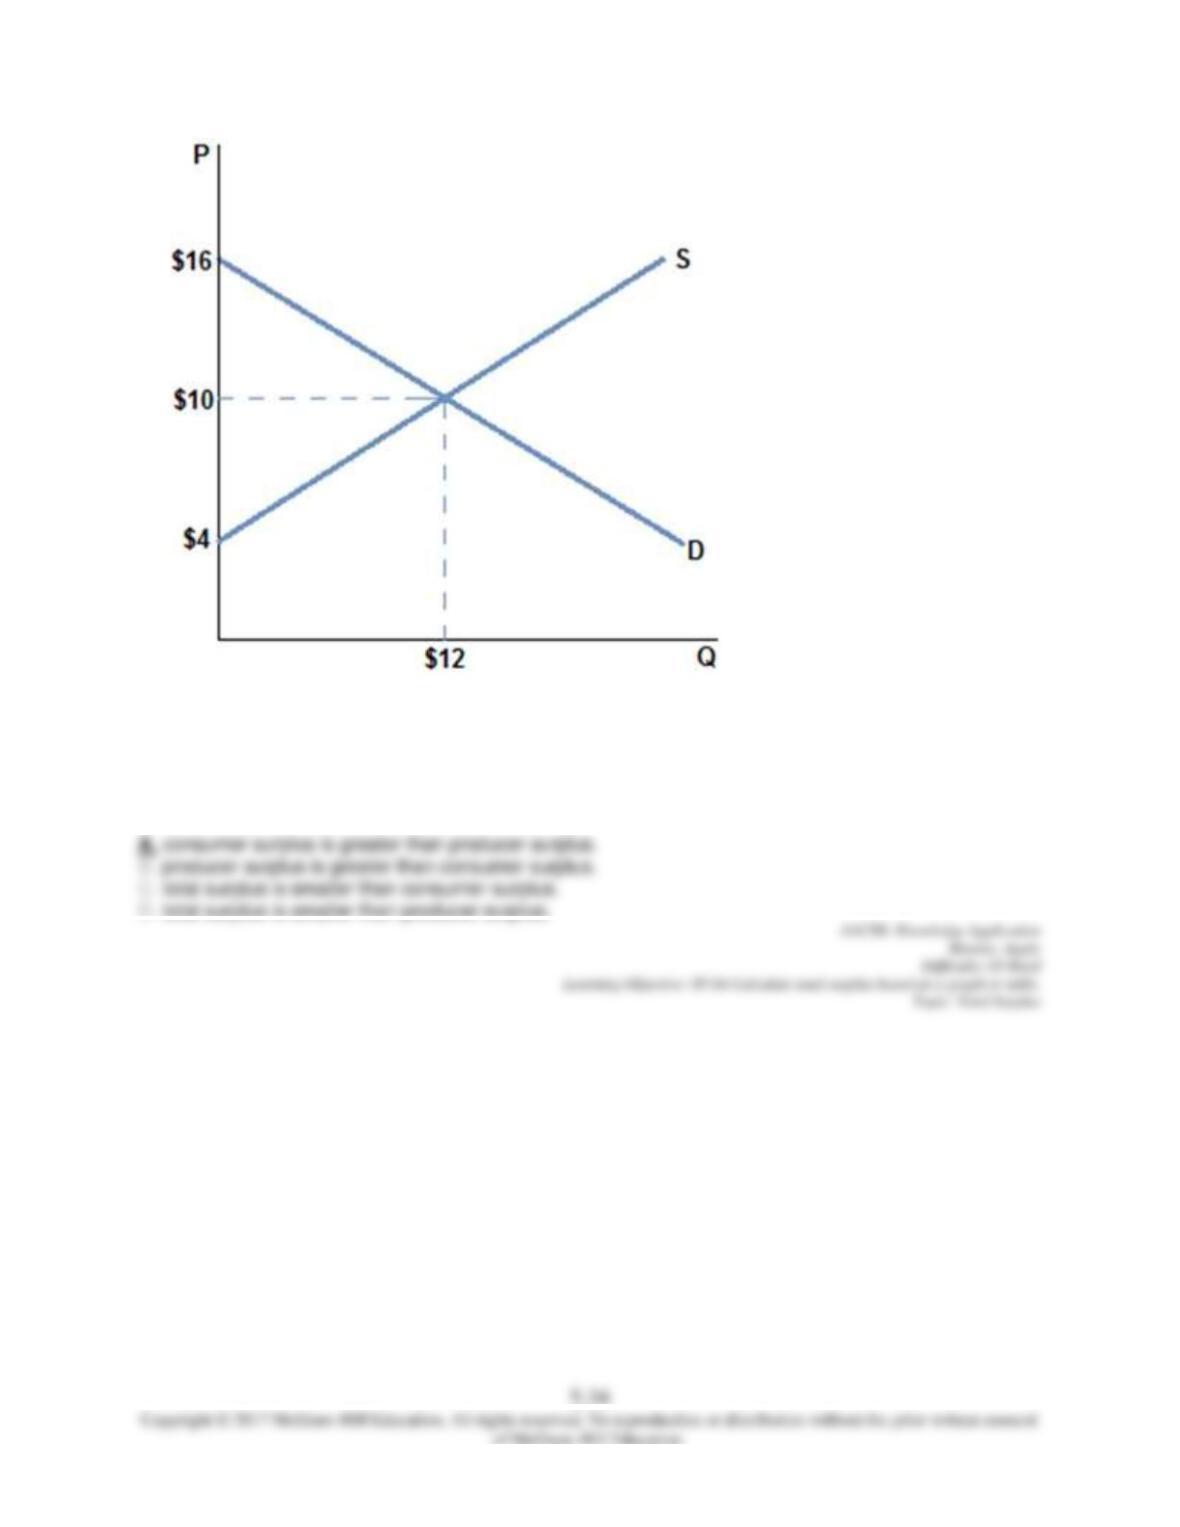
69.
According to the graph shown:
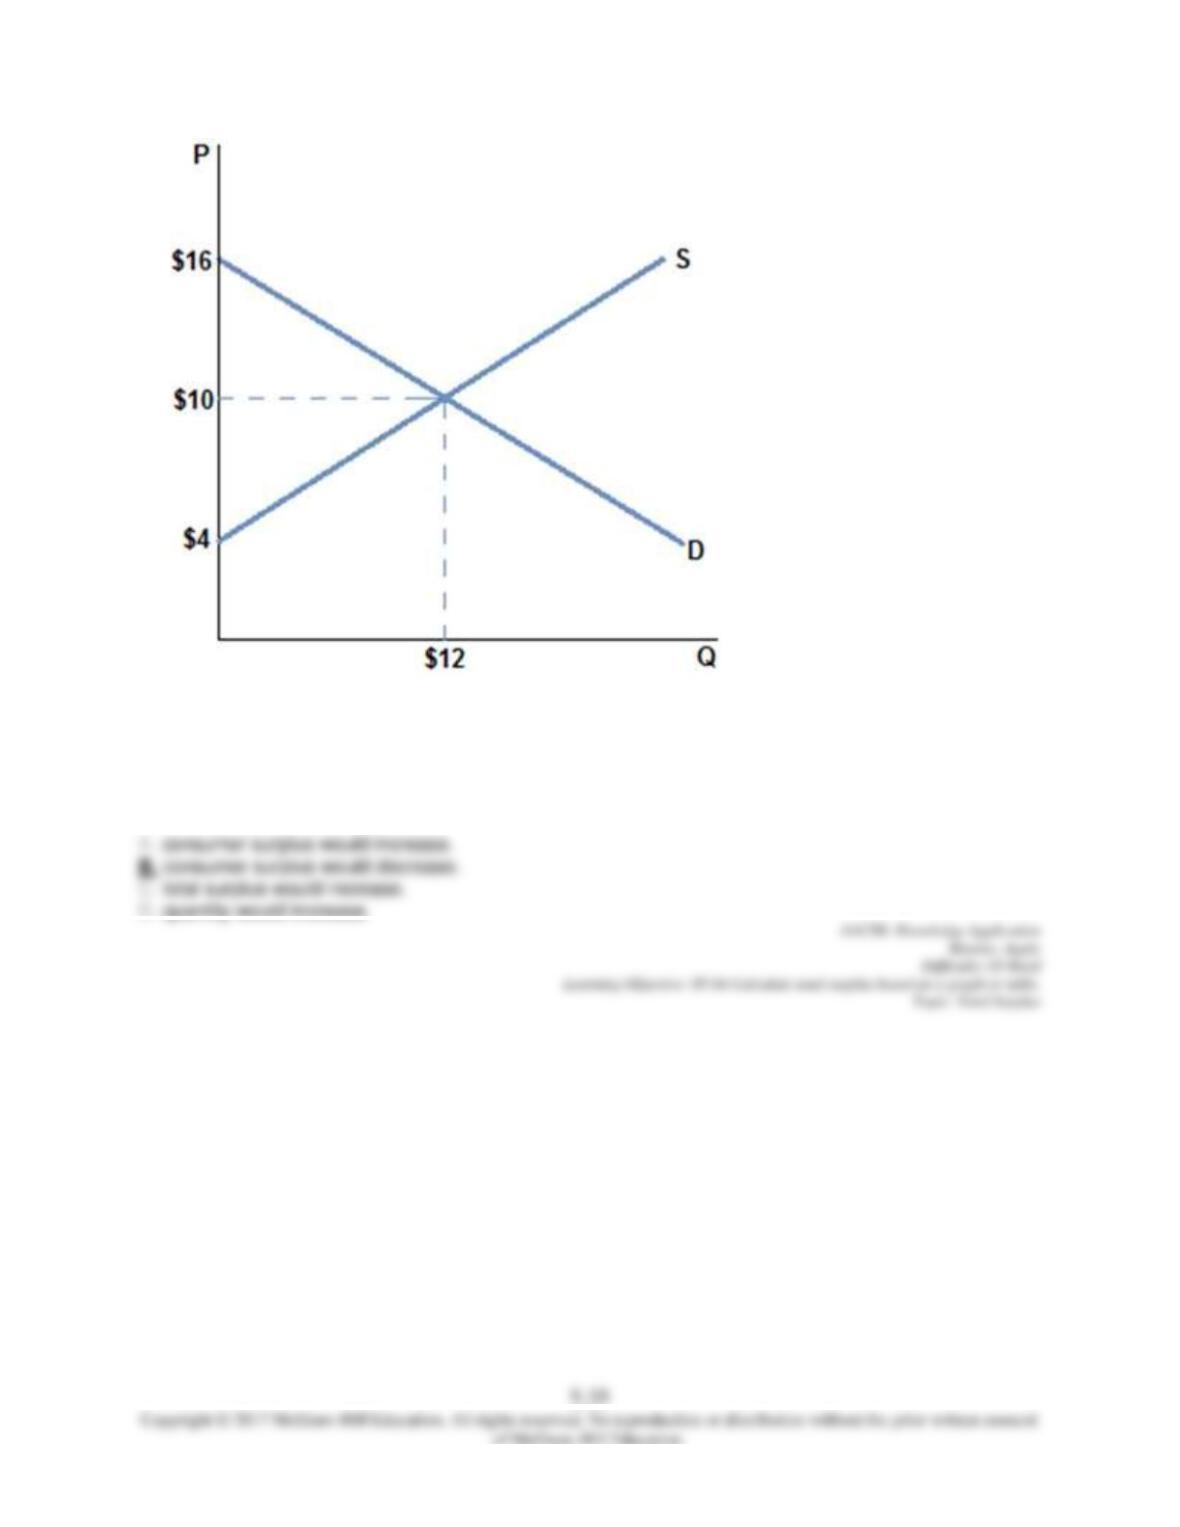
70.
According to the graph shown, if the supply increases, then
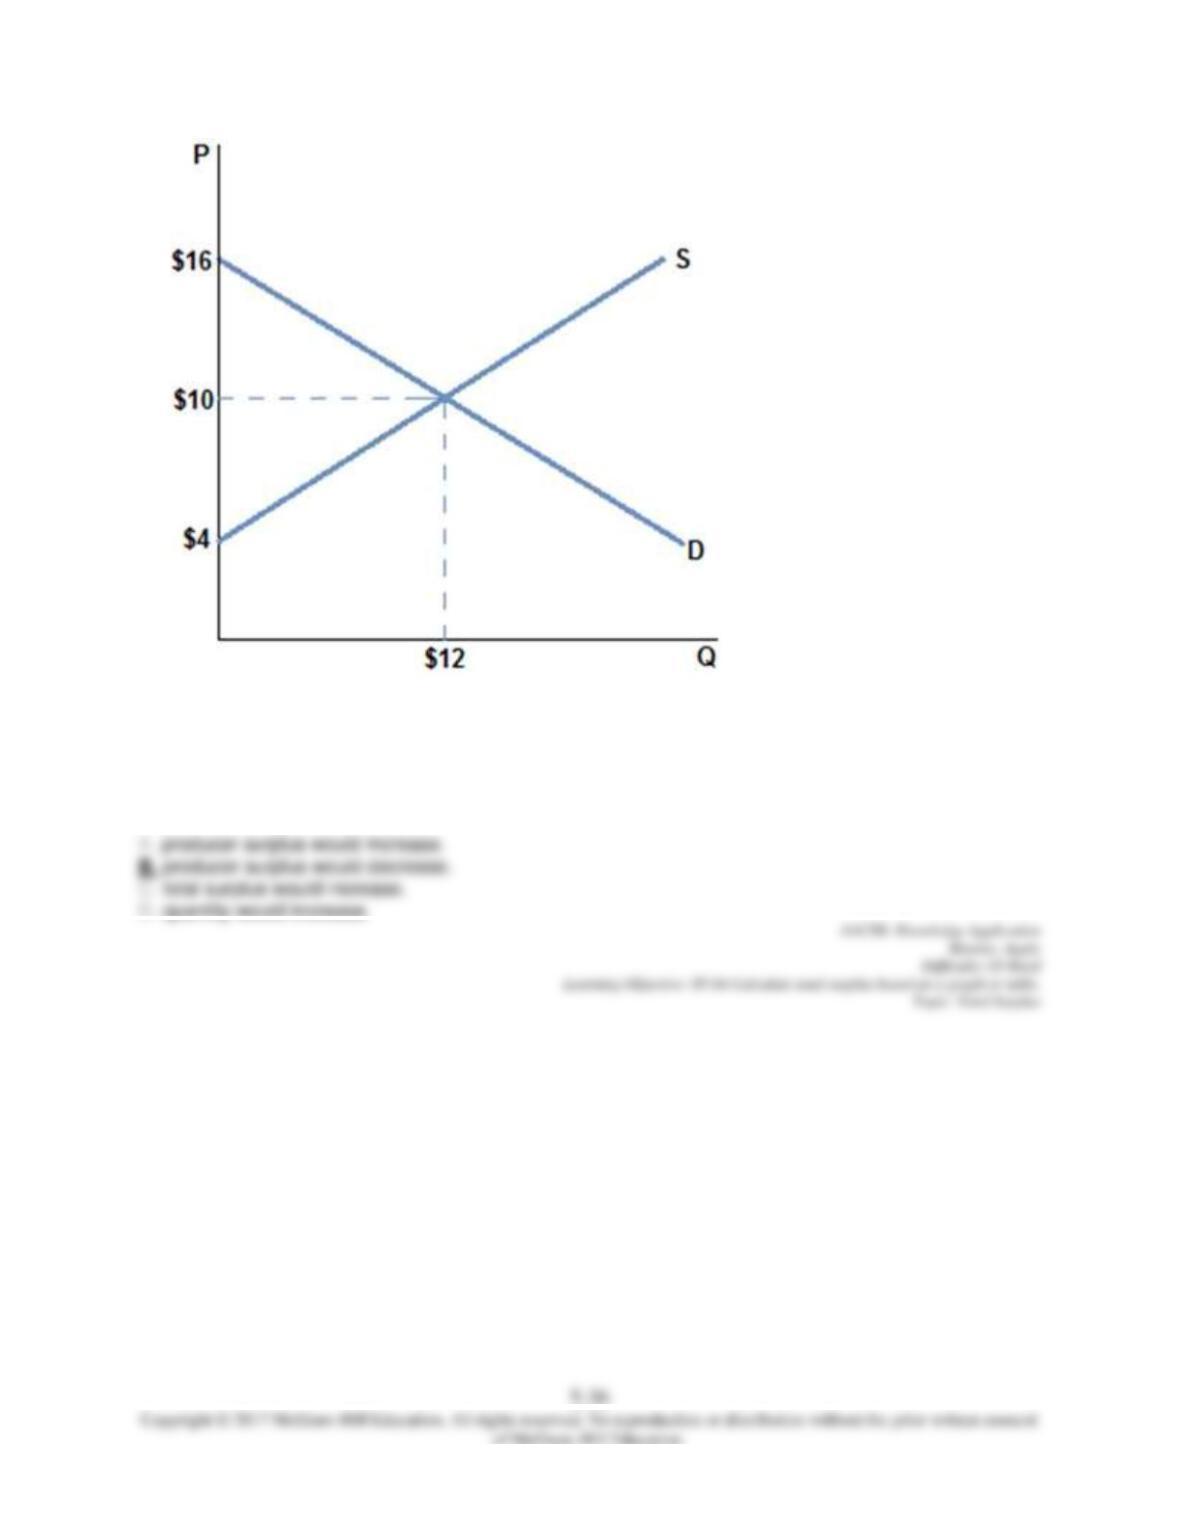
71.
According to the graph shown, if the market price decreases (all else staying the same):
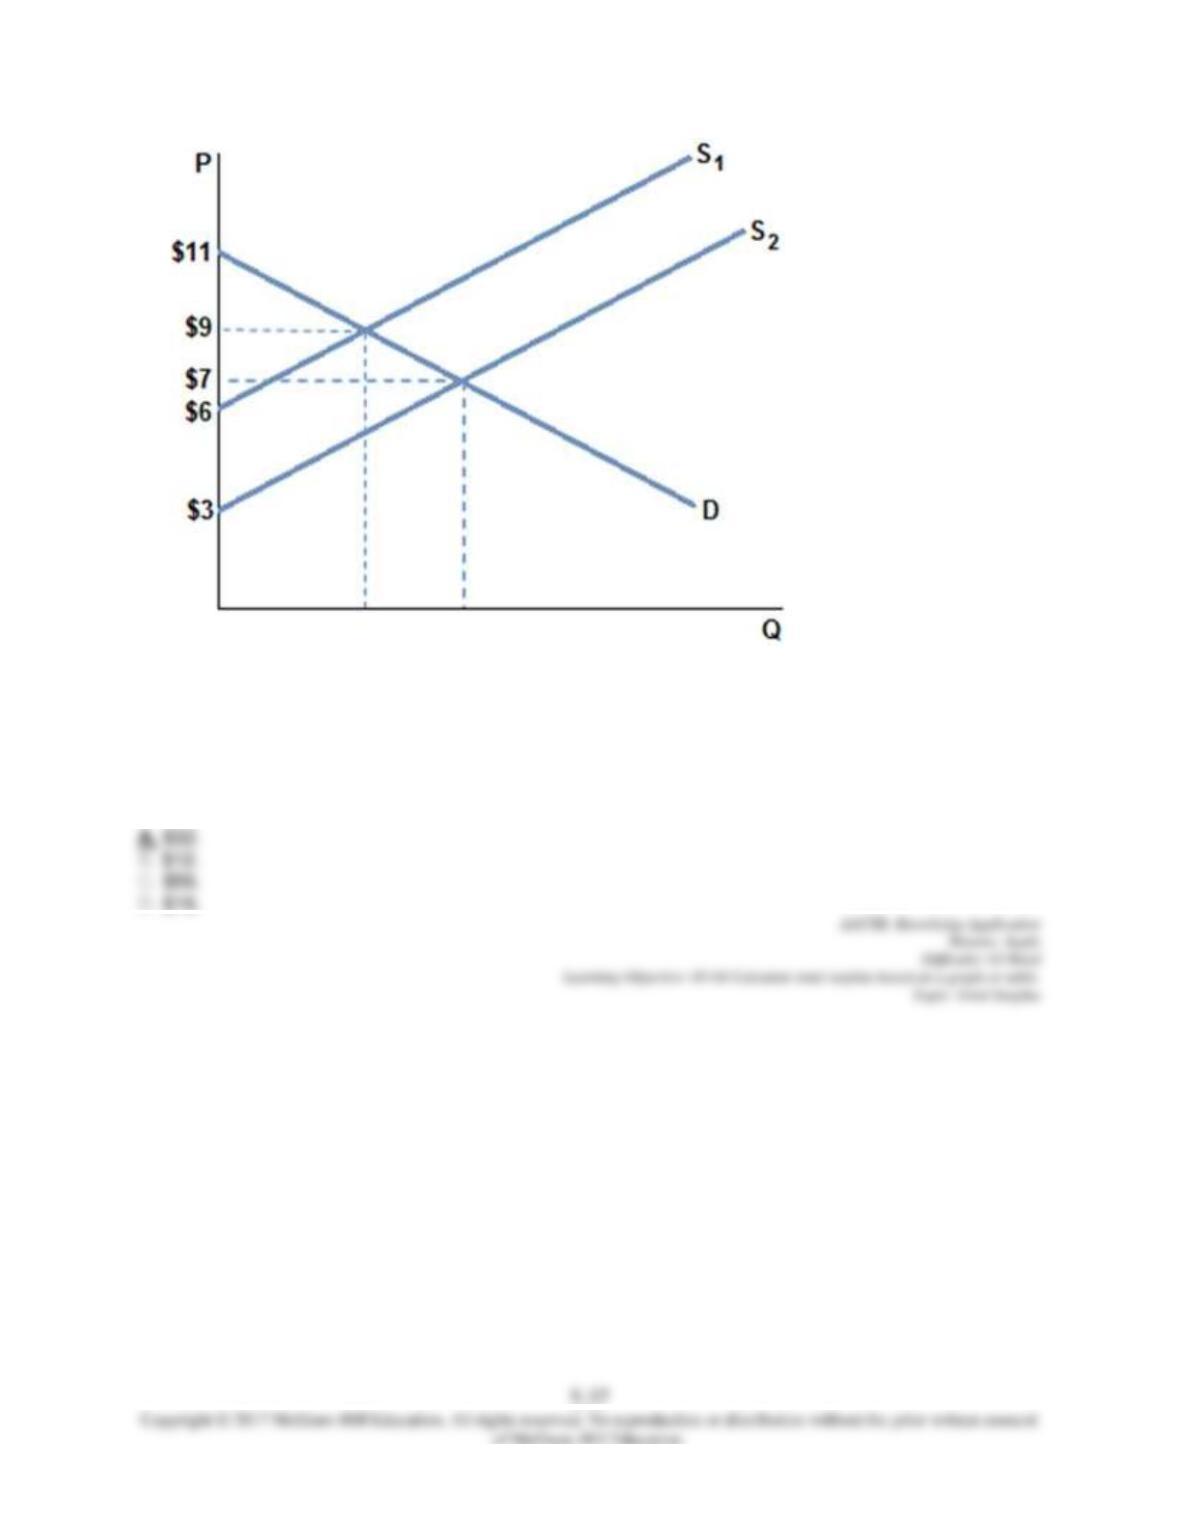
72.
Assume an equilibrium price of $7 and equilibrium quantity of 8 units at demand D and supply S2 in the
graph shown. Total surplus is:
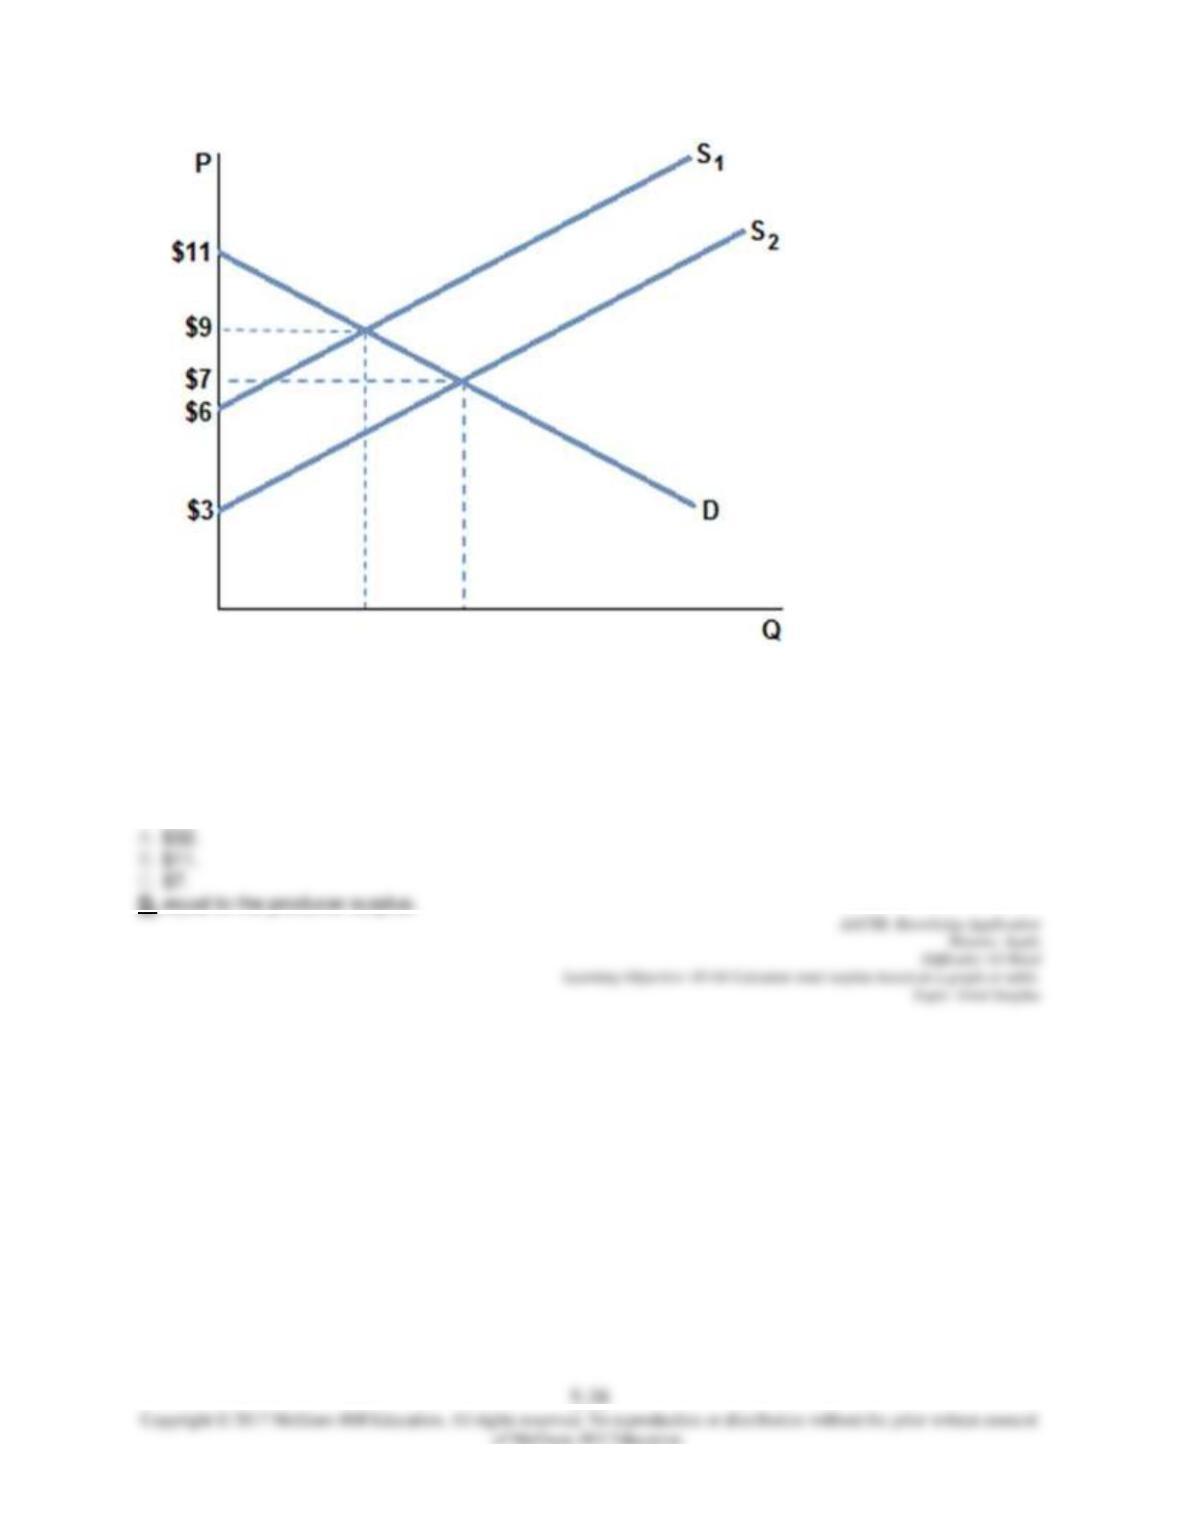
73.
Assuming the market is in equilibrium in the graph shown with demand D and supply S2 at a quantity of 8,
consumer surplus is:
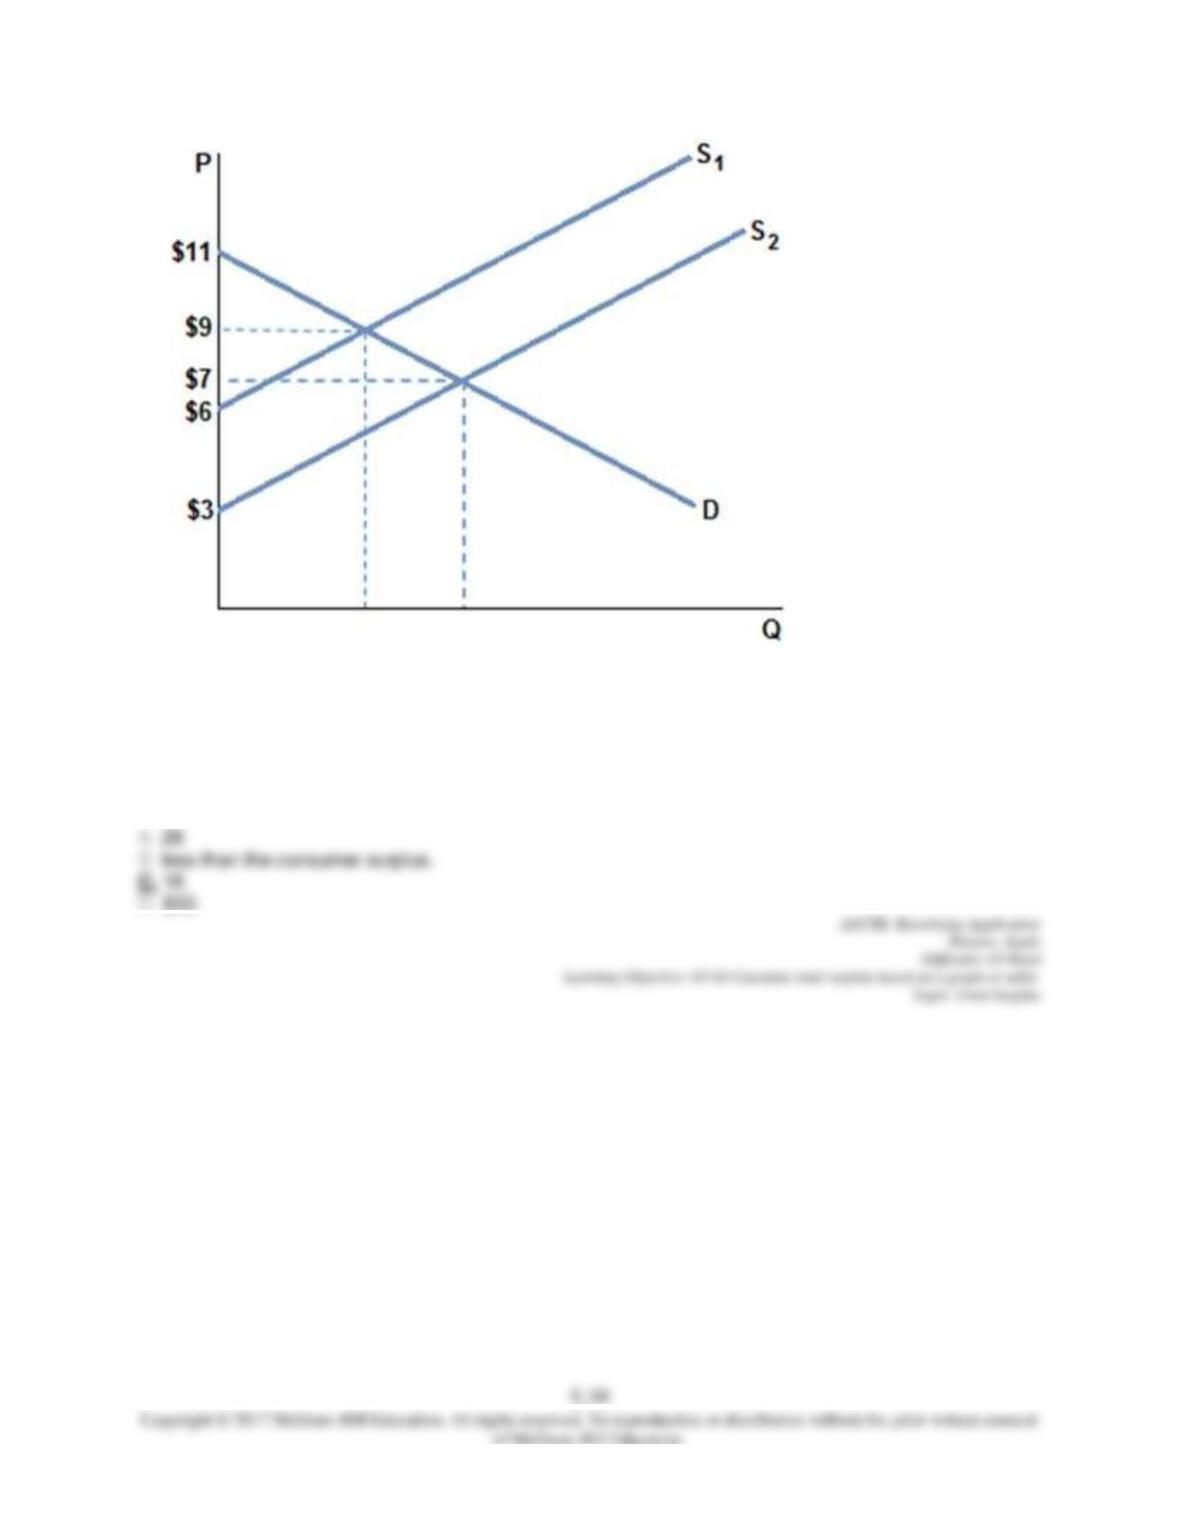
74.
Assuming the market is in equilibrium in the graph shown with demand D and supply S2 at a quantity of 8,
producer surplus is:
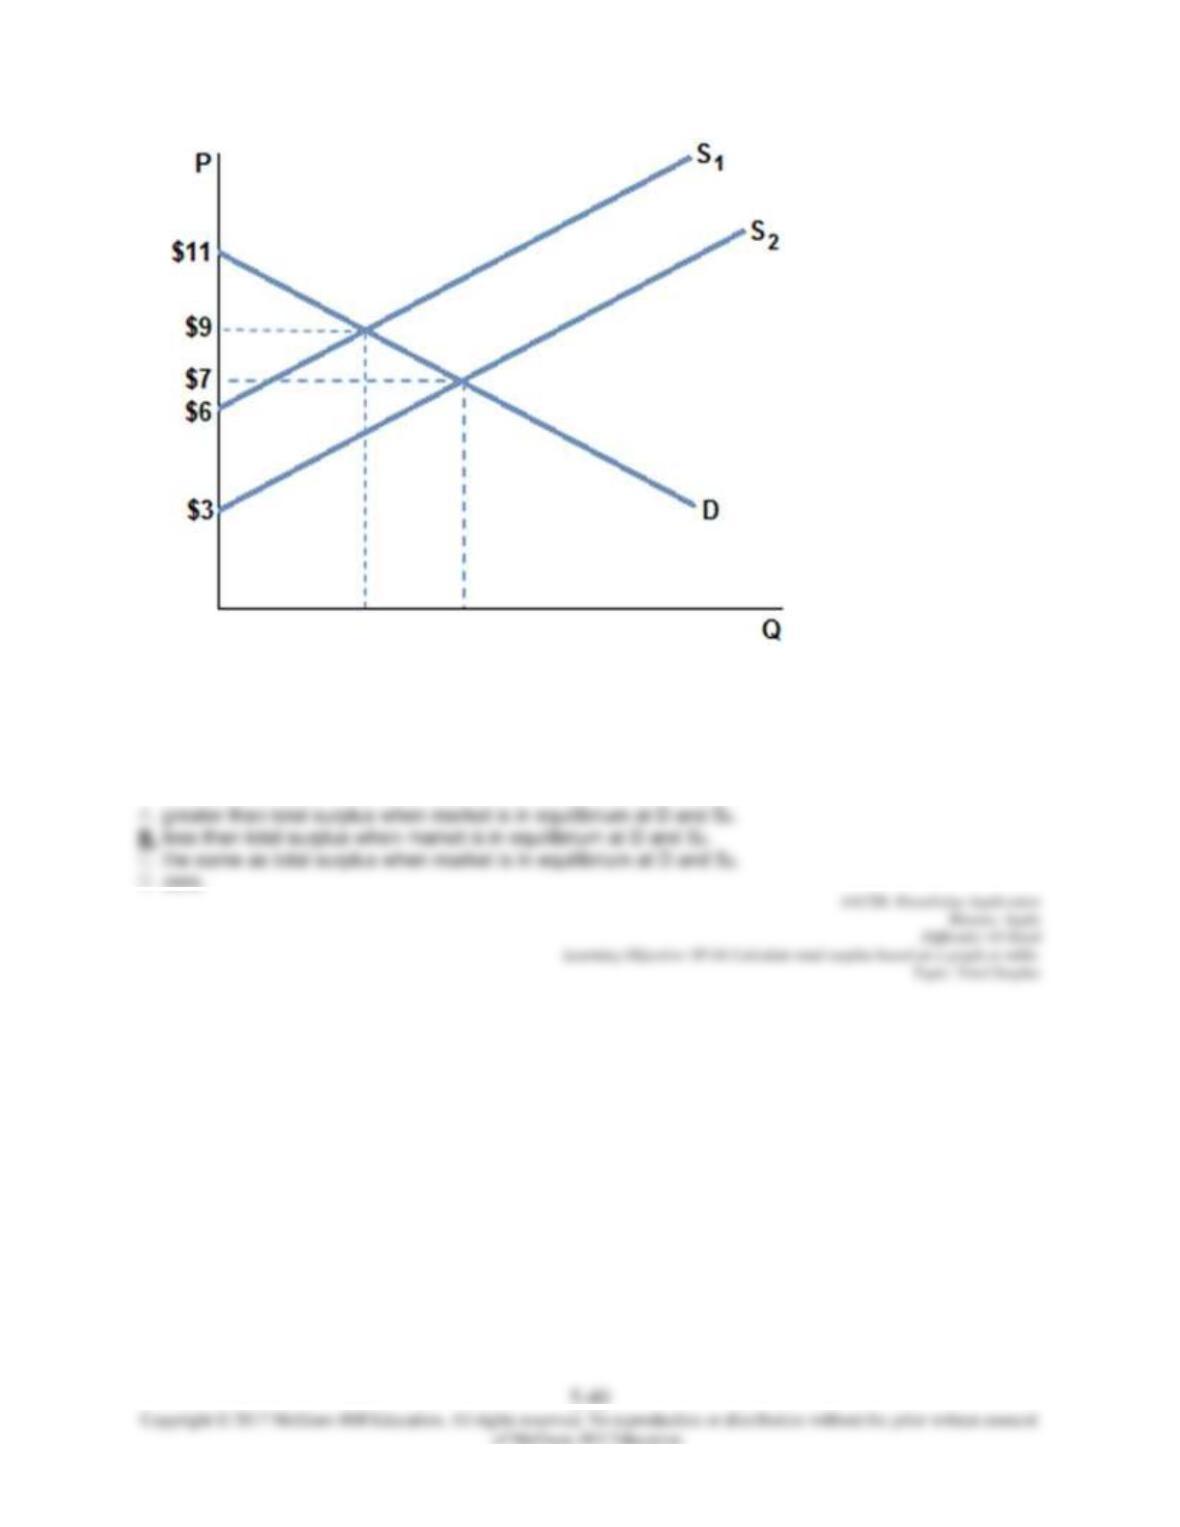
75.
Assuming the market is in equilibrium in the graph shown with demand D and supply S1, total surplus is: