7) Suppose consumers of cigarettes can be classified into two groups: heavy users and light users. Heavy
users purchase more cigarettes and are less sensitive to price changes relative to light users. To determine
whether a heavy user suffers a greater loss of consumer surplus than a light user does when the price of
cigarettes increases, one would need to know
A) each group’s average income.
B) the actual quantities purchased by each.
C) each individual’s price elasticity of demand.
D) no additional information.
For the following, please answer “True” or “False” and explain why.
8) Consumers who are more sensitive to changes in price suffer a greater loss of consumer surplus from
any given price increase.
9) The change in total welfare from a 10% increase in price will depend only on the elasticity of demand.
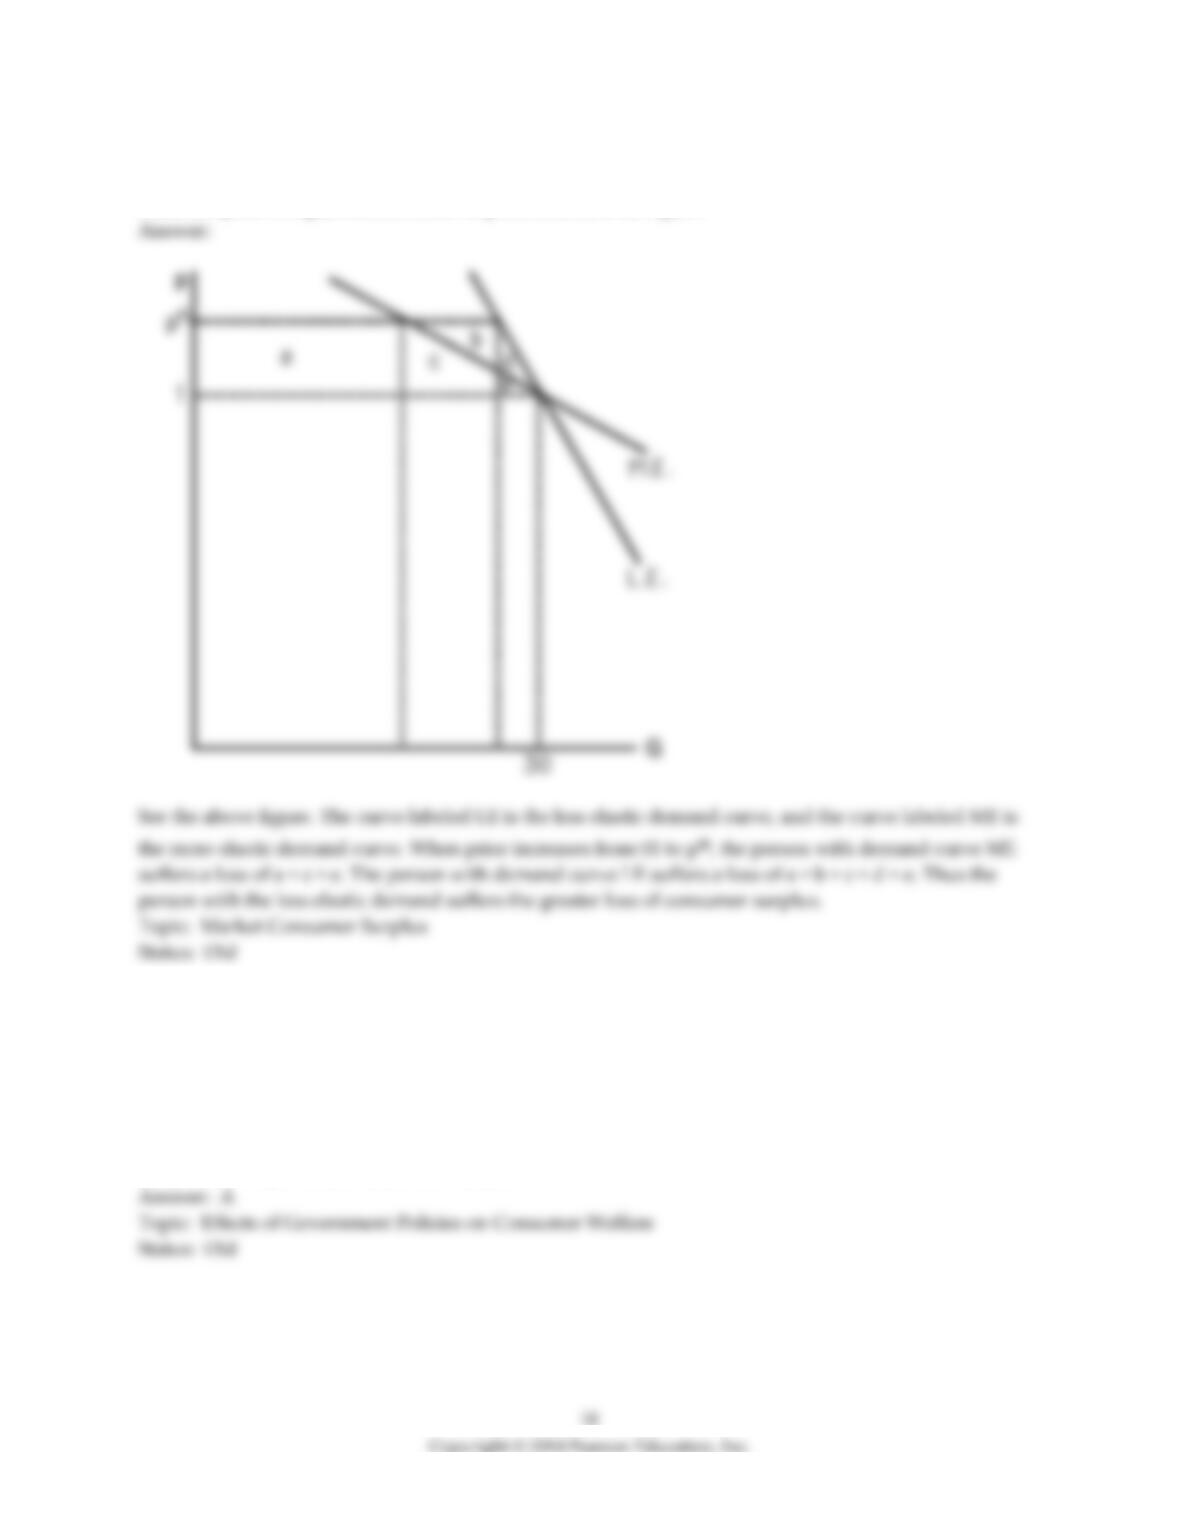
10) Ann and Bill each spend $30 per month on cigarettes when the price is $1 per pack. Draw a graph to
illustrate that the consumer with the less elastic demand will suffer the greater loss of consumer surplus
when the price of cigarettes increases. Explain and label the figure.
5.4 Effects of Government Policies on Consumer Welfare
1) A quota will reduce consumer welfare when
A) the quota is less than the amount purchased without the quota.
B) the quota is greater than the amount purchased without the quota.
C) the quota is on a good with high income elasticity.
D) Quotas always reduce consumer welfare.
2) The Equivalent Variation resulting from a quota is best defined as
A) the amount a consumer would pay to have the quota removed.
B) the amount the consumer would need to voluntarily accept the quota.
C) the amount a consumer would pay for the quantity specified by the quota.
D) the loss in utility resulting from the quota.
3) Julia is offered two options of government subsidies: $100 food stamp or $100 cash. If she receives $100
cash, she will spend $80 on food. If equivalent evaluation is measured for the situation when only $100 is
available to her, the equivalent evaluation is
A) greater than $100.
B) equal to $100.
C) less than $100.
D) Not enough information.
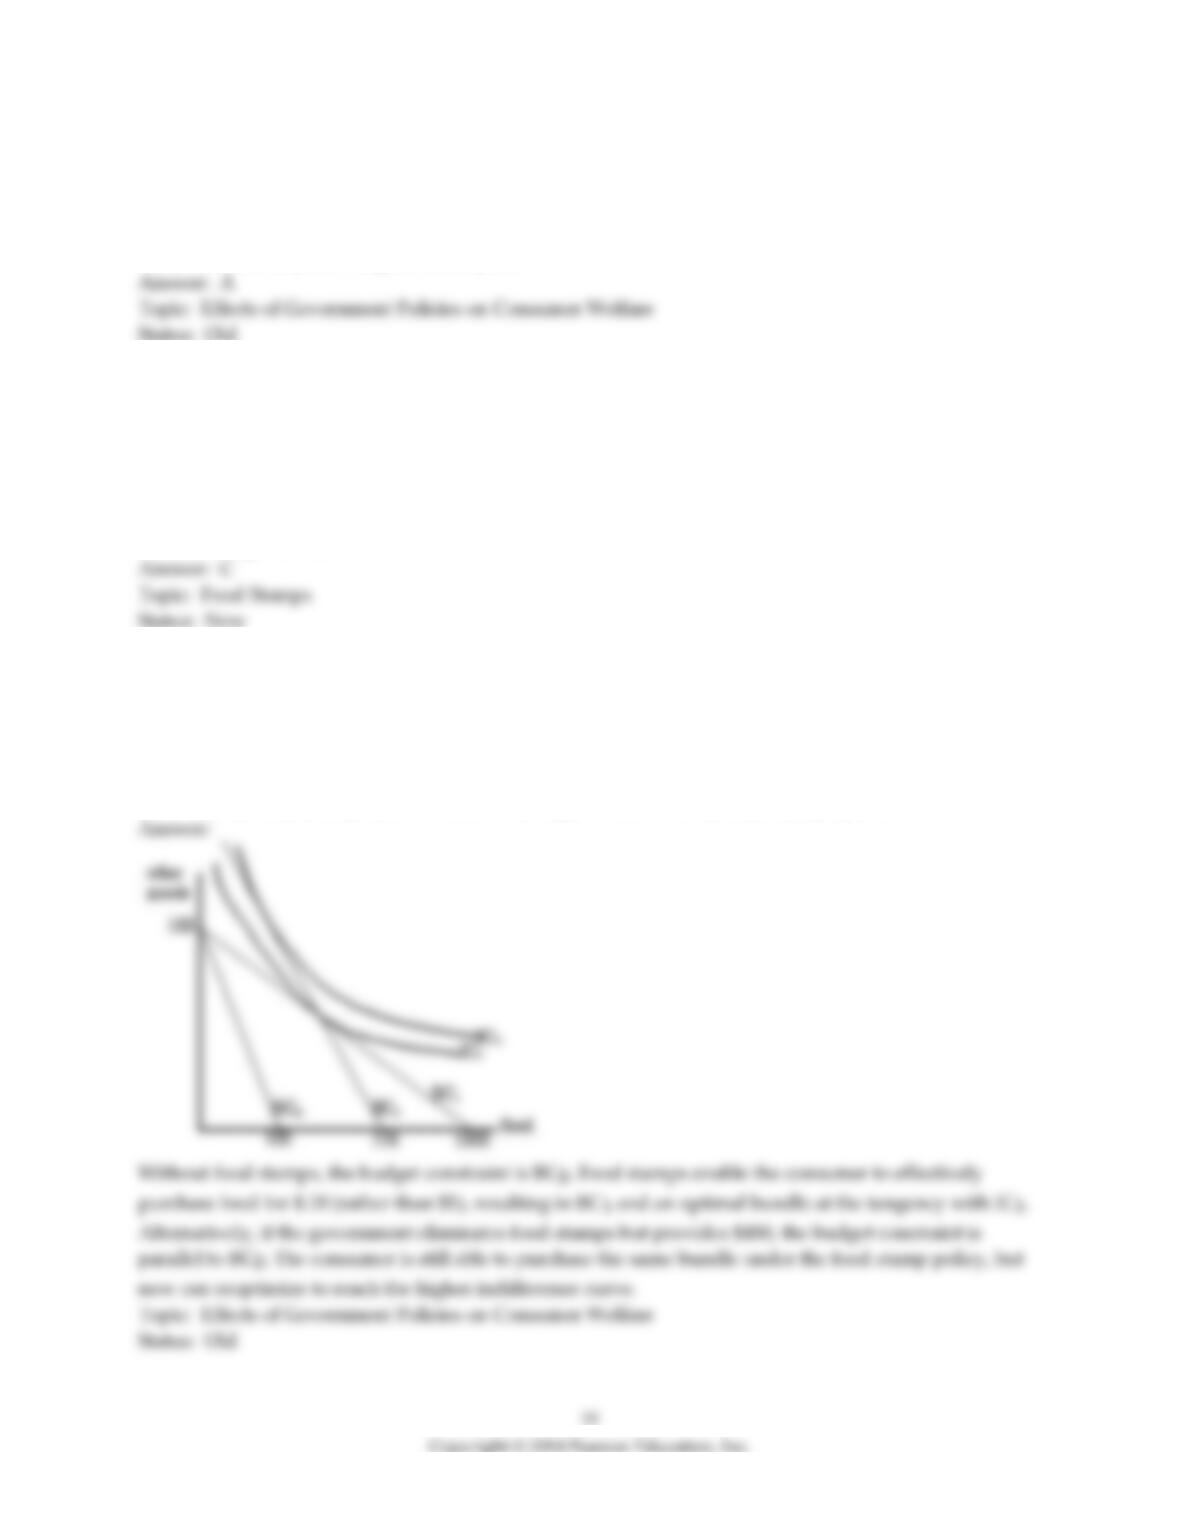
4) Suppose a consumer purchases Food (F) and other goods (X) with their income of $100. For simplicity,
suppose that food and other goods are measured in $1 units, so the price of each is $1. Currently, the
consumer can purchase unlimited food stamps by paying 10¢ for $1 of food. With this, the consumer
purchases 500 food stamps (for 500 units of food) and 50 units of X. As a result, the government must pay
90¢ towards food, for a total cost of $450. Using a graph of budget constraints and indifference curves,
show that the consumer prefers to receive a cash gift of $450 over the food stamp option.
5) During droughts, cities often impose water use restrictions on consumers. Suppose a representative
consumer has preferences for Water (W) and other goods (X) given by the utility function:
U(W,X) = WX.
Suppose the price of other goods is $1 and the price of water is initially 50¢. The consumer has a budget
of $50/week.
a. How much water will the consumer purchase each week?
b. Suppose the government imposes a quota on water use of 50 units/week. Show that the quota
reduces the representative consumer’s utility.
c. By how much does the quota harm the representative consumer? Specifically, compute the equivalent
variation of the quota.
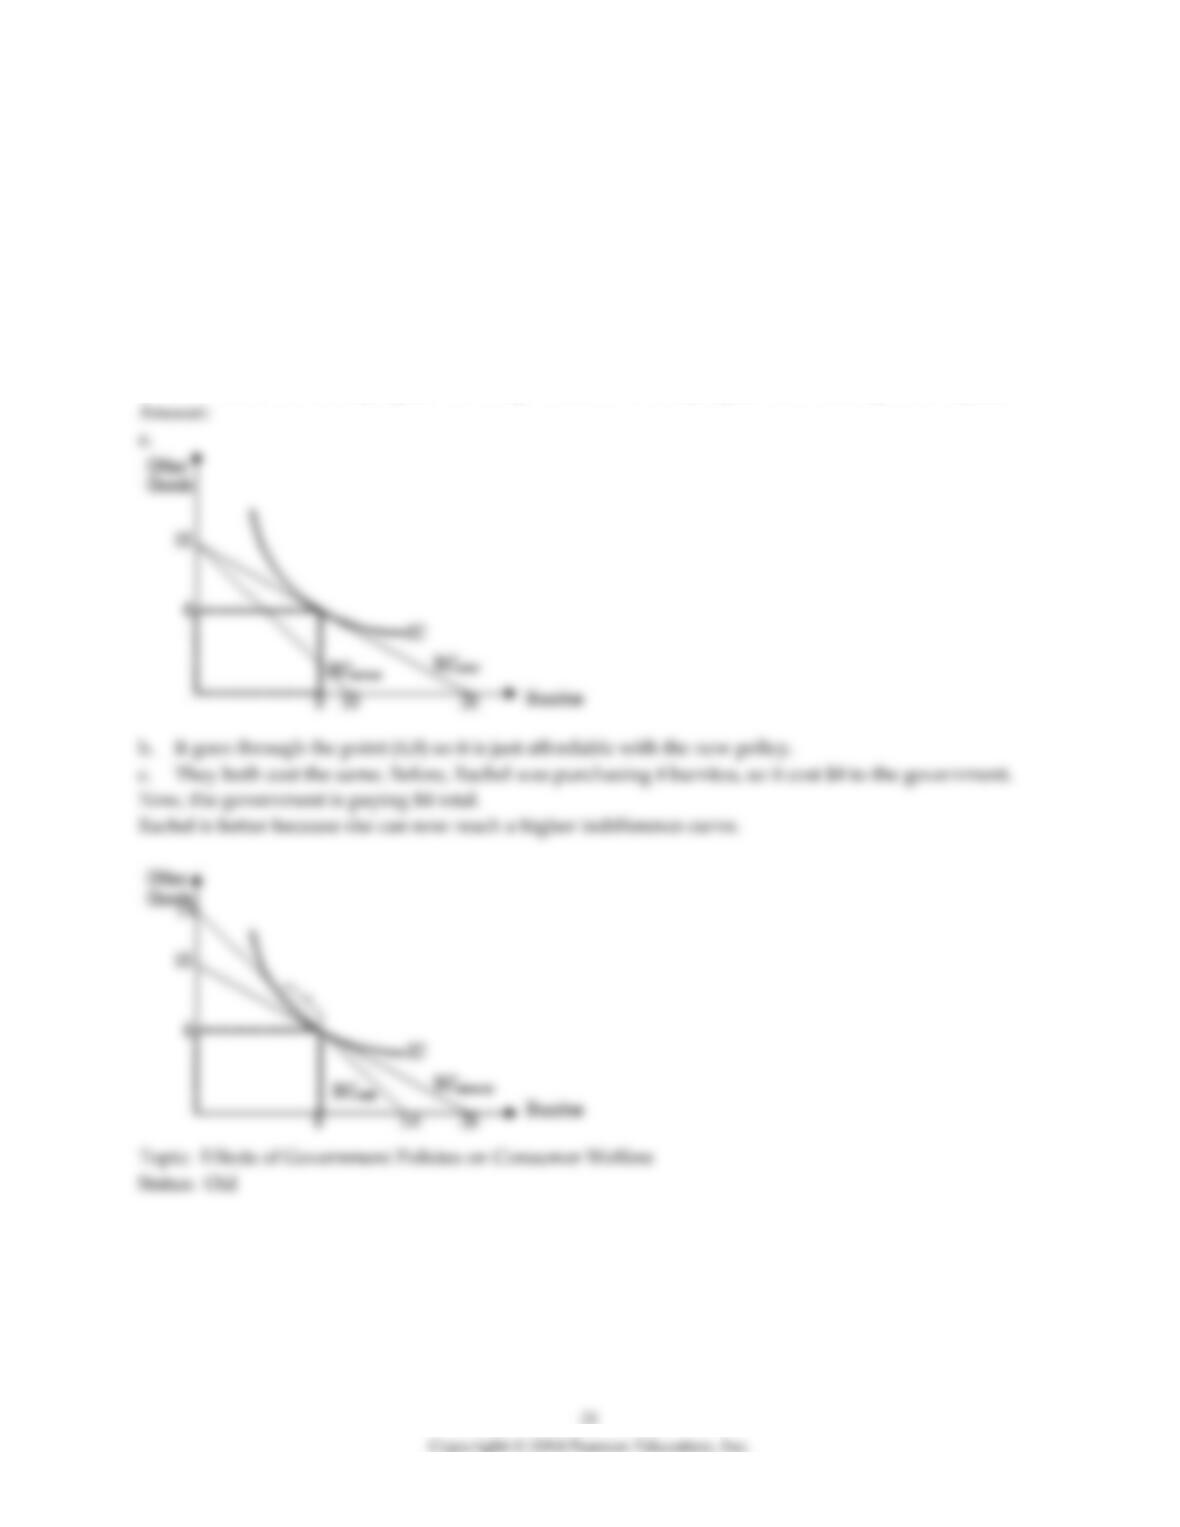
6) Rachel has an income of $10 which she spends on burritos and other goods (“other goods” represents a
composite of all other goods). The price of burritos is $1 as is the price of other goods.
a. Suppose the government agrees to pay half of Rachel’s burrito bill, so burritos now cost her $.50
apiece. She now chooses to buy eight burritos. On a graph with Burritos on the x-axis and other goods on
the y-axis, draw Rachel‘s budget constraints before and after the subsidy program. Also include an
indifference curve and the coordinates of Rachel’s optimal bundle with the subsidy.
b. Now, suppose the government ends the program in part a. and replaces it with a new and simpler
program: Rachel just gets a cash gift of $4. Show his new budget line. Is Rachel still able to afford her
optimal bundle that she chose with the subsidy?
c. How much does each program cost the government? Which program does Rachel prefer? Explain.
7) Steve’s utility for socks (q1) and other goods (q2) is given by
U(q1,q2) = 10q1.1 q2.9
The price of the composite good is p2=1 and the price of a pair of socks is p1=2. Steve’s income is Y=100.
Every year, Steve’s mom buys him 20 pairs of socks. Find the equivalent variation of the gift. What is the
difference between the cost of the gift and the equivalent valuation cash amount?
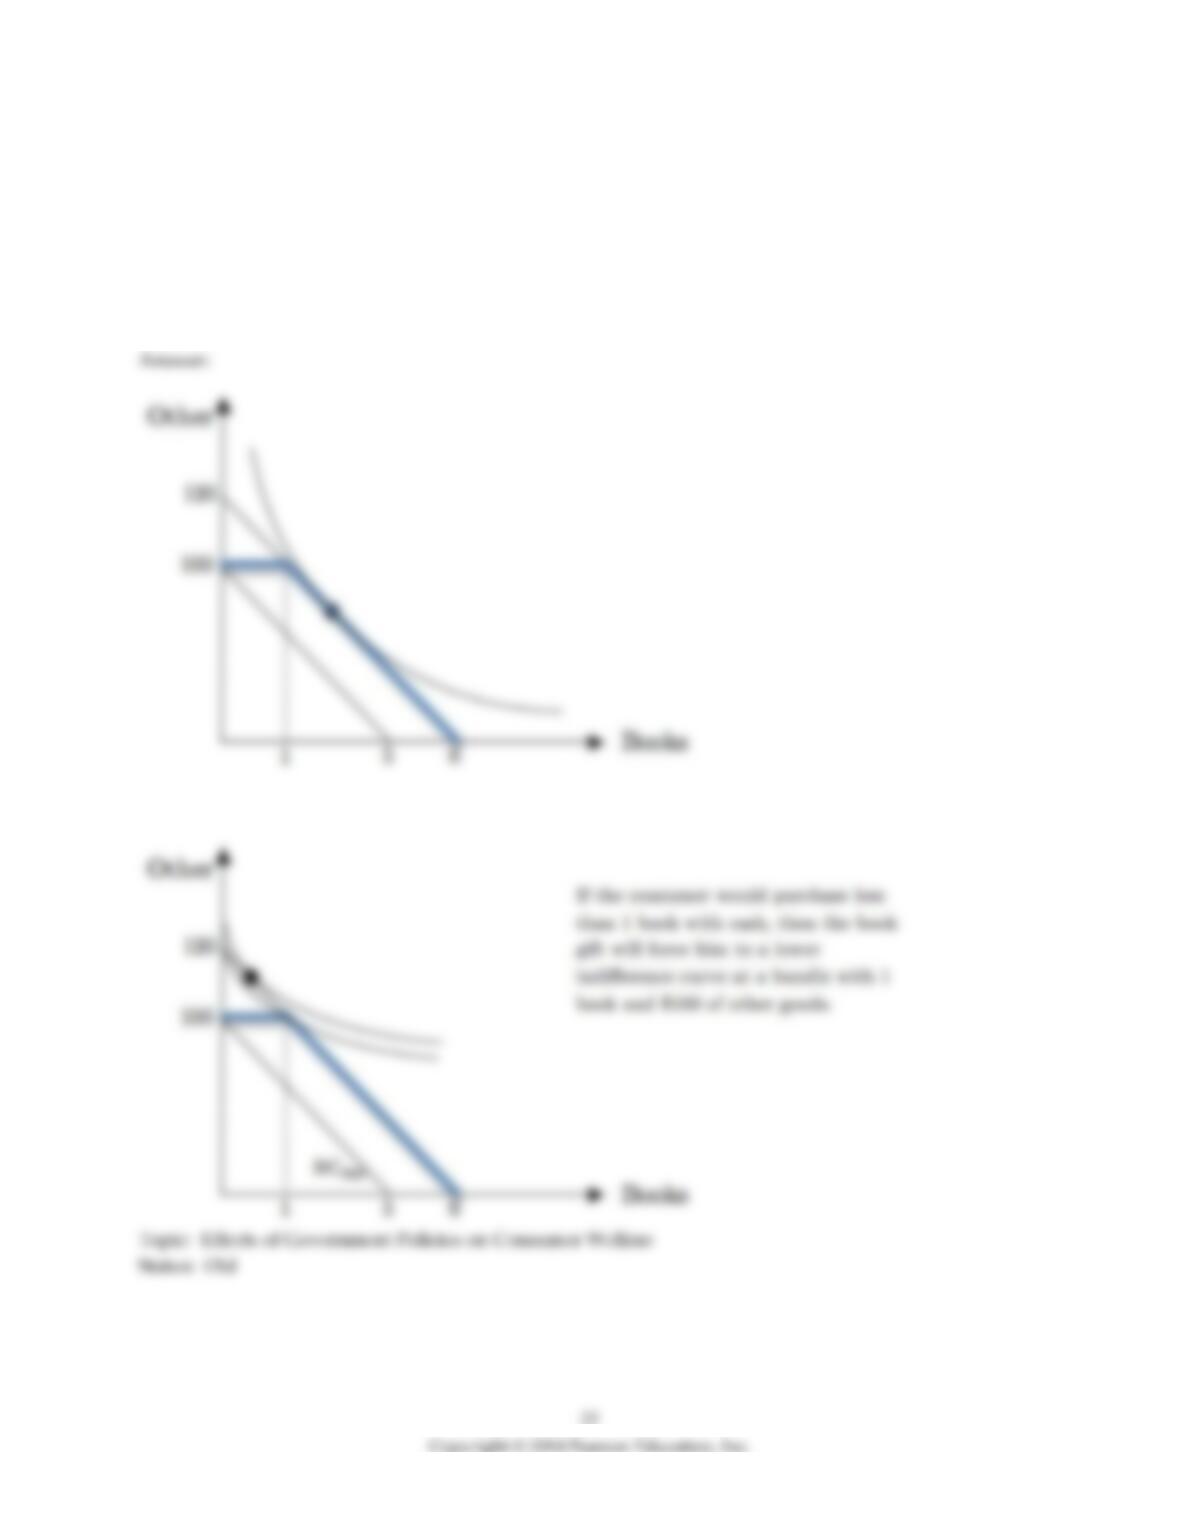
8) A consumer has $100 of income to spend on books and other goods (a composite good). Books cost $20
each and the consumer‘s optimal bundle is to consume purchase three books while spending the rest of
the income on the composite good. The consumer is then given a gift of a book. Assume the consumer is
unable to sell the book. Use two separate graphs to demonstrate each of the two possible scenarios:
i. A consumer that is indifferent between the book gift and a cash gift of $20.
ii. A consumer that strictly prefers a $20 cash gift to a book.
To get full credit, accompany each graph with a brief explanation and draw your graphs clearly and well
labeled.
9) Job is a smoker. He has a utility function for cigarettes smoked in bars (q1) and a composite good (q2)
given by
U(q1,q2) = 10q1.5 + q2
Job’s income is $100 and faces prices p1 = 5 and p2 = 1. The government is planning to ban smoking in
bars. Compute the compensating variation.
5.5 Deriving Labor Supply Curves
1) The price of leisure
A) is the same for everyone.
B) depends on the number of hours worked.
C) is measured as foregone earnings.
D) is immeasurable.
2) If a person supplies more hours of labor in response to a wage increase, then
A) the substitution effect is greater than the income effect.
B) the income effect is greater than the substitution effect.
C) the income effect equals the substitution effect.
D) the person is not maximizing utility.
3) If a person supplies fewer hours of labor in response to a wage increase, then
A) the substitution effect is greater than the income effect.
B) the income effect is greater than the substitution effect.
C) the income effect equals the substitution effect.
D) the person is not maximizing utility.

4) Empirical studies have found that the labor supply curves for most parts of the population are
A) backward-bending.
B) upward sloping.
C) downward-sloping.
D) nearly vertical.
5) A backward-bending labor supply curve implies that
A) the substitution effect dominates the income effect at higher wage rates but not at lower wage rates.
B) the substitution effect dominates the income effect at lower wage rates but not at higher wage rates.
C) leisure is an inferior good.
D) workers are irrational.
6) A backward-bending labor supply curve could possibly imply which of the following cases?
A) Leisure is an inferior good.
B) Leisure is a normal good.
C) Leisure is a normal good at low wages and inferior at high wages.
D) None of the above.
7) If Bobby thinks that leisure is an inferior good, then his labor supply curve
A) is backward bending.
B) is always negatively sloped.
C) is always positively sloped.
D) does not exist.
8) A tax cut that raises the after-tax wage rate will most likely result in more hours worked if
A) tax rates were low already.
B) the relevant portion of the labor supply curve is upward sloping.
C) the relevant portion of the labor supply curve is downward sloping.
D) workers can be easily fooled.

9) If workers are in the backward-bending section of their labor supply curves, than an increase in the
income tax rate will
A) increase the tax revenue and increase the number of hours worked.
B) increase the tax revenue and decrease the number of hours worked.
C) decrease the tax revenue and increase the number of hours worked.
D) decrease the tax revenue and decrease the number of hours worked.
10) In response to an increase in the wage rate, the substitution effect will cause a person to
A) supply fewer hours of labor.
B) supply more hours of labor.
C) supply the same hours of labor.
D) have a backward bend in her labor supply curve.
11) In response to an increase in the wage rate, the income effect will usually cause a person to
A) supply fewer hours of labor.
B) supply more hours of labor.
C) supply the same hours of labor.
D) have a horizontal labor supply curve.
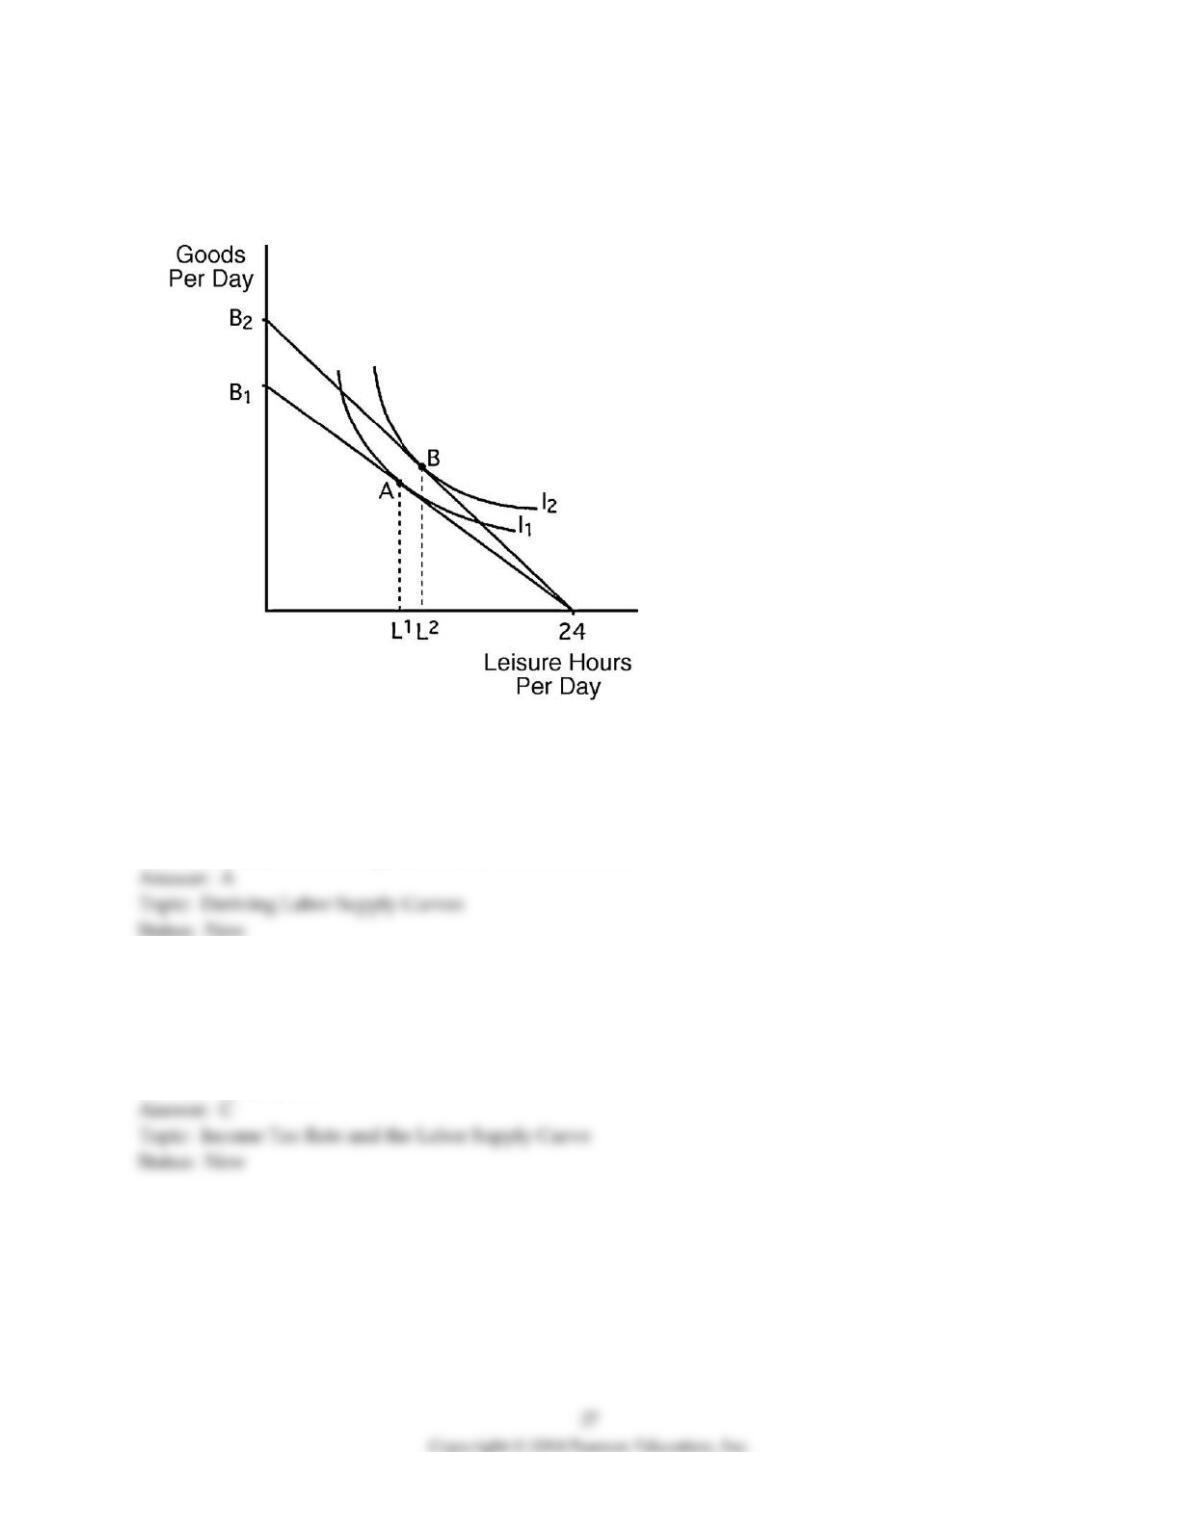
12) The graph below shows George’s indifference curves and budget lines. From A to B, we can
conclude
A) leisure is a normal good.
B) leisure is an inferior good.
C) George will increase his working time with a higher wage.
D) the substitution effect is greater than the income effect.
13) If the marginal tax rate rises above t * = 63%, tax revenue will decrease because
A) workers refuse to pay taxes since the tax rate is too high.
B) workers are in the downward-sloping portion of labor supply.
C) workers reduce working hours in response to the wage loss.
D) None of the above.
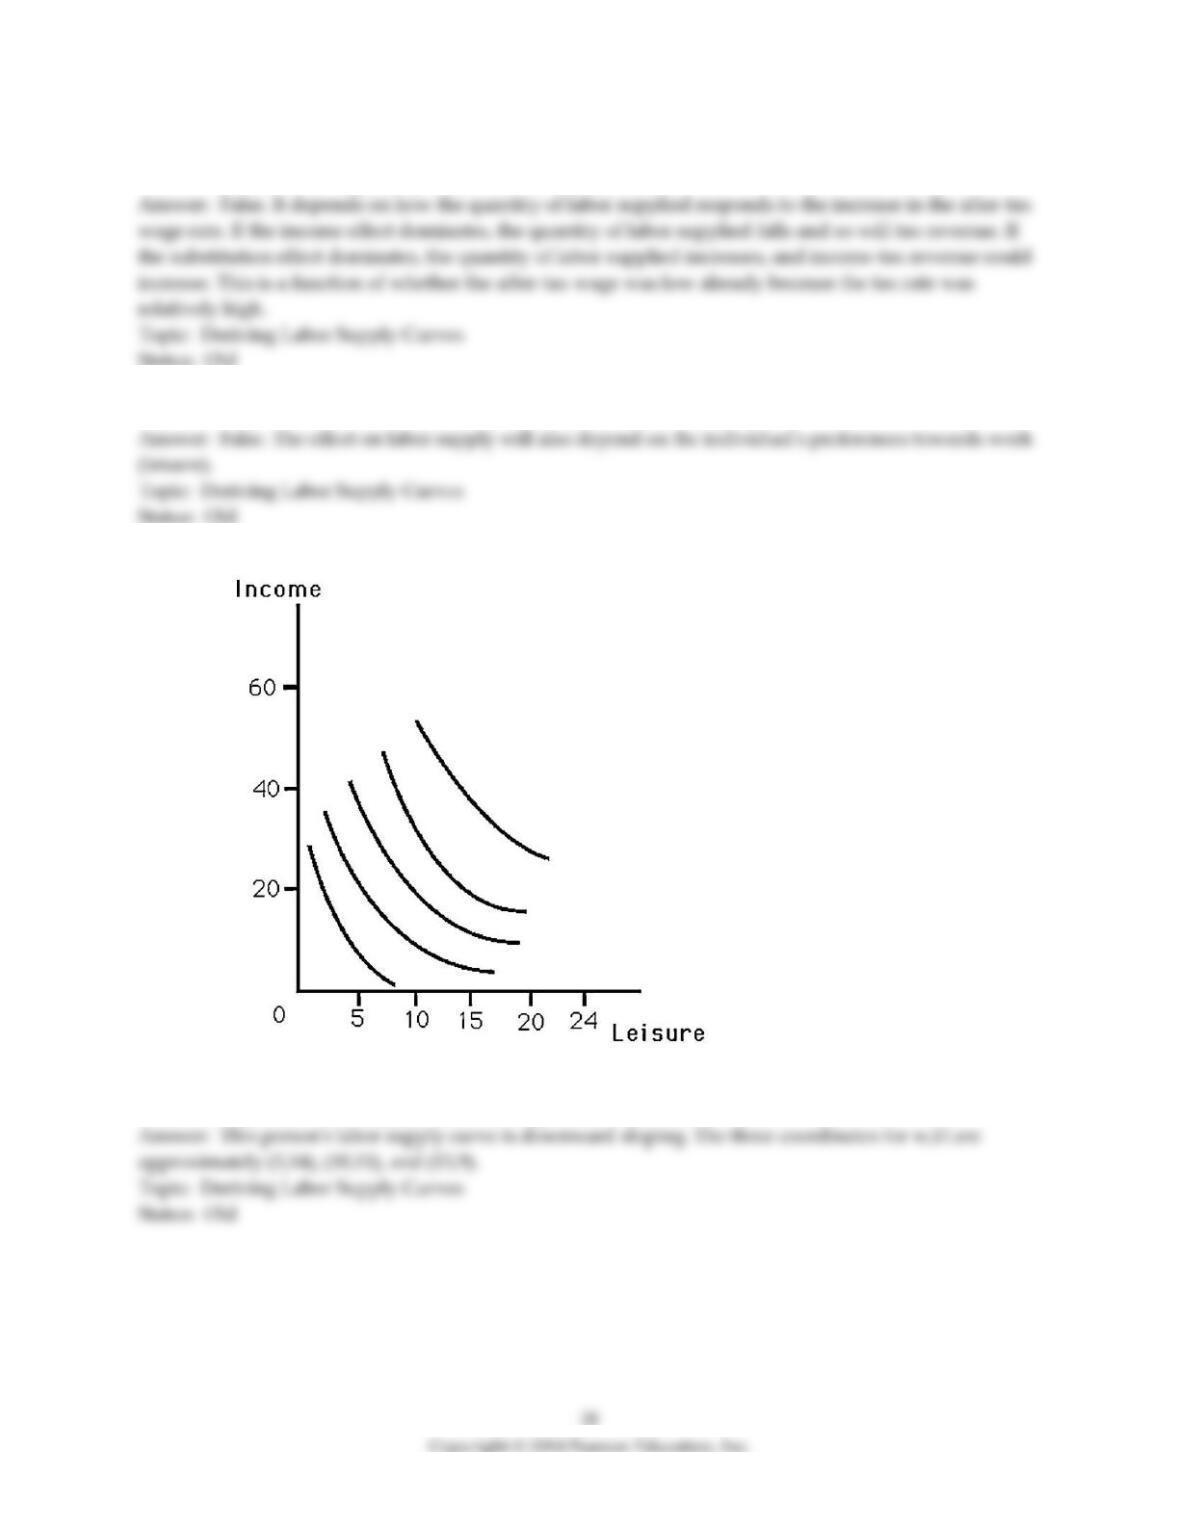
For the following, please answer “True” or “False” and explain why.
14) A tax cut will unambiguously lower income-tax revenue.
15) An increase in unearned income always creates a disincentive to work
16) The above figure shows an indifference map for a person’s choices between leisure and consumption.
Derive this person’s labor supply curve for wage rates of $5, $10, and $15.
29
17) Draw a graph with Goods Per Day on the vertical axis and Leisure Hours Per Day increasing from left
to right on the horizontal axis. Show that a person who works can work fewer hours and increase utility
when the wage rate increases.
18) Suppose a person’s utility for leisure (L) and consumption (Y) can be expressed as U = Y + L0.5. Show
what happens to the person’s labor supply curve when the income tax is cut from 70 % to 30 %. Denote
hours worked as H and wage per hour as w.
19) Suppose a person’s utility for leisure (L) and consumption (Y) can be expressed as U = Y + L0.5.
Assuming a wage rate of $10 per hour, show what happens to the person’s labor supply curve when the
person wins a lottery prize of $100 per day.

20) Suppose a person’s utility for leisure (L) and consumption (Y) can be expressed as U = Y ∗ L and this
person has no non-labor income. Assuming a wage rate of $10 per hour, show what happens to the
person’s labor supply when the person wins a lottery prize of $100 per day.
21) Consider a consumer with preferences for consumption of a composite good (C) and leisure (L) given
by the following utility function:
U(C,L) = 2C1/2 + L
Denote the consumer’s wage rate by w and total time available for labor and leisure is normalized to one.
The price of consumption is one. Denote the amount of labor supplied as N, so that N+L= 1. The
consumer also earns non-labor income (“allowance”) of 0.
a. Write out the budget constraint determining feasible allocations of leisure and consumption.
b. Compute the optimal bundle of leisure and optimal bundle of consumption.
c. Derive the consumer’s labor supply function: N*(w, ).
d. Determine the effect of increasing non-labor income on the supply of labor (that is, compute the
relevant partial derivative).
e. How does non-labor income affect the consumption of the composite good, C?
f. Compute the effects of an increase in wage on consumption and labor supply. Is leisure a normal
good?

22) What does it mean to say the labor supply is backwards bending? How does this relate to the direction
and magnitude of the income and substitution effects? Will the labor supply be backwards bending if
Leisure is a normal good? Will it be backwards bending if Leisure is an Inferior good?