39. When the price elasticity of demand is large in magnitude, a _____ increase in the price
leads to a _____ reduction in the amount purchased and the demand curve is relatively ____.
A. slight; substantial; steep
40. When the price elasticity of demand is small in magnitude, a _____ increase in the price
leads to a _____ reduction in the amount purchased and the demand curve is relatively ____.
A. slight; substantial; steep
41. Suppose that books are measured on the horizontal axis and CDs are measured on the
vertical axis. As long as the law of demand holds for books, than an increase in the price of books
will generate a price-consumption curve that traces a path:
D. downward.
42. If two goods are substitutes, then an increase in the price of one will cause:
D. a movement down and to the right along the demand curve for the other good.
43. If an increase in the price of one good causes the demand curve for another good to shift
to the left, then the two goods are:
D. unrelated.
44. If an increase in the price of one good causes the demand curve for another good to shift
to the right, then the two goods are:
D. unrelated.
45. If a change in the price of one good does not cause a shift in the demand curve of another
good, then the two goods are:
A. substitutes.
46. A curve that shows how the best available consumption bundle changes as income
changes (holding the consumer’s preferences and all other prices fixed) is called:
A. a price-consumption curve.
47. If the income-consumption path slopes upward, then:
D. the goods are complements.
48. If the income-consumption path slopes down, then:
A. both goods are inferior.
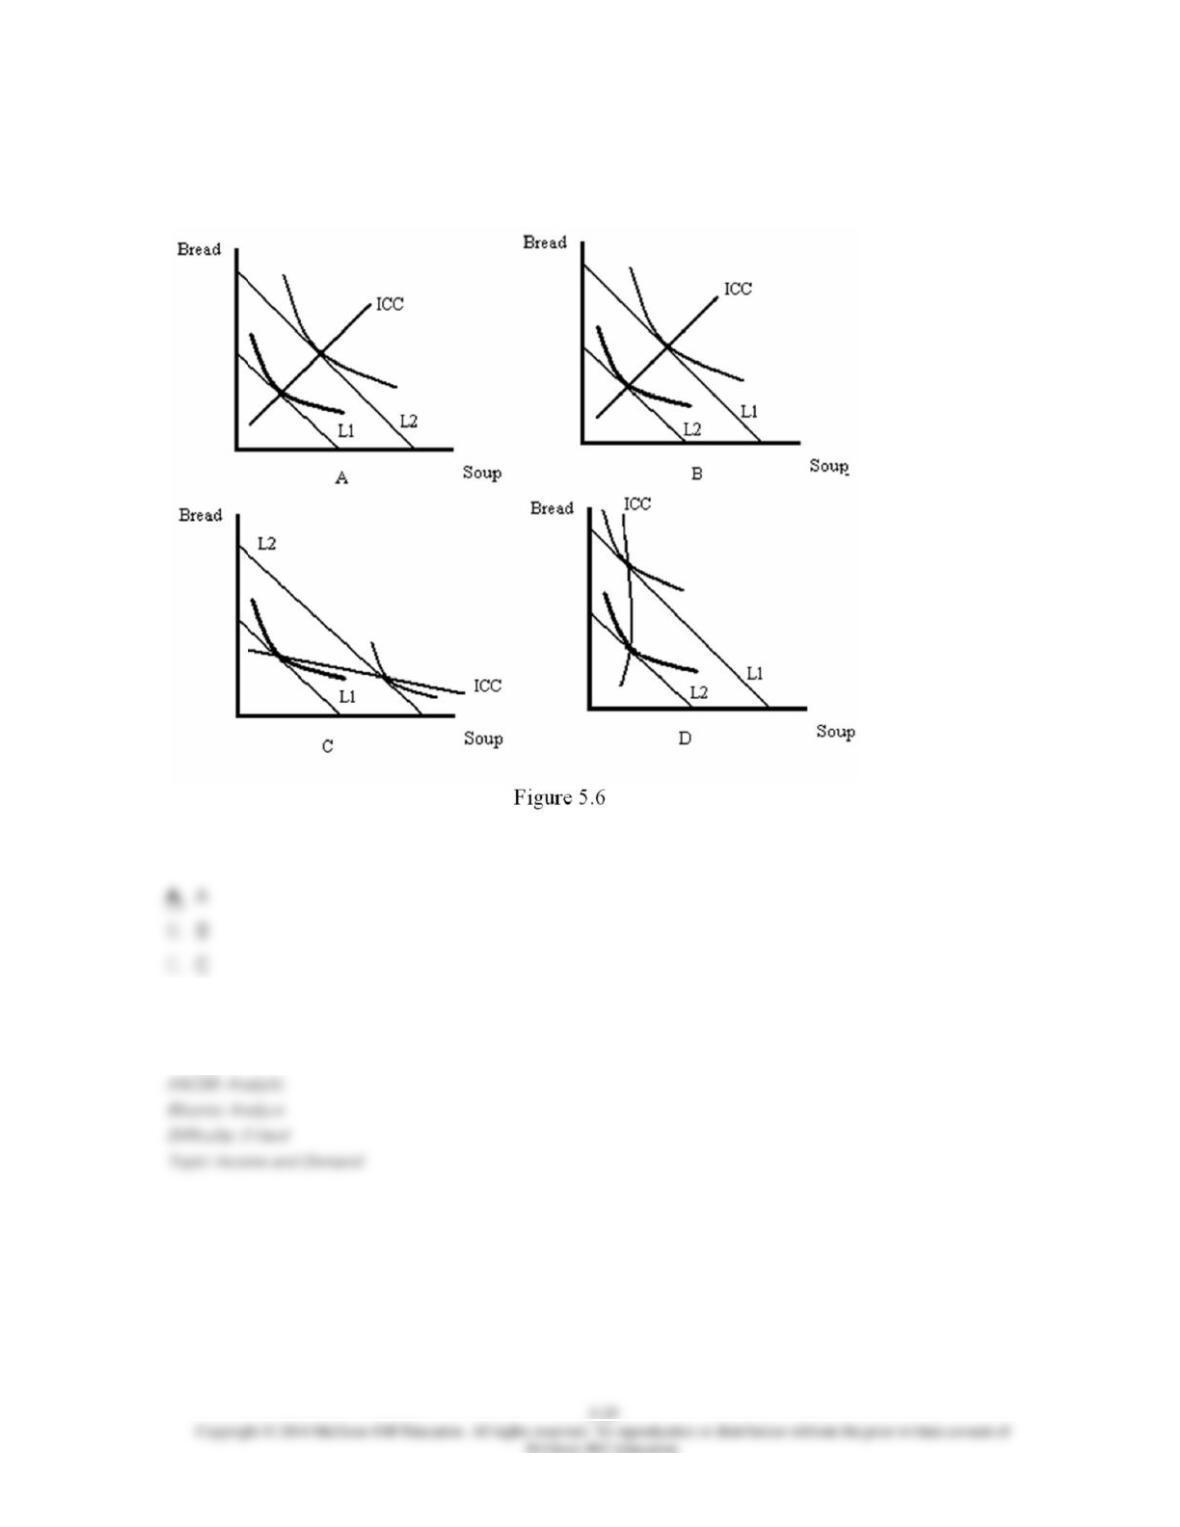
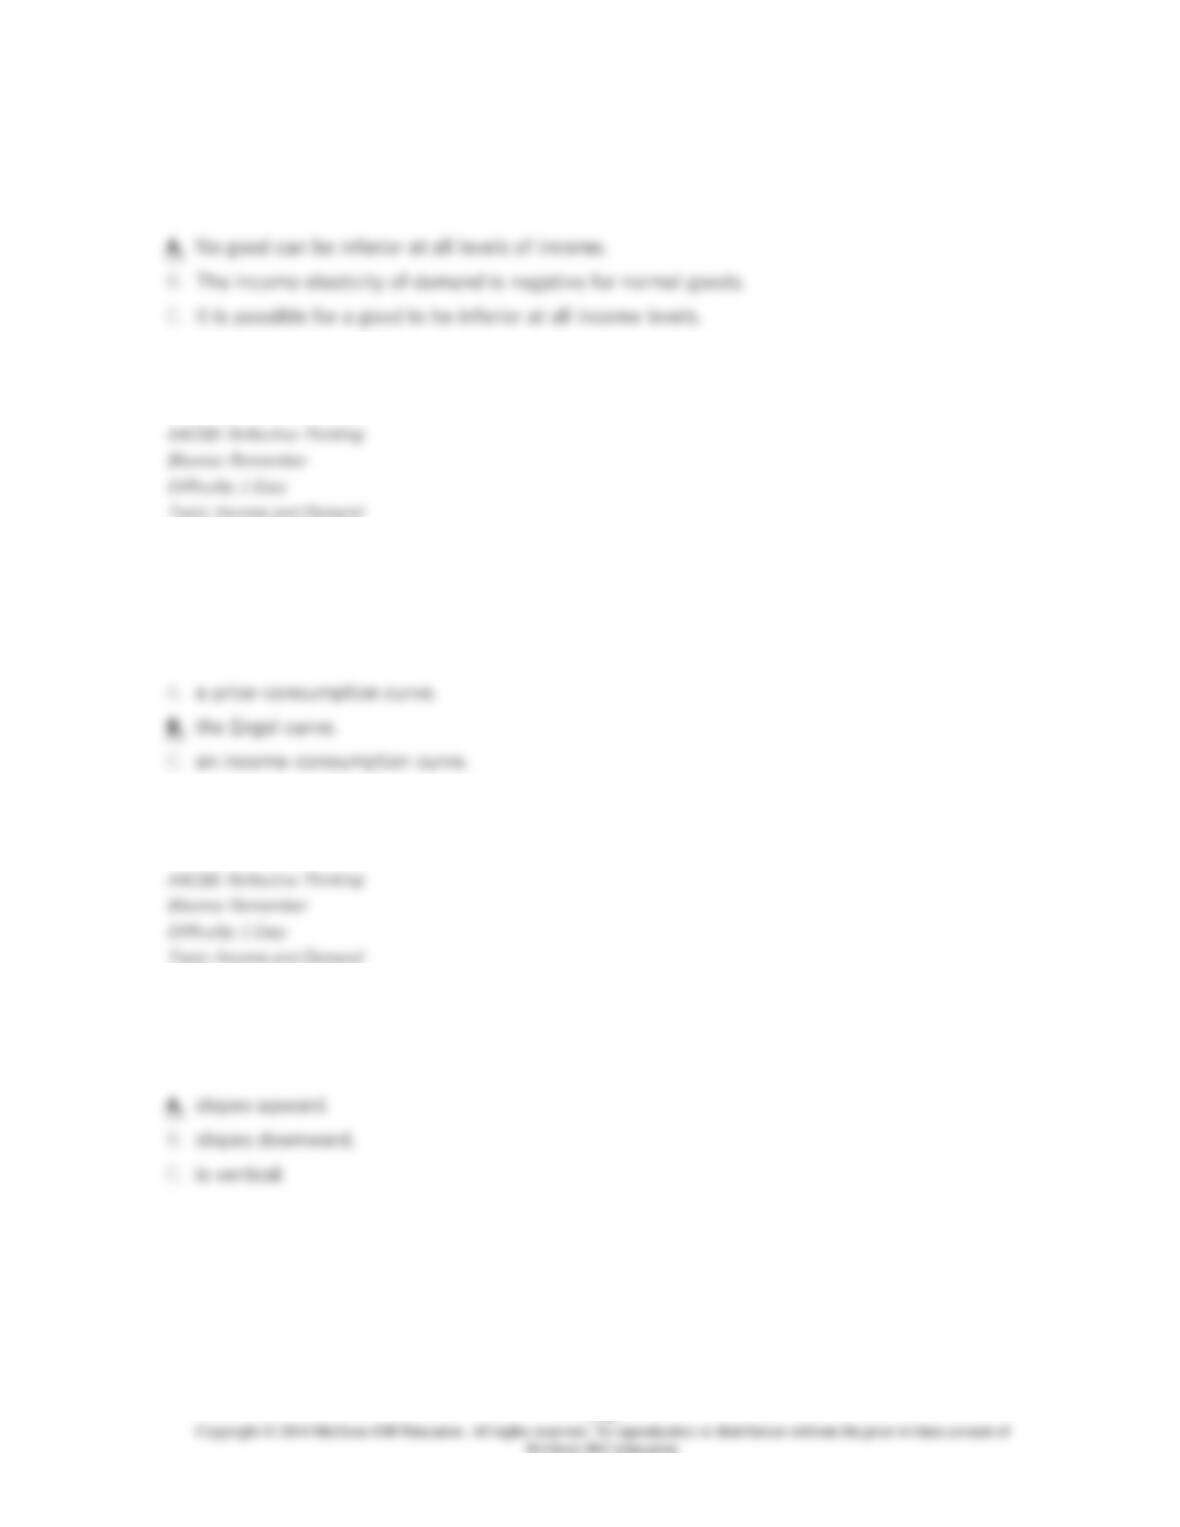
49. Refer to Figure 5.6. Which diagram shows an increase in income with both bread and soup
being normal goods?
D. D
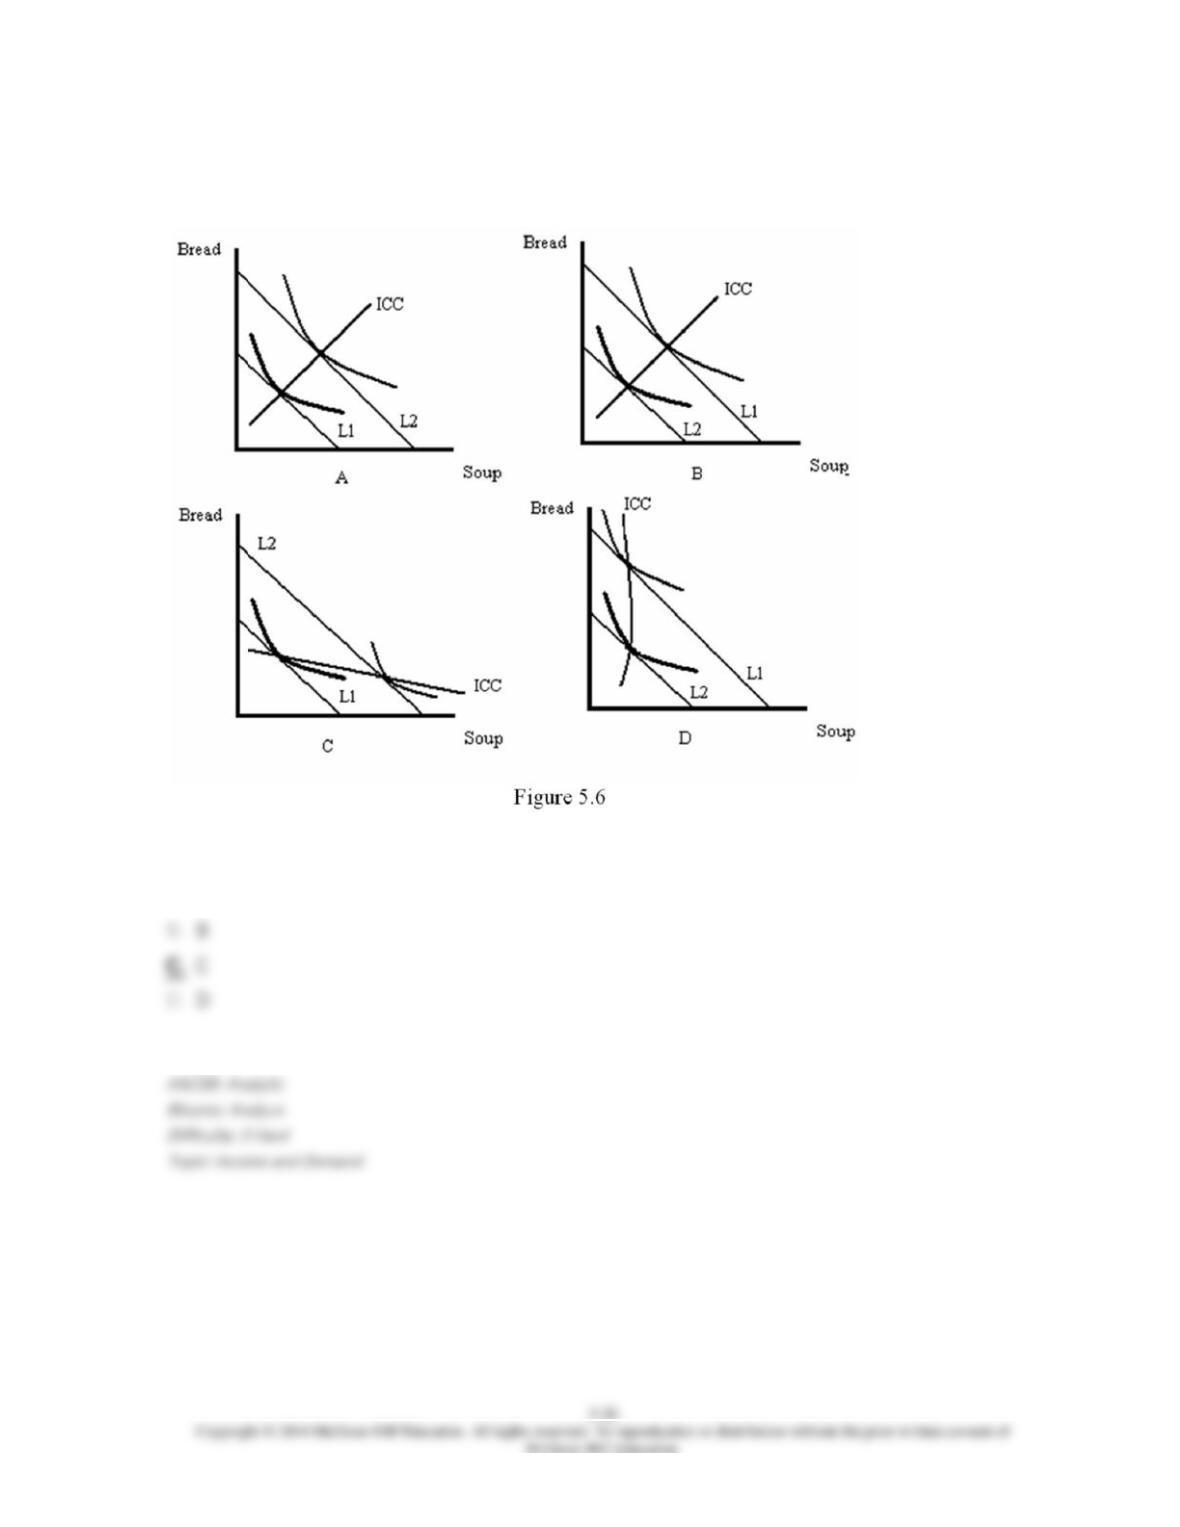
50. Refer to Figure 5.6. Which diagram shows an increase in income with bread being inferior
and soup being normal?
A. A
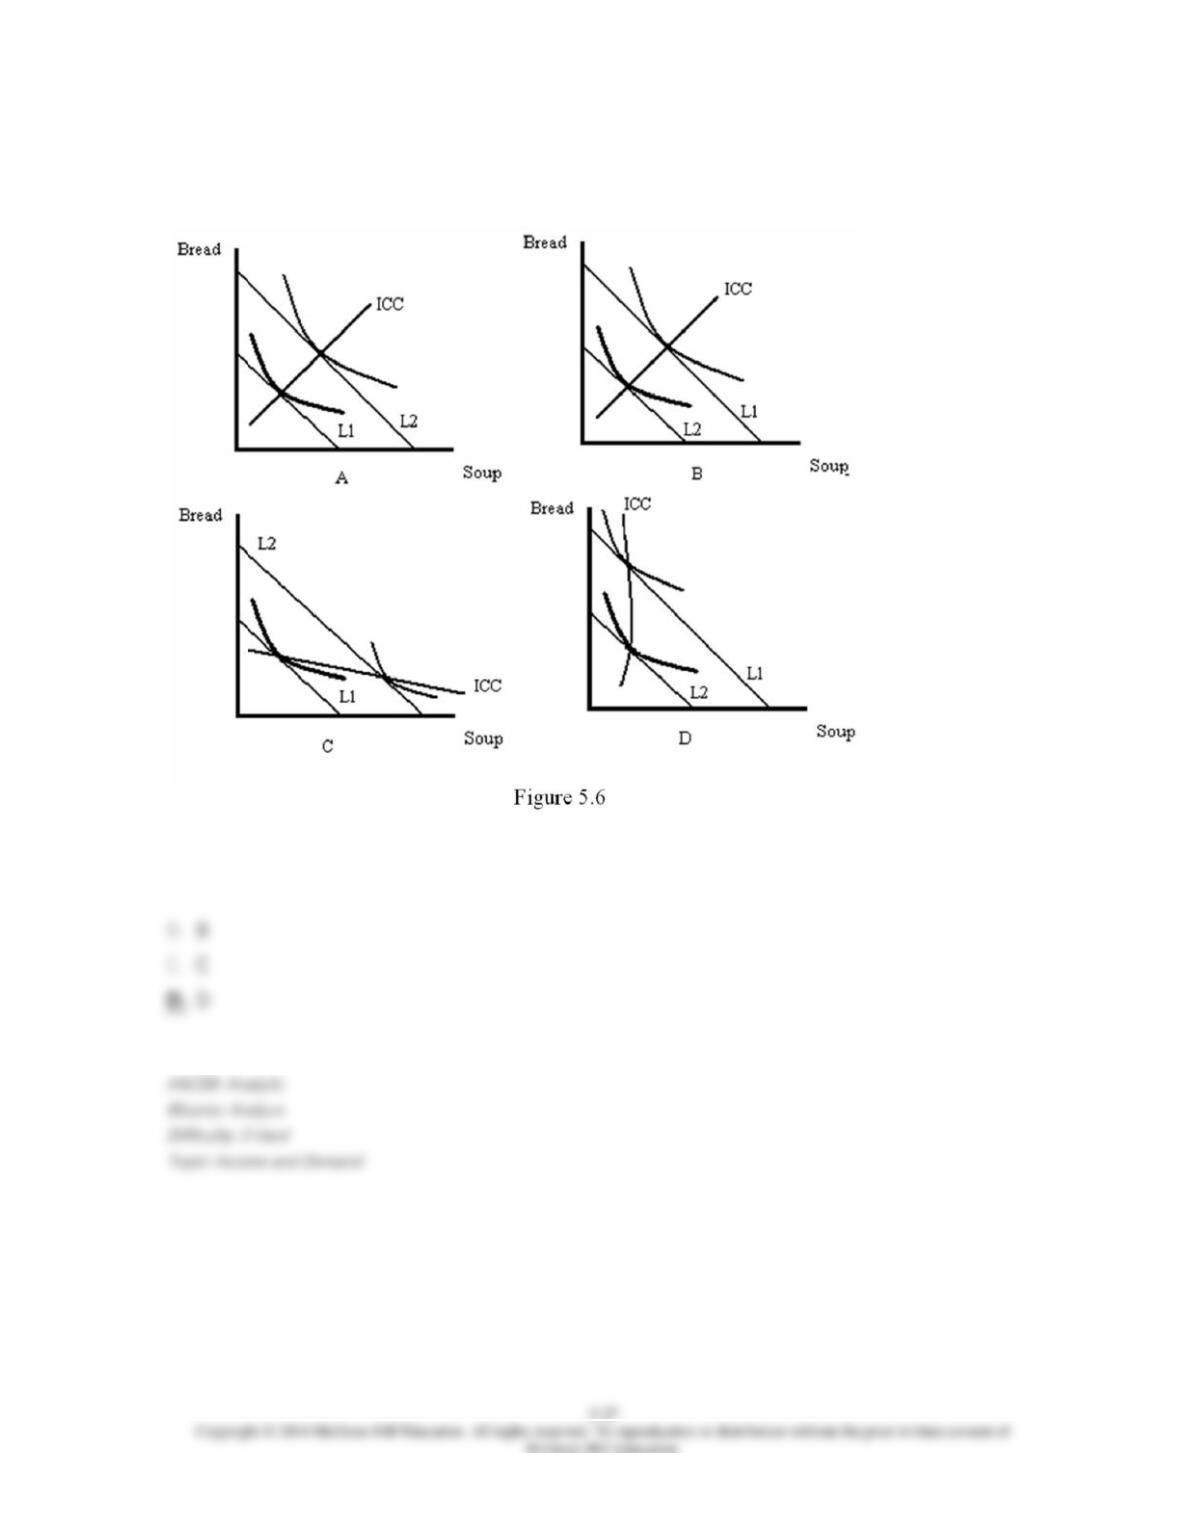
51. Refer to Figure 5.6. Which diagram shows a decrease in income with bread being normal
and soup being inferior?
A. A
52. Which of the following statements is true?
D. It is possible for all of the goods a consumer buys to be inferior.
53. A curve that describes the relationship between income and the amount of a good
consumed (holding the consumer’s preferences and all other prices fixed) is called:
D. a budget line.
54. If a good is normal, then the Engel curve:
D. is horizontal.
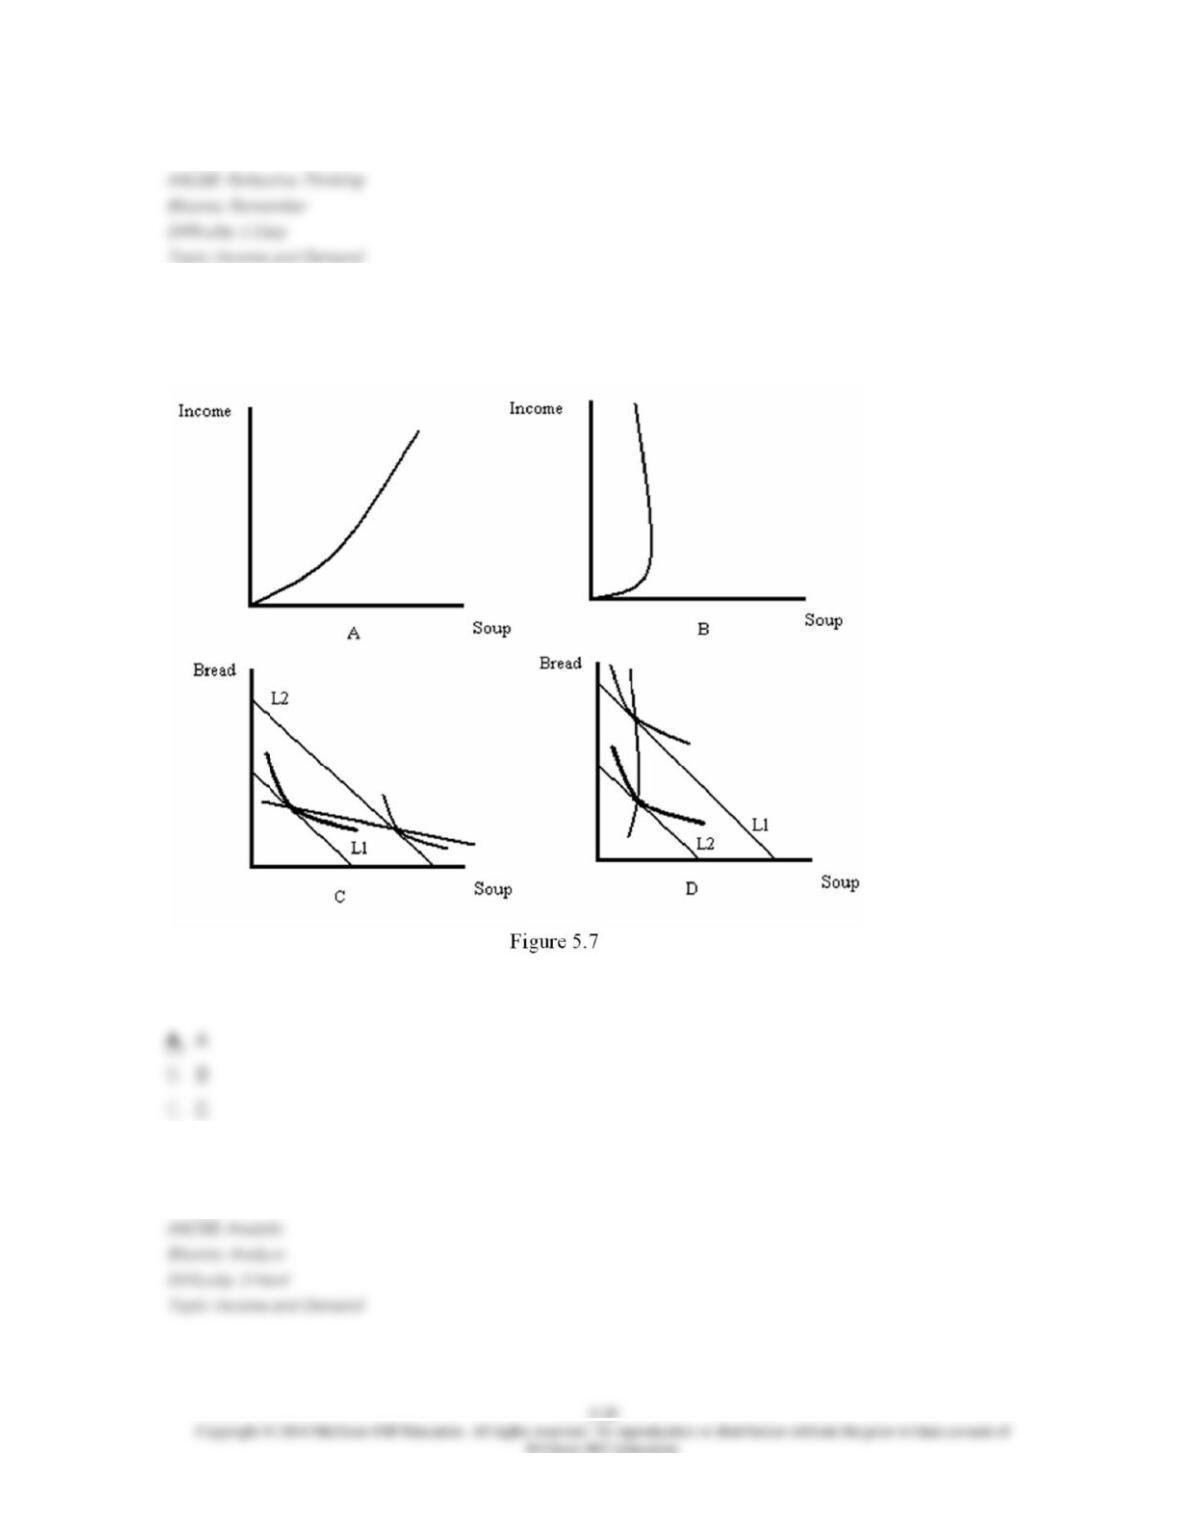
55. Refer to Figure 5.7. Which diagram best represents an Engle curve where soup is a normal
good?
D. D
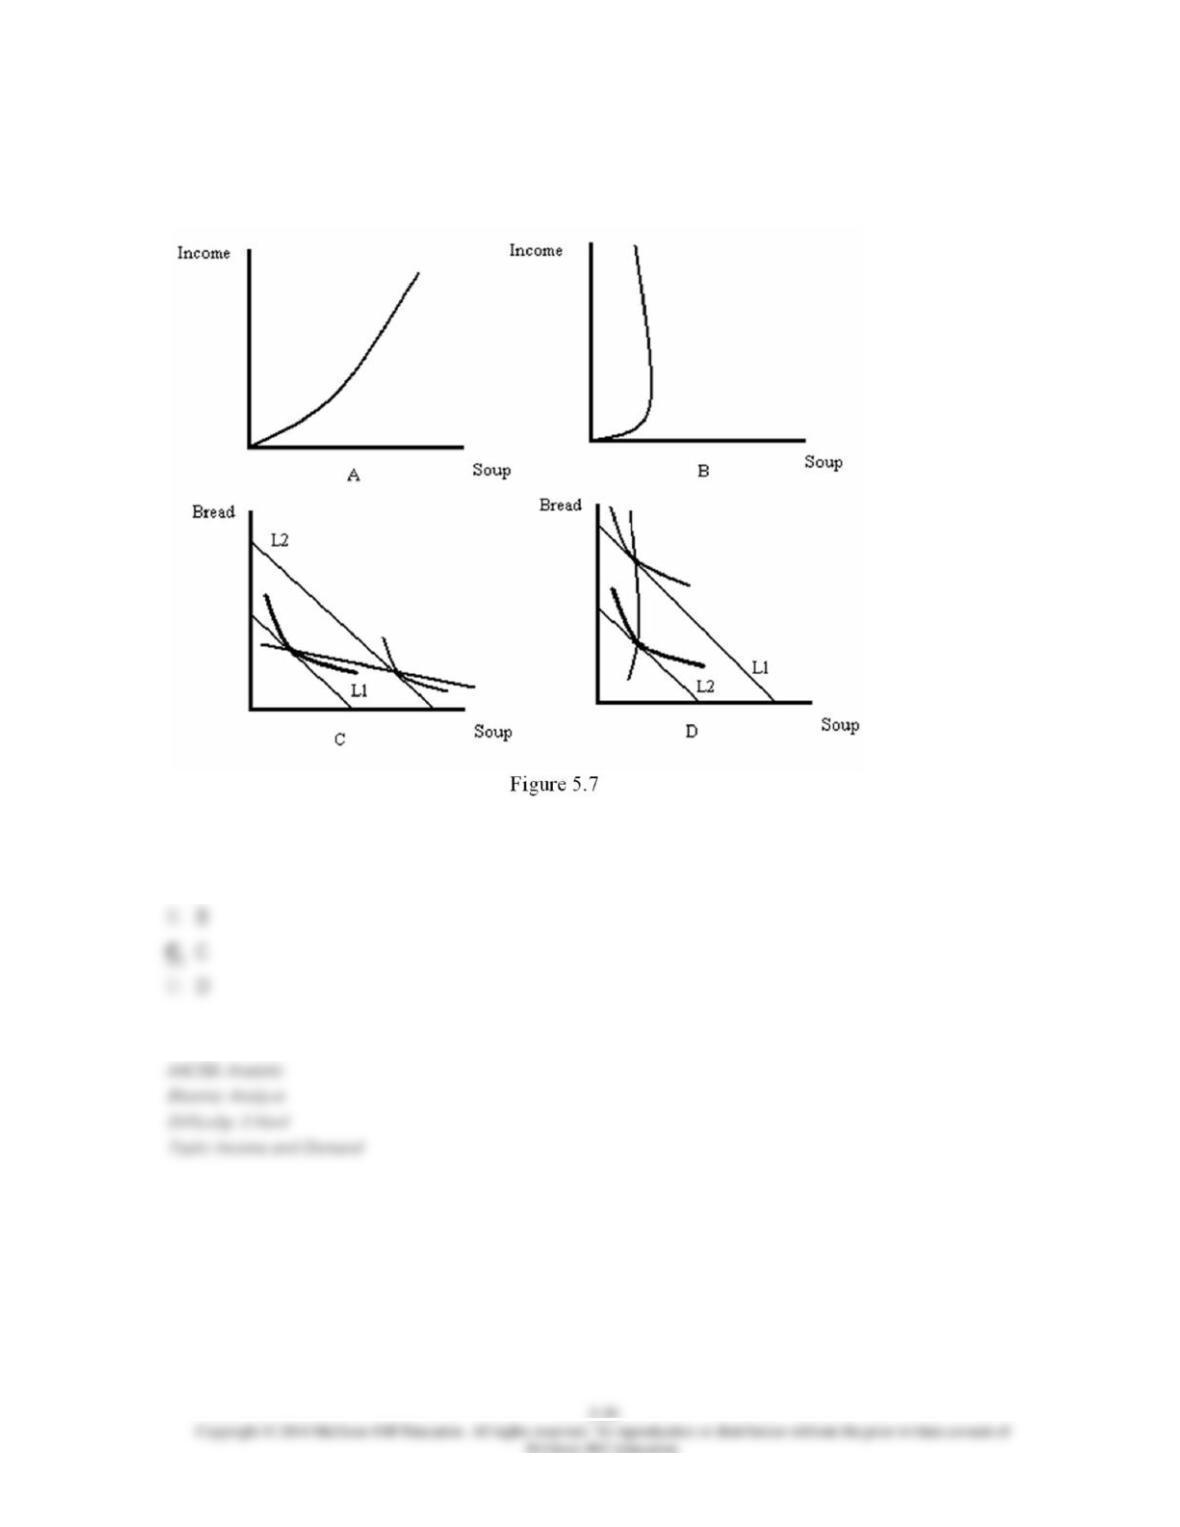
56. Refer to Figure 5.7. Which diagram best represents an income-consumption curve where
soup is a normal good?
A. A
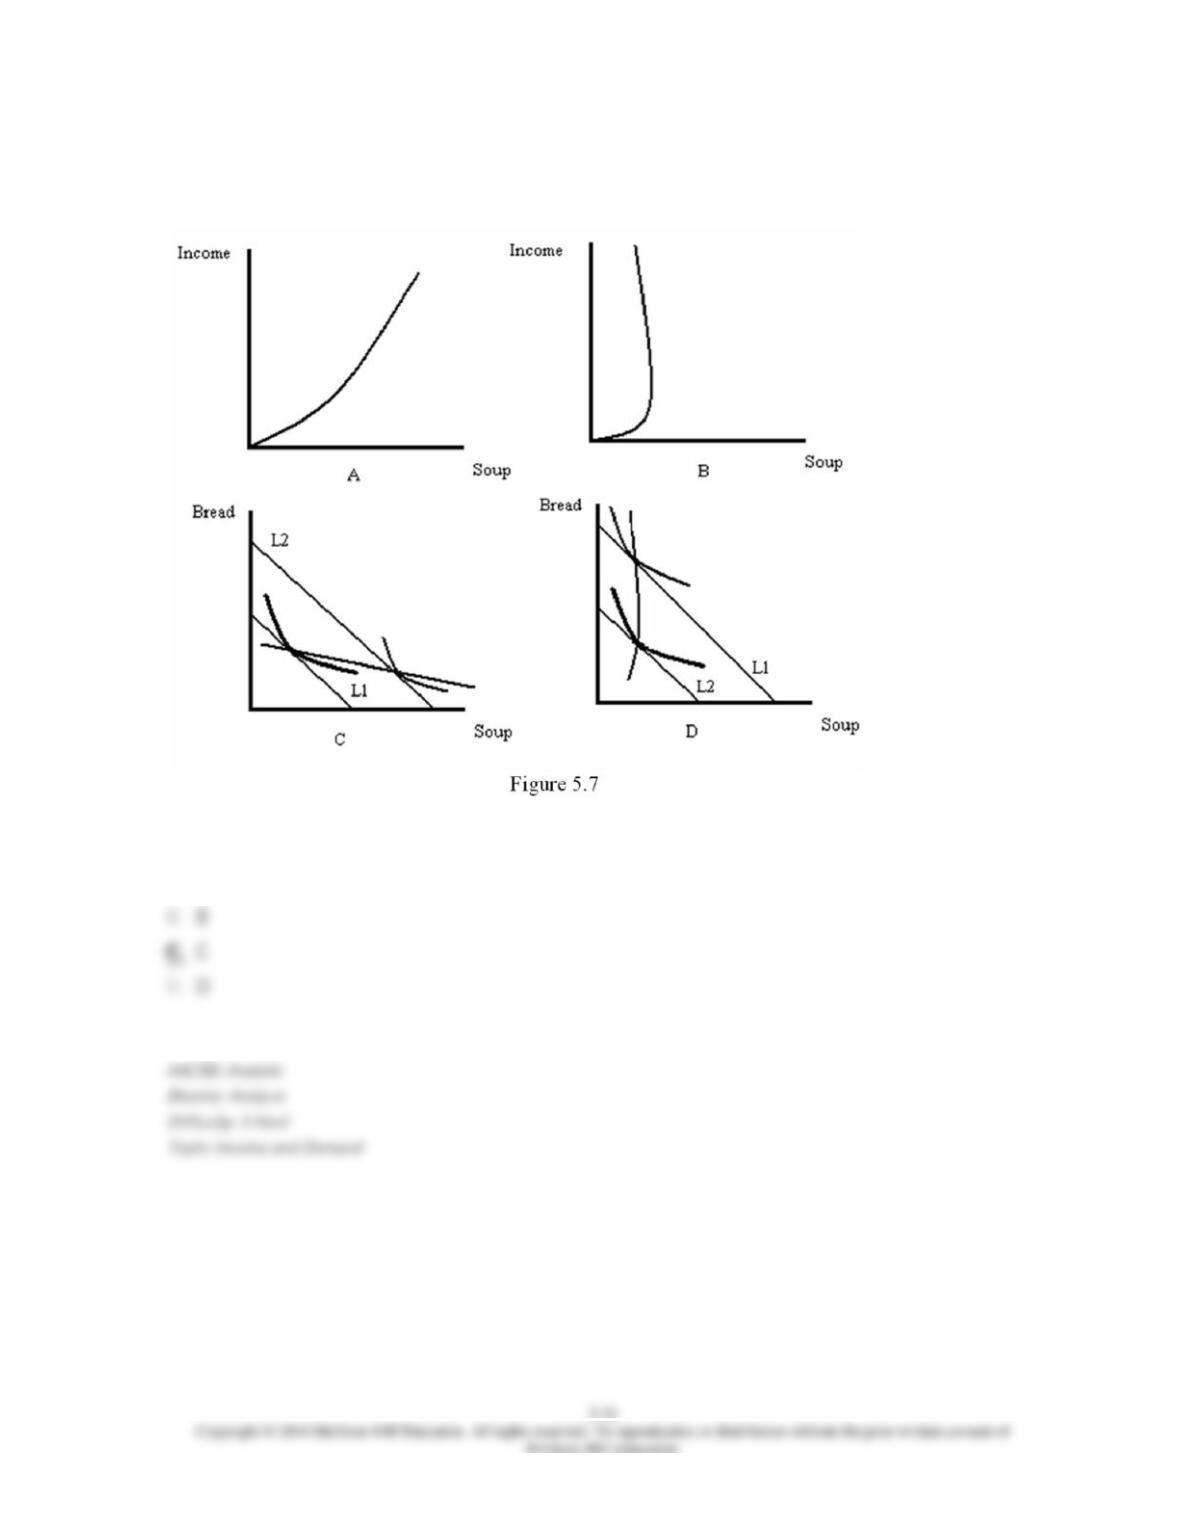
57. Refer to Figure 5.7. Which diagram best represents an income-consumption curve where
bread is an inferior good?
A. A
58. When a good is normal:
D. an increase in income lowers consumption at each price, so the demand curve shifts to the
left.
59. If the price of the good measured on the horizontal axis is subject to volume penalties,
then:
D. the indifference curve will get flatter as the consumer moves along it from left to right.
60. If the price of the good measured on the horizontal axis is subject to volume discounts,
then:
D. the indifference curve will get flatter as the consumer moves along it from left to right.