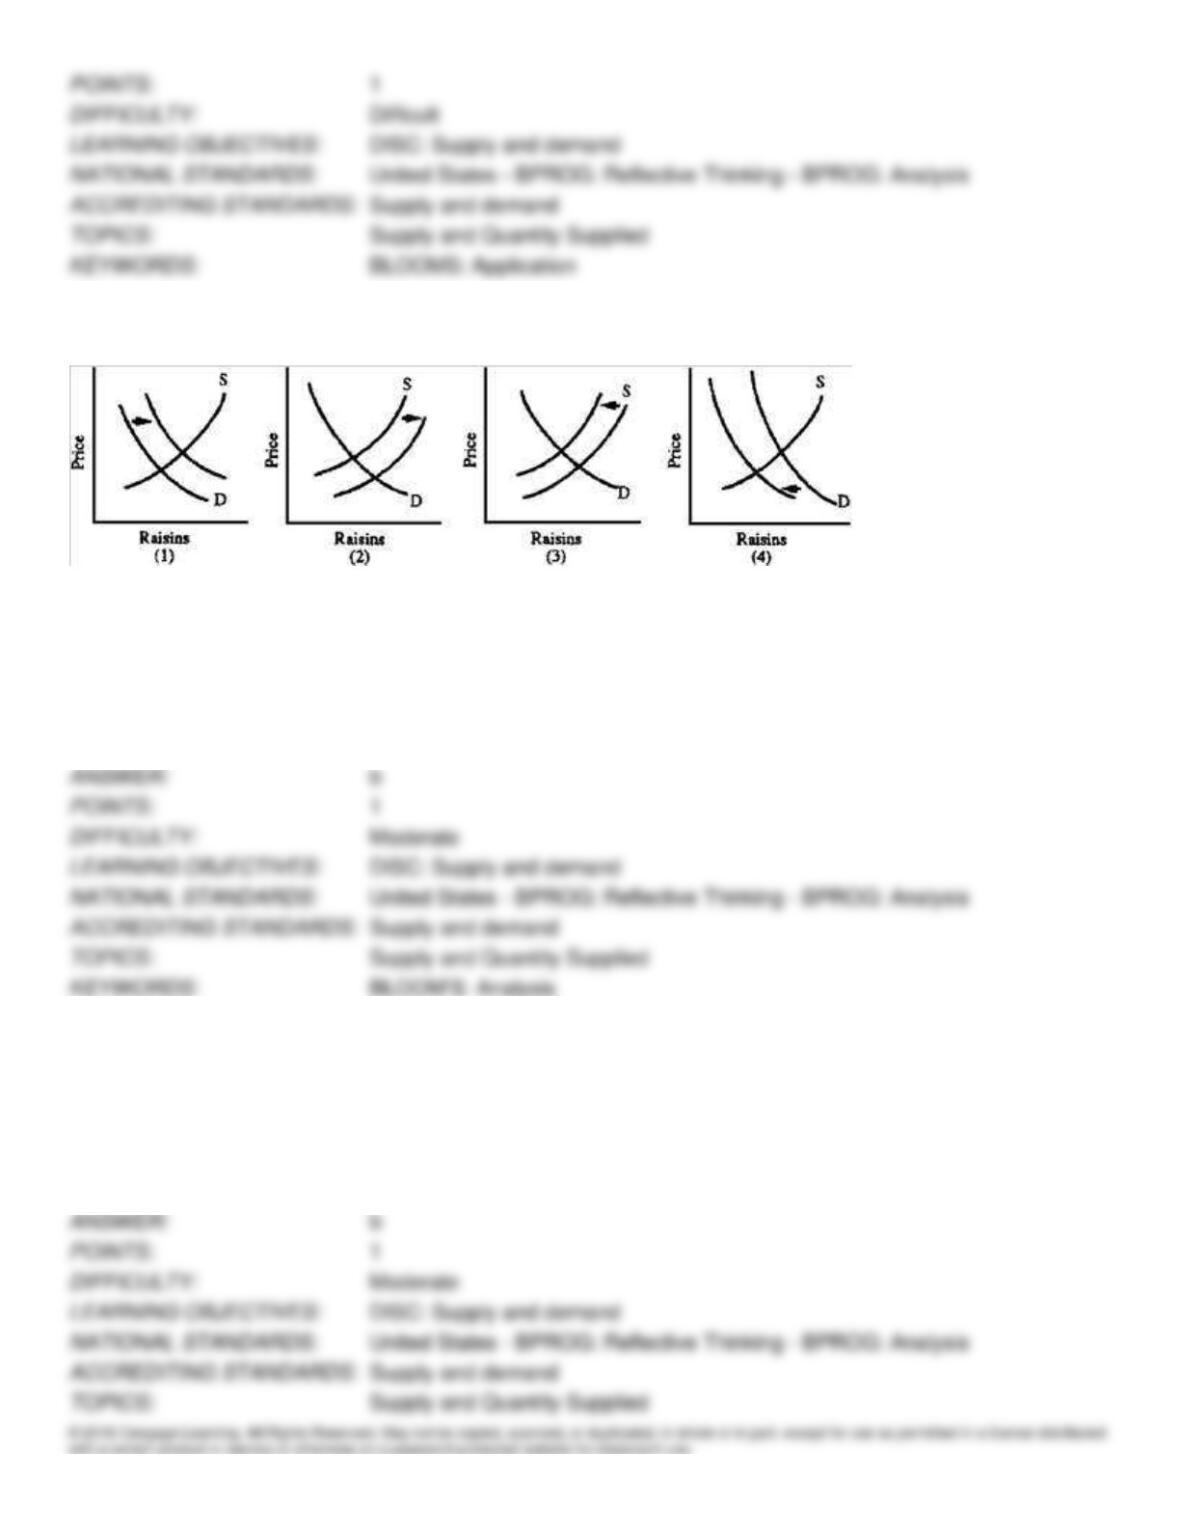
Figure 4-6
196. Grapes can be used for wine or for raisins. Which graph in Figure 4-6 best depicts the effects on the U.S. raisin
market of a decrease in purchases of domestic wines?
a.
1
b.
2
c.
3
d.
4
197. The following price-quantity coordinates for gold used by U.S. dentists were observed: P = $875/ounce, Q =
342,000; P = $200/ounce, Q = 706,000. These points most likely lie along the
a.
supply curve for gold for dental use.
b.
demand curve for dental use.
c.
equilibrium curve for dental use.
d.
production possibilities curve for dental use.
198. How much the quantity of a good traded changes after a shift of the supply curve depends on
a.
the size of the shift.
b.
the slope of the demand curve.
c.
whether the market is subject to price controls.
d.
All of the above are correct.
199. Two studies published in the New England Journal of Medicine link the risk of breast cancer to alcohol consumption.
Young women who have nine drinks per week were reportedly 150 percent more likely to develop breast cancer.
Considering the market for alcohol, an economist would predict a movement
a.
up the demand curve as quantity demanded falls.
b.
up the supply curve as the demand curve shifts.
c.
down the supply curve as the demand curve shifts.
d.
down the demand curve as quantity falls.
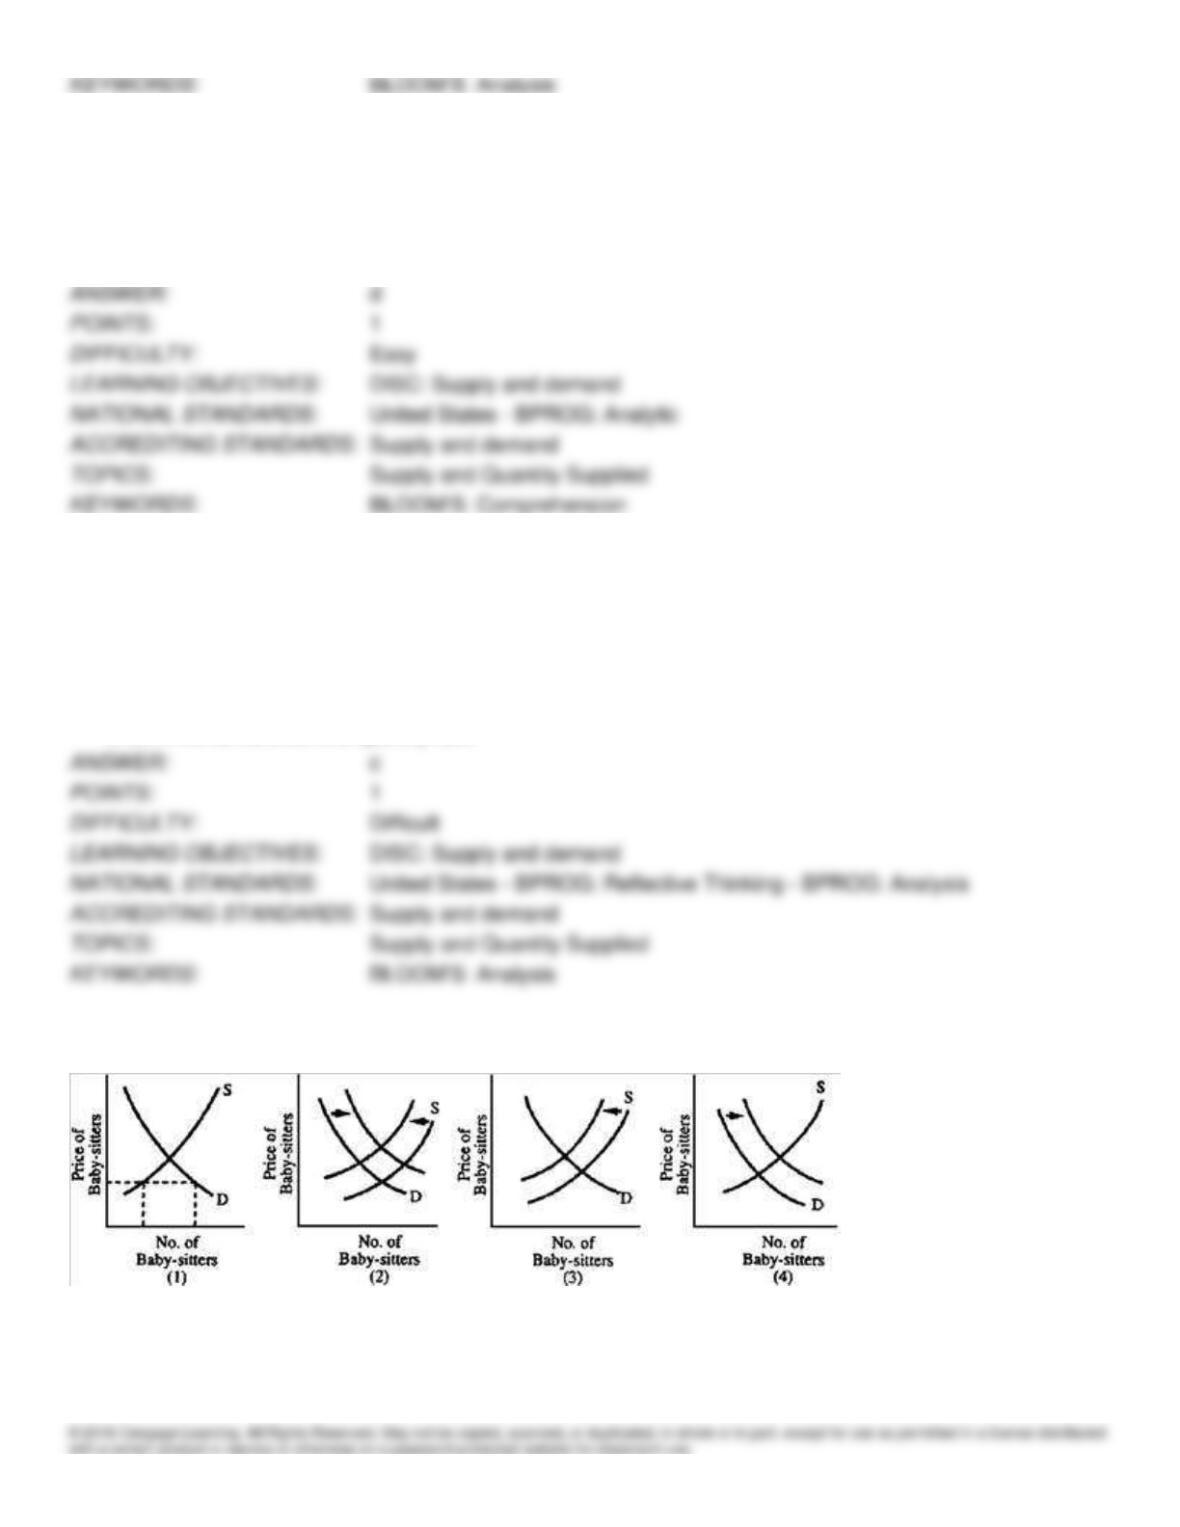
Figure 4-8
200. Women today are having more babies than women did fifteen years ago. The result is that mothers today have
trouble finding baby-sitters and are shocked at what they must pay for child care. Which graph in Figure 4-8 best
illustrates how the situation has changed?
a.
1
b.
2
c.
3
d.
4
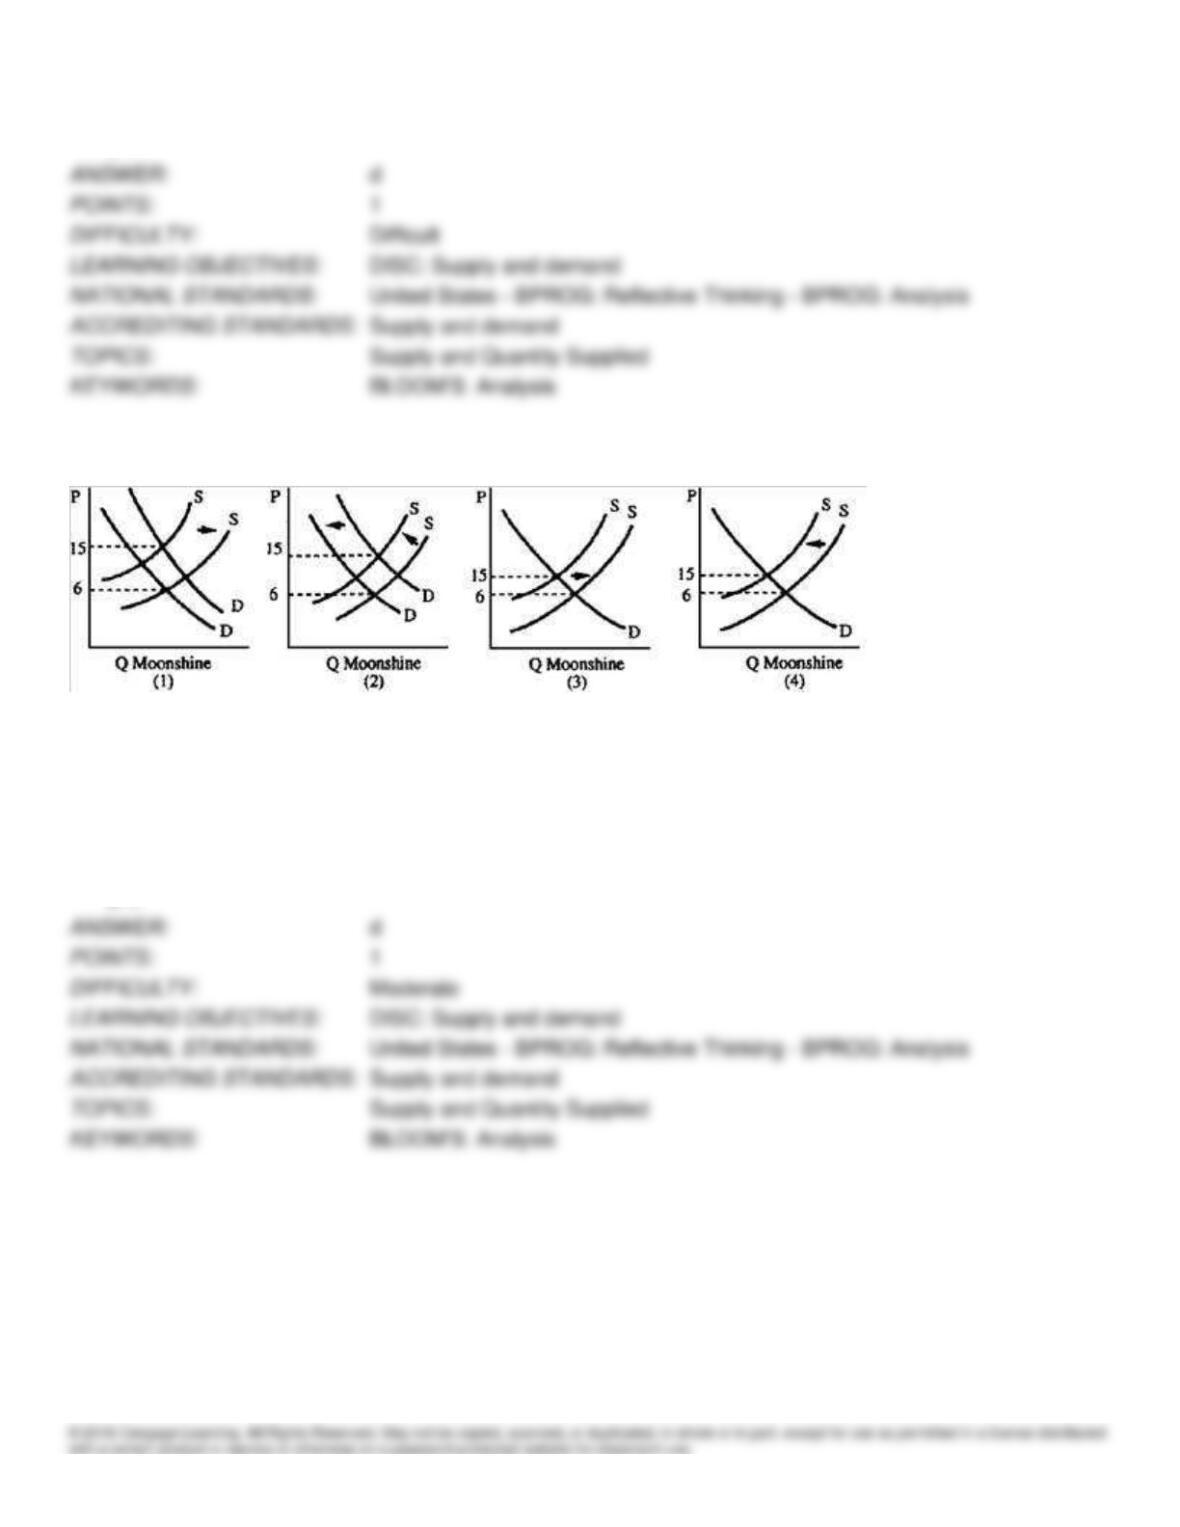
Figure 4-9
201. “Moonshine” is illegal home brew made by adding sugar to accelerate corn fermentation. Ten pounds of sugar are
necessary to make a gallon of moonshine. In the mid-1970s, the price of sugar tripled and the price of moonshine
skyrocketed from $6 to $15 a gallon. Which graph in Figure 4-9 best illustrates this?
a.
1
b.
2
c.
3
d.
4
Figure 4-10
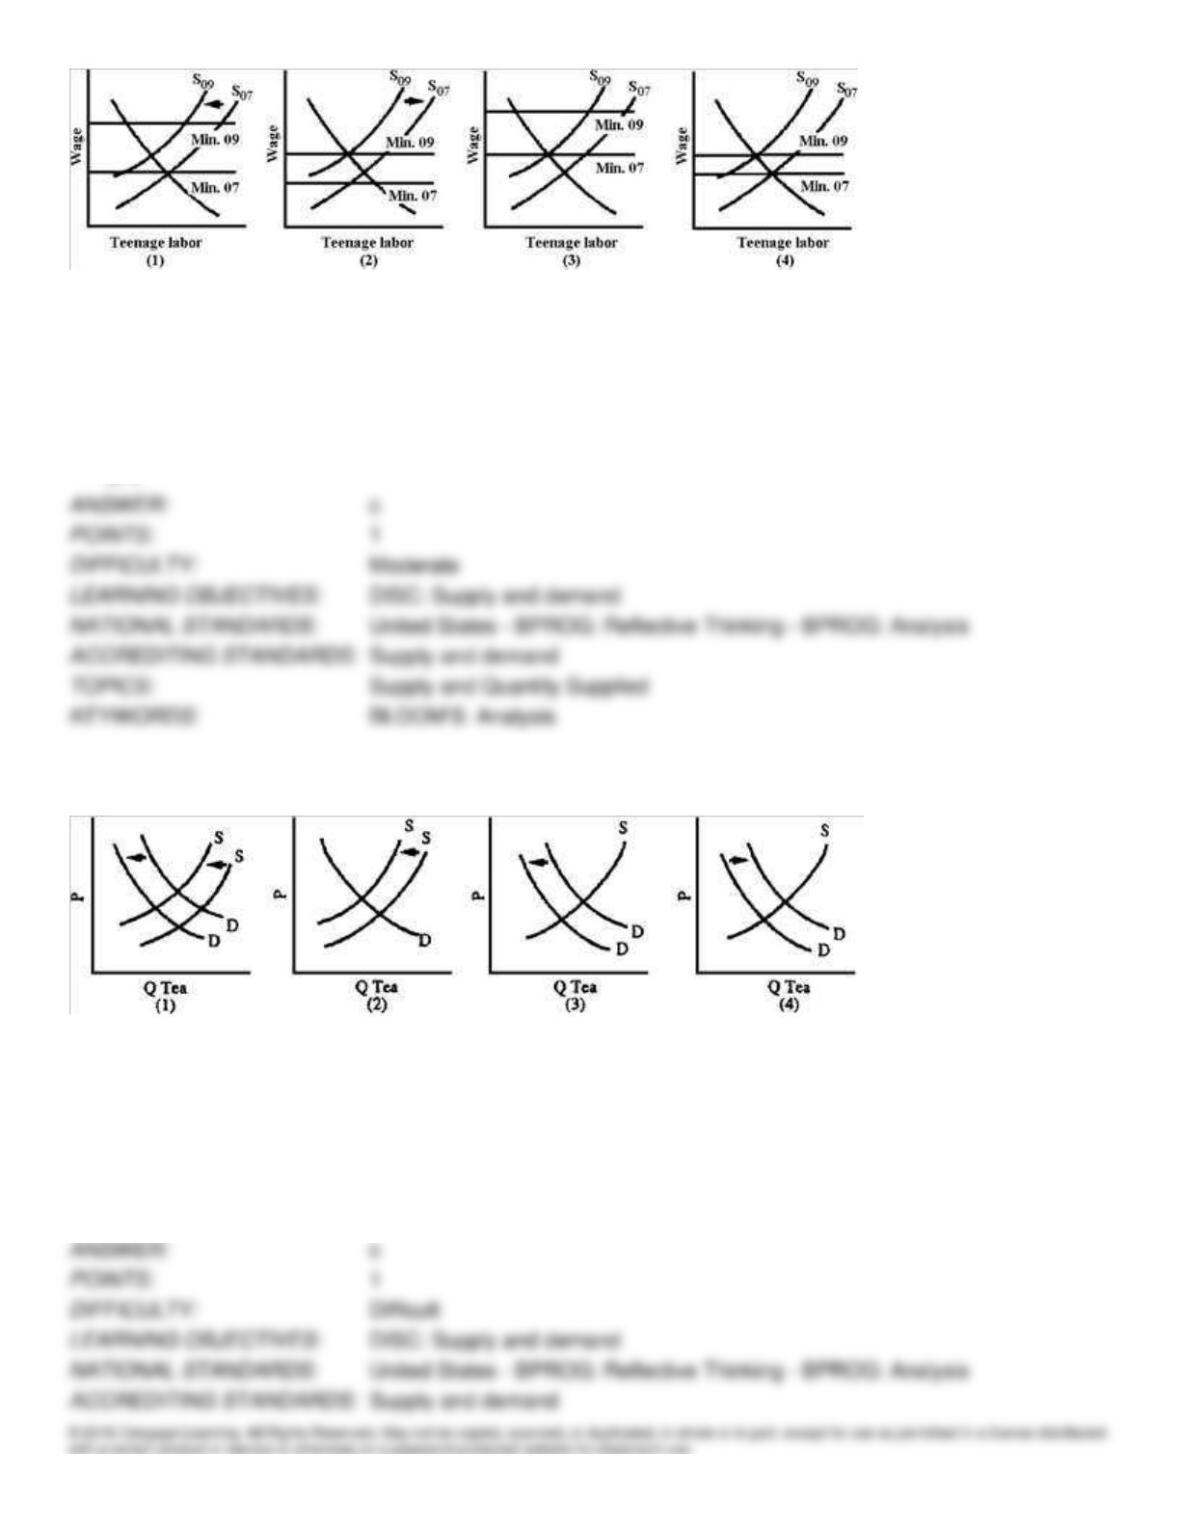
202. The rising minimum wage allegedly has reduced the quantity demanded of teenage labor. However, demographics
slightly reduced the supply of teenage labor. The U.S. Department of Labor reported that teenage unemployment is an
increasing problem. Which graph in Figure 4-10 is consistent with these facts?
a.
1
b.
2
c.
3
d.
4
Figure 4-11
203. The Russian government has restricted sugar availability to reduce the supply of illegal liquor (sugar is used to
increase alcohol content). Russians also like to sweeten their tea with jam, another sugar product. Which graph in Figure
4-11 depicts the impact of sugar rationing on the Russian tea market?
a.
1
b.
2
c.
3
d.
4
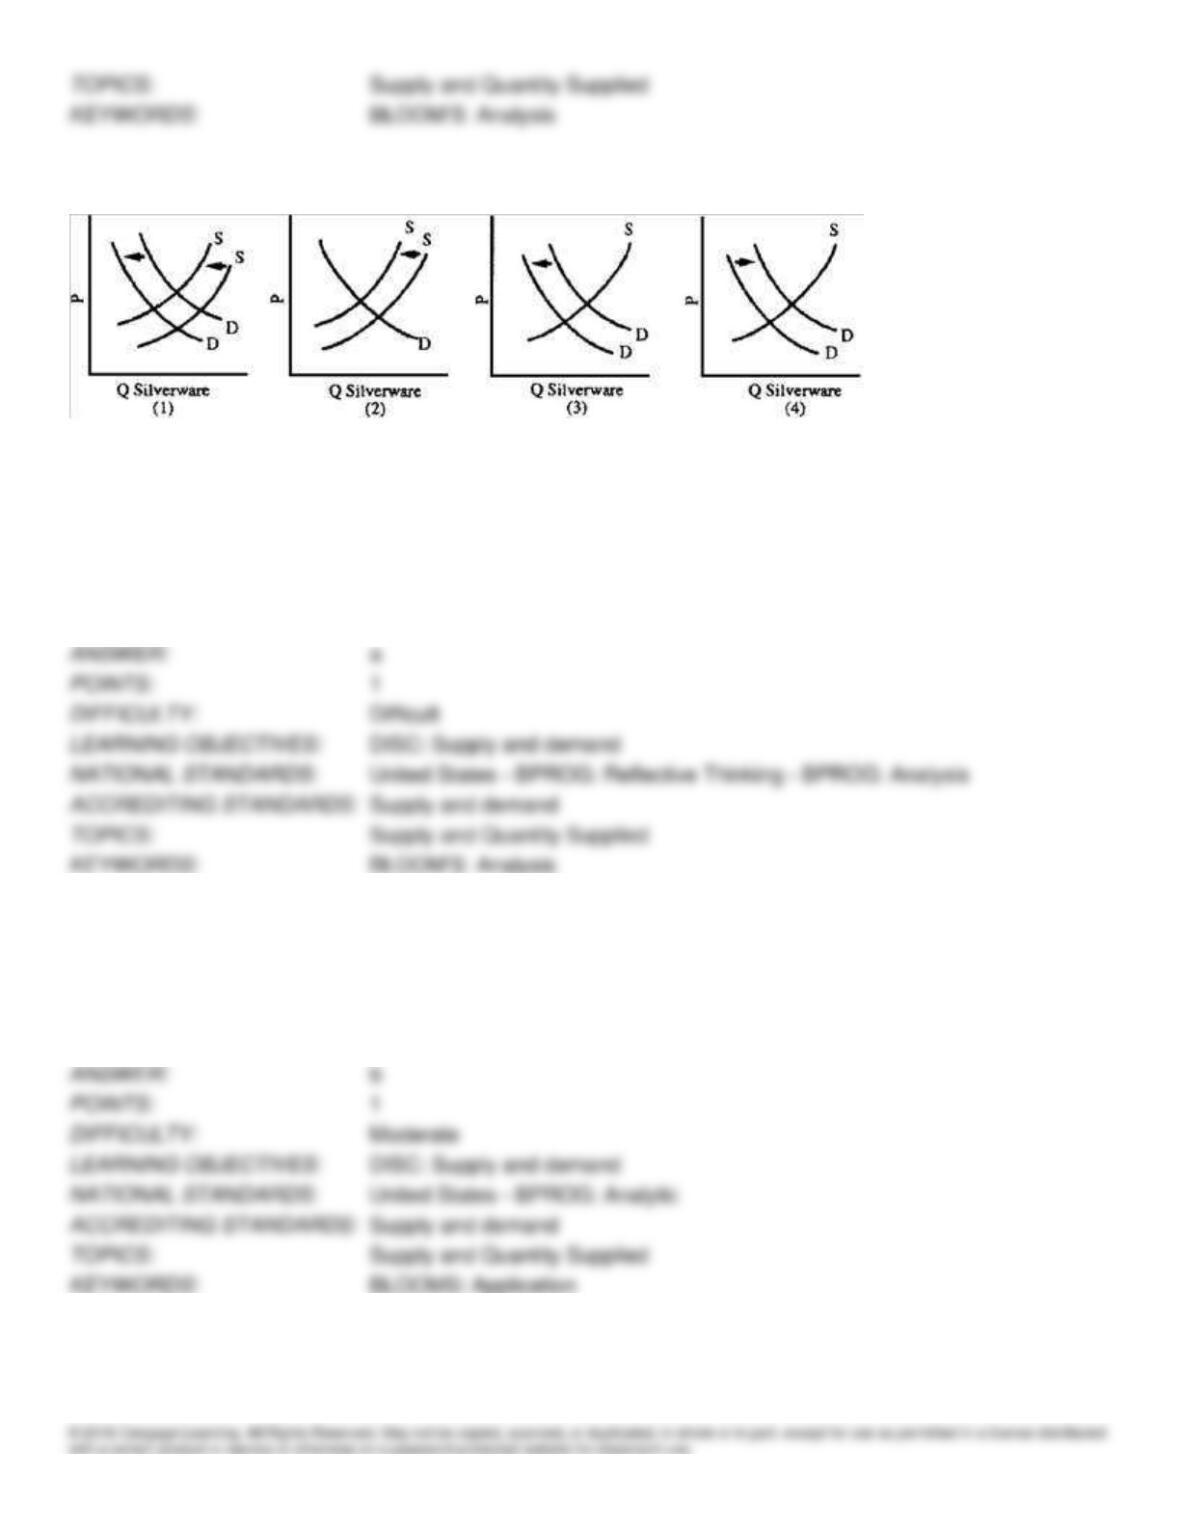
Figure 4-12
204. The silverware industry has been in serious decline since the 1980s. Family dining habits are less formal so people
purchase less silverware. Also, in 2006-2008, the price of silver increased from $5 to $20 per ounce. Which graph in
Figure 4-12 best illustrates these developments?
a.
1
b.
2
c.
3
d.
4
205. Normally an increase in the supply of a good will cause
a.
a shift of consumer preferences in favor of that good.
b.
consumers to use more of that good and less of others.
c.
a shift of consumer preferences away from that good.
d.
consumers to use less of that good and more of others.
206. Studies at Cornell University revealed that chickens grow 2 percent larger when a red mitten is placed in their cage
and Vivaldi is played in the coop. Resultant feed savings are estimated at $60 million a year. In the chicken market, the
a.
demand curve shifts to the right.
b.
supply curve shifts to the right.
c.
price will rise.
d.
quantity sold will fall.
207. The price of gasoline has risen and the quantity sold has fallen. This was likely caused by
a.
a rise in the price of crude oil.
b.
a seasonal rise in the demand for gasoline.
c.
use of a new public transit system.
d.
the discovery of crude oil in New Jersey.
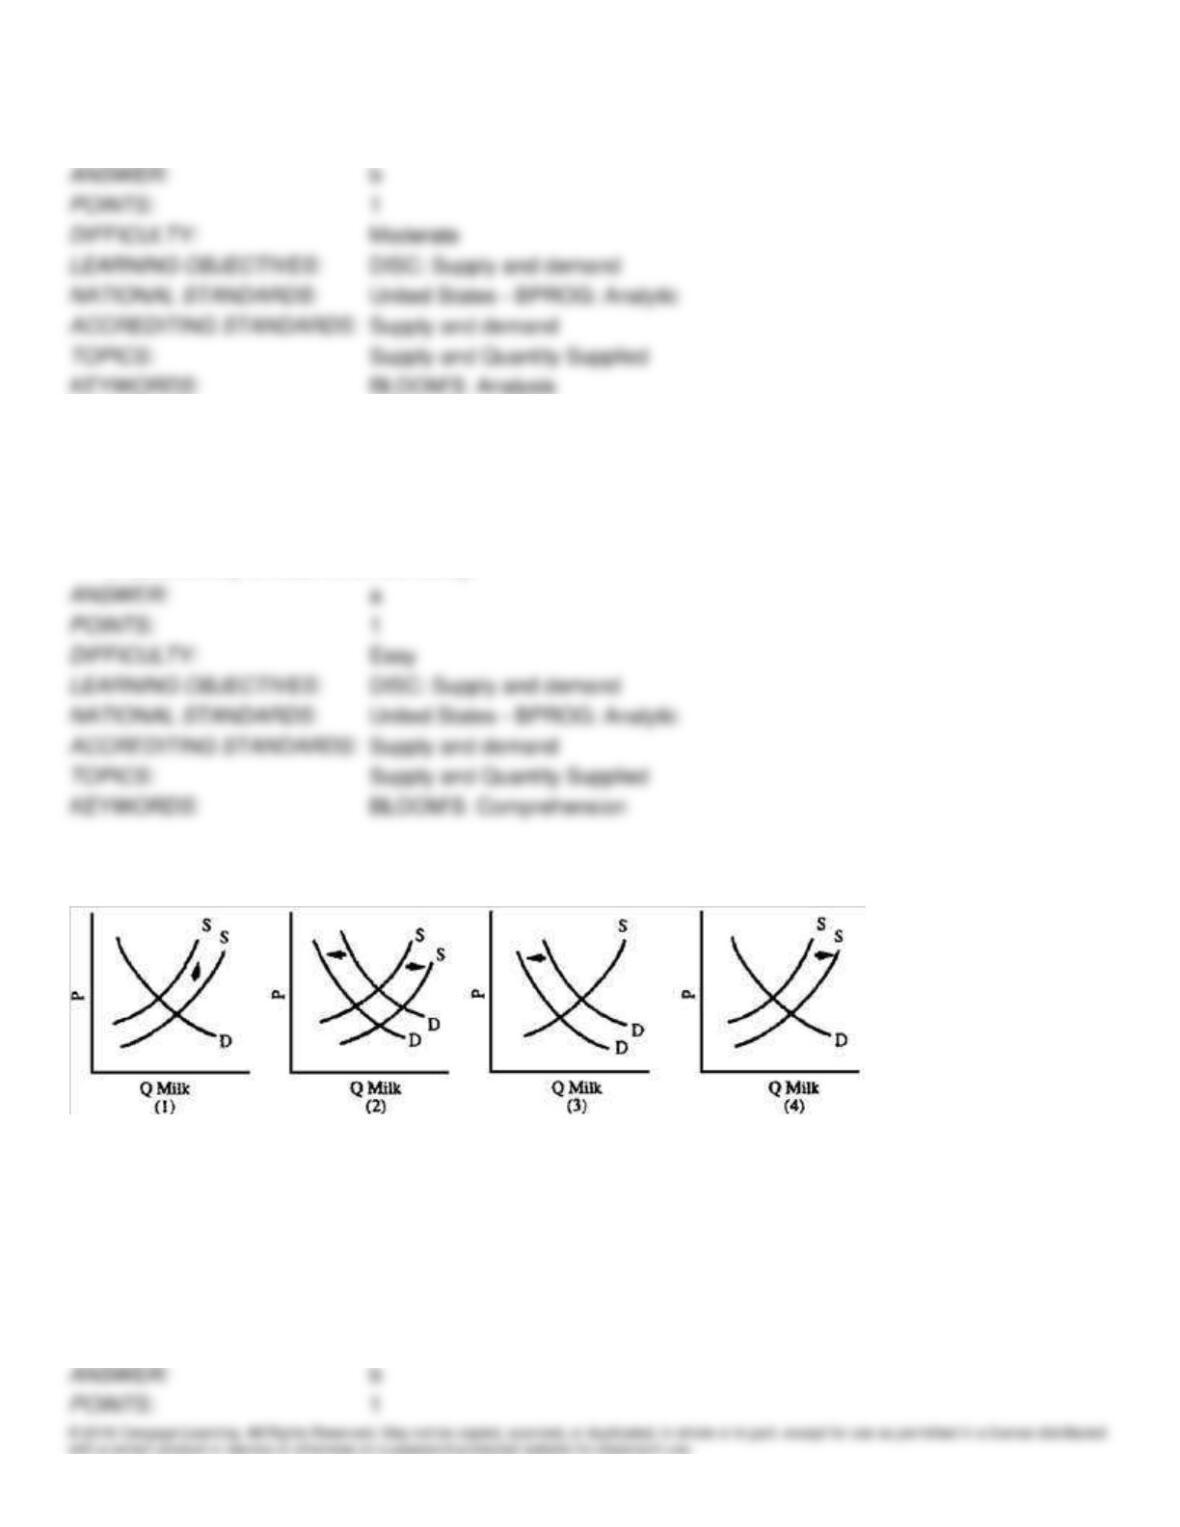
Figure 4-13
208. The drug BGH (bovine growth hormone) dramatically increases the milk output of dairy cows. Farmers in
Wisconsin, a big dairy state, vigorously oppose licensing the drug, fearing that excess supply and a consumer reaction on
the purity of food issue will put many of them out of business. Which graph in Figure 4-13 best illustrates the farmers’
fears?
a.
1
b.
2
c.
3
d.
4
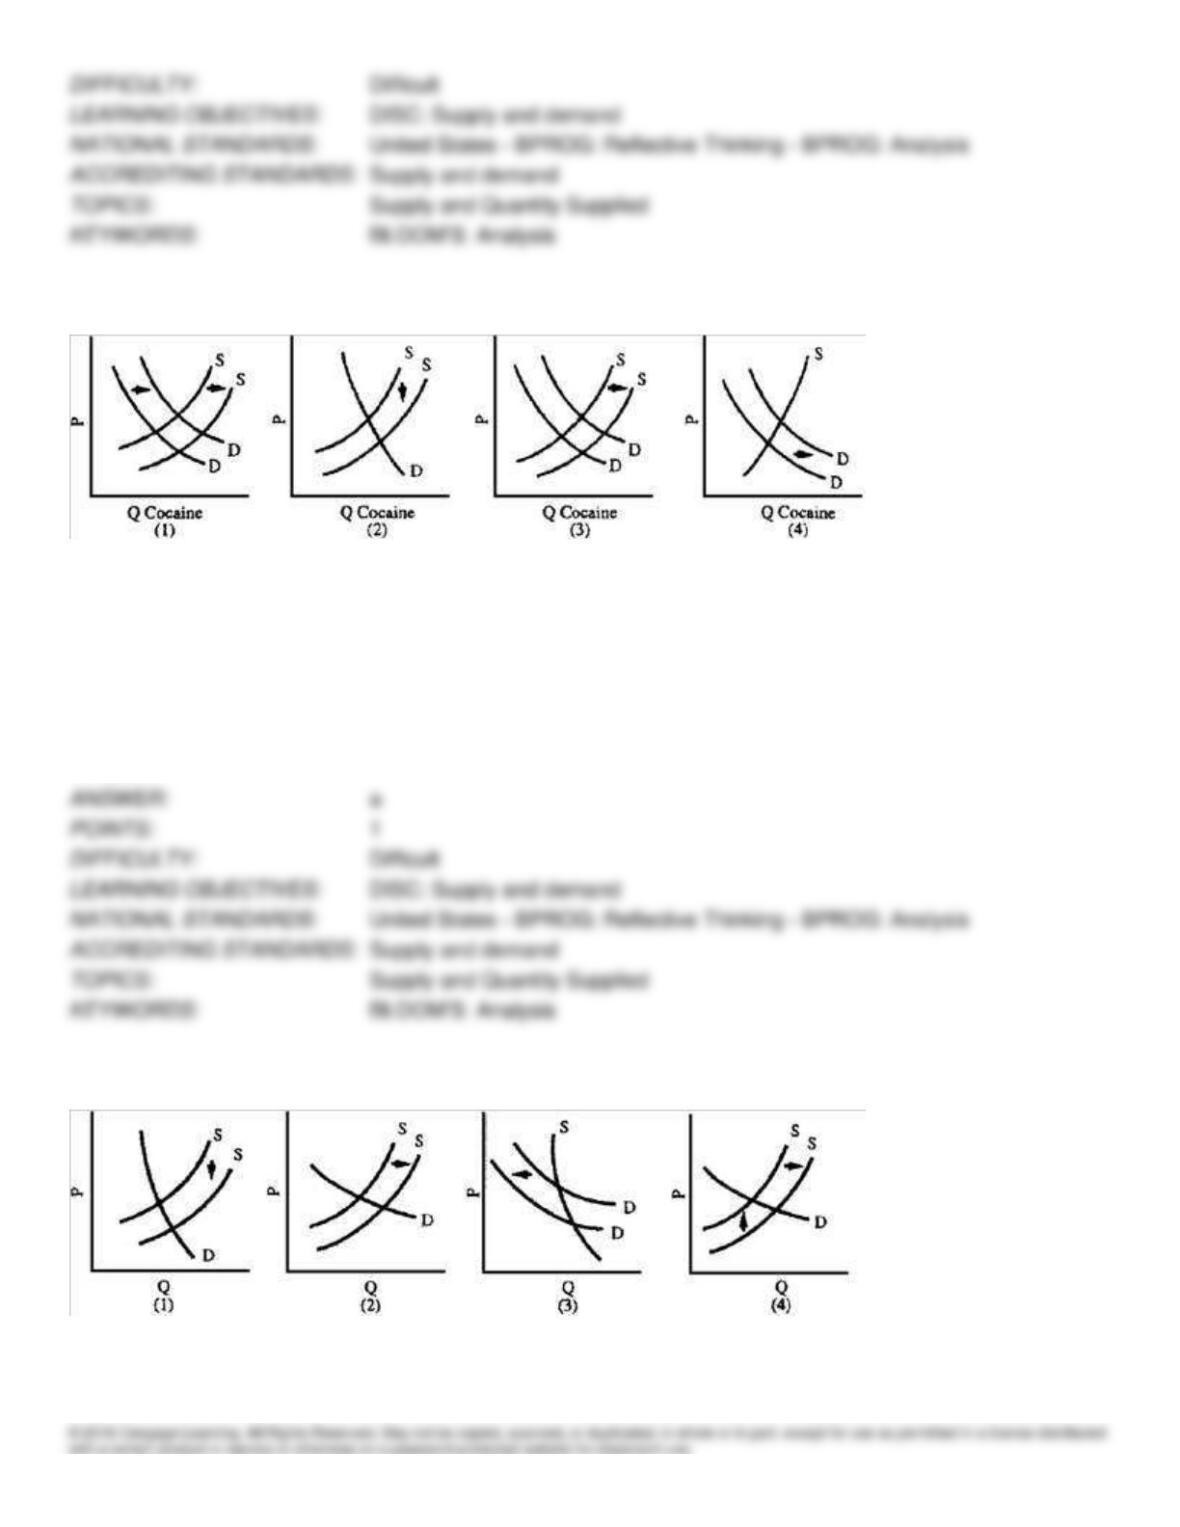
Figure 4-14
209. Frustrated by the cost and ineffectiveness of the war on drugs, the U.S. government could consider
“decriminalization” of the use and sale of cocaine. Critics contend that lower prices will expand drug use and that
decriminalization will remove the stigma and danger from arrest associated with drug use, thus further increasing the
demand and number of addicts. Which graph in Figure 4-14 best illustrates the critics’ case?
a.
1
b.
2
c.
3
d.
4
Figure 4-15
210. Recycling of newspapers has been undermined by its success. The supply of old papers, gathered diligently by those
concerned with the environment, has increased dramatically, as has the number of firms that convert the material into
recycled newsprint. The quantity demanded has remained relatively stable despite falling prices because newspapers
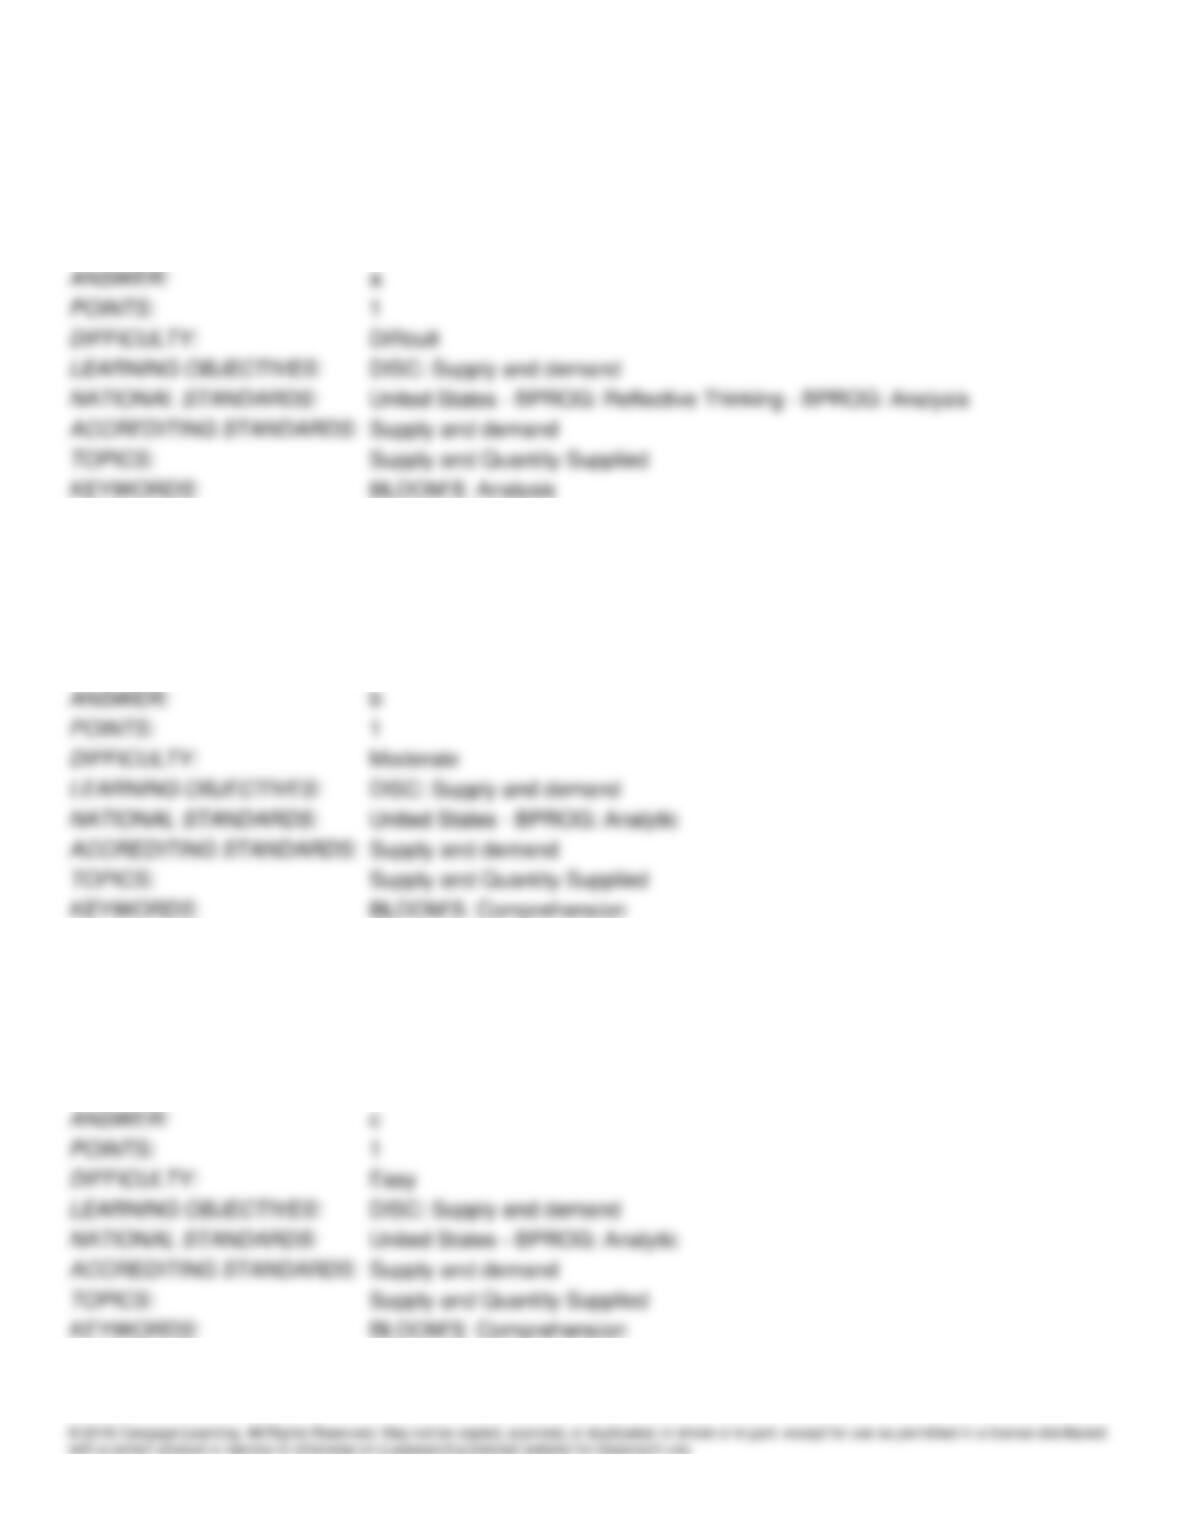
consider recycled newsprint an inferior substitute for regular newsprint. Consequently, the price of recycled newsprint has
fallen below the cost of production; recycling firms are going out of business; mountains of old newspapers are left
behind. Which graph in Figure 4-15 best illustrates this situation?
a.
1
b.
2
c.
3
d.
4
211. If both the supply and demand curves shift to the left, then we can conclude that there will be
a.
an increase in the equilibrium quantity sold.
b.
a decrease in the equilibrium quantity sold.
c.
an increase in the equilibrium price.
d.
a decrease in the equilibrium price.
212. How will a decrease in price tend to affect supply?
a.
Supply will increase.
b.
Supply will decrease.
c.
Supply will not change.
d.
Uncertain.
213. American consumers decide to boycott grapes in support of the farm workers’ union. Everything else being equal, the
a.
price of grapes will rise.
b.
supply of grapes will fall.
c.
quantity supplied of grapes will fall.
d.
demand curve for grapes will shift to the right.
214. The cost of processors and memory has decreased dramatically in the past twenty-five years. As a result, we have
seen
a.
an increase in demand.
b.
an increase in supply.
c.
a decrease in demand.
d.
a decrease in supply.
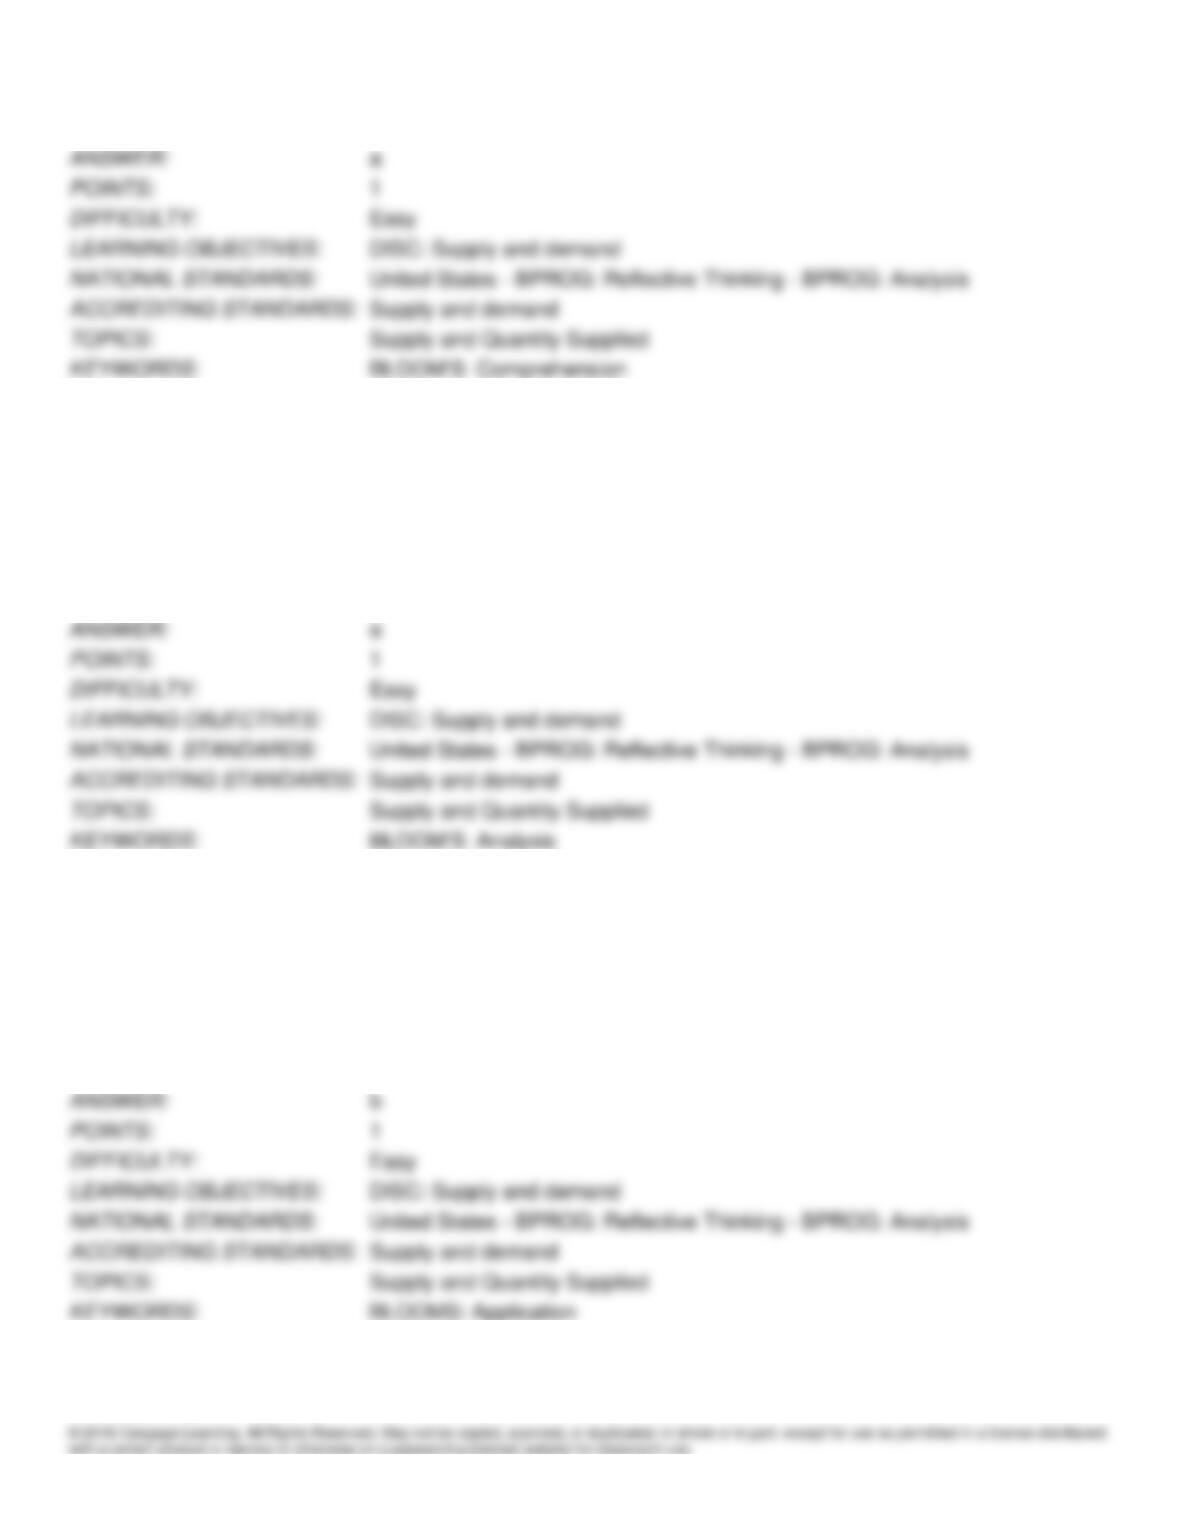
Figure 4-16
215. In Figure 4-16, an increase in the number of producers will shift supply from
a.
S1 to S2.
b.
S2 to S1.
c.
S3 to S2.
d.
S3 to S1.
216. Assume that Figure 4-16 shows the supply of orange juice. A decrease in the wage rate paid to workers in the orange
juice industry will shift supply from
a.
S1 to S2.
b.
S2 to S1.
c.
S3 to S2.
d.
S3 to S1.
217. Assume that Figure 4-16 shows the supply of soda. An increase in the price of syrup used in the production of soda
will shift supply from
a.
S1 to S2.
b.
S2 to S1.
c.
S2 to S3.
d.
S1 to S3.
218. Assume that Figure 4-16 shows the supply of steak. An increase in the price of pork will change the supply from
a.
S1 to S2.
b.
S2 to S1.
c.
S2 to S3.
d.
S1 to S3.
219. Assume that Figure 4-16 shows the supply of new houses. An improvement in the technology for building houses
will shift supply from
a.
S1 to S2.
b.
S2 to S1.
c.
S3 to S2.
d.
S3 to S1.
220. An increase in supply will have what effect on equilibrium price and quantity?
a.
Price will increase; quantity will decrease.
b.
Price will decrease; quantity will increase.
c.
Both price and quantity will increase.
d.
Both price and quantity will decrease.
221. A decrease in supply will have what effect on equilibrium price and quantity?
a.
Price will increase; quantity will decrease.
b.
Price will decrease; quantity will increase.
c.
Both price and quantity will increase.
d.
Both price and quantity will decrease.
222. Are markets always in equilibrium?
a.
Yes, they are always at the equilibrium point, or very close to it.
b.
Yes, because few things tend to alter supply and demand.
c.
No, but if there is no interference, they tend to move toward equilibrium.
d.
No, they never “settle down” into a stable price and quantity.
e.
Uncertain, economic theory has no answer to this question.
223. Which of the following is the correct way to describe equilibrium in a market?
a.
At equilibrium, demand equals supply.
b.
At equilibrium, quantity demanded equals quantity supplied.
c.
At equilibrium, market forces are no longer at work.
d.
Equilibrium is a tendency, a state of perpetual motion.
e.
Equilibrium is the best combination of price and quantity.
Figure 4-18
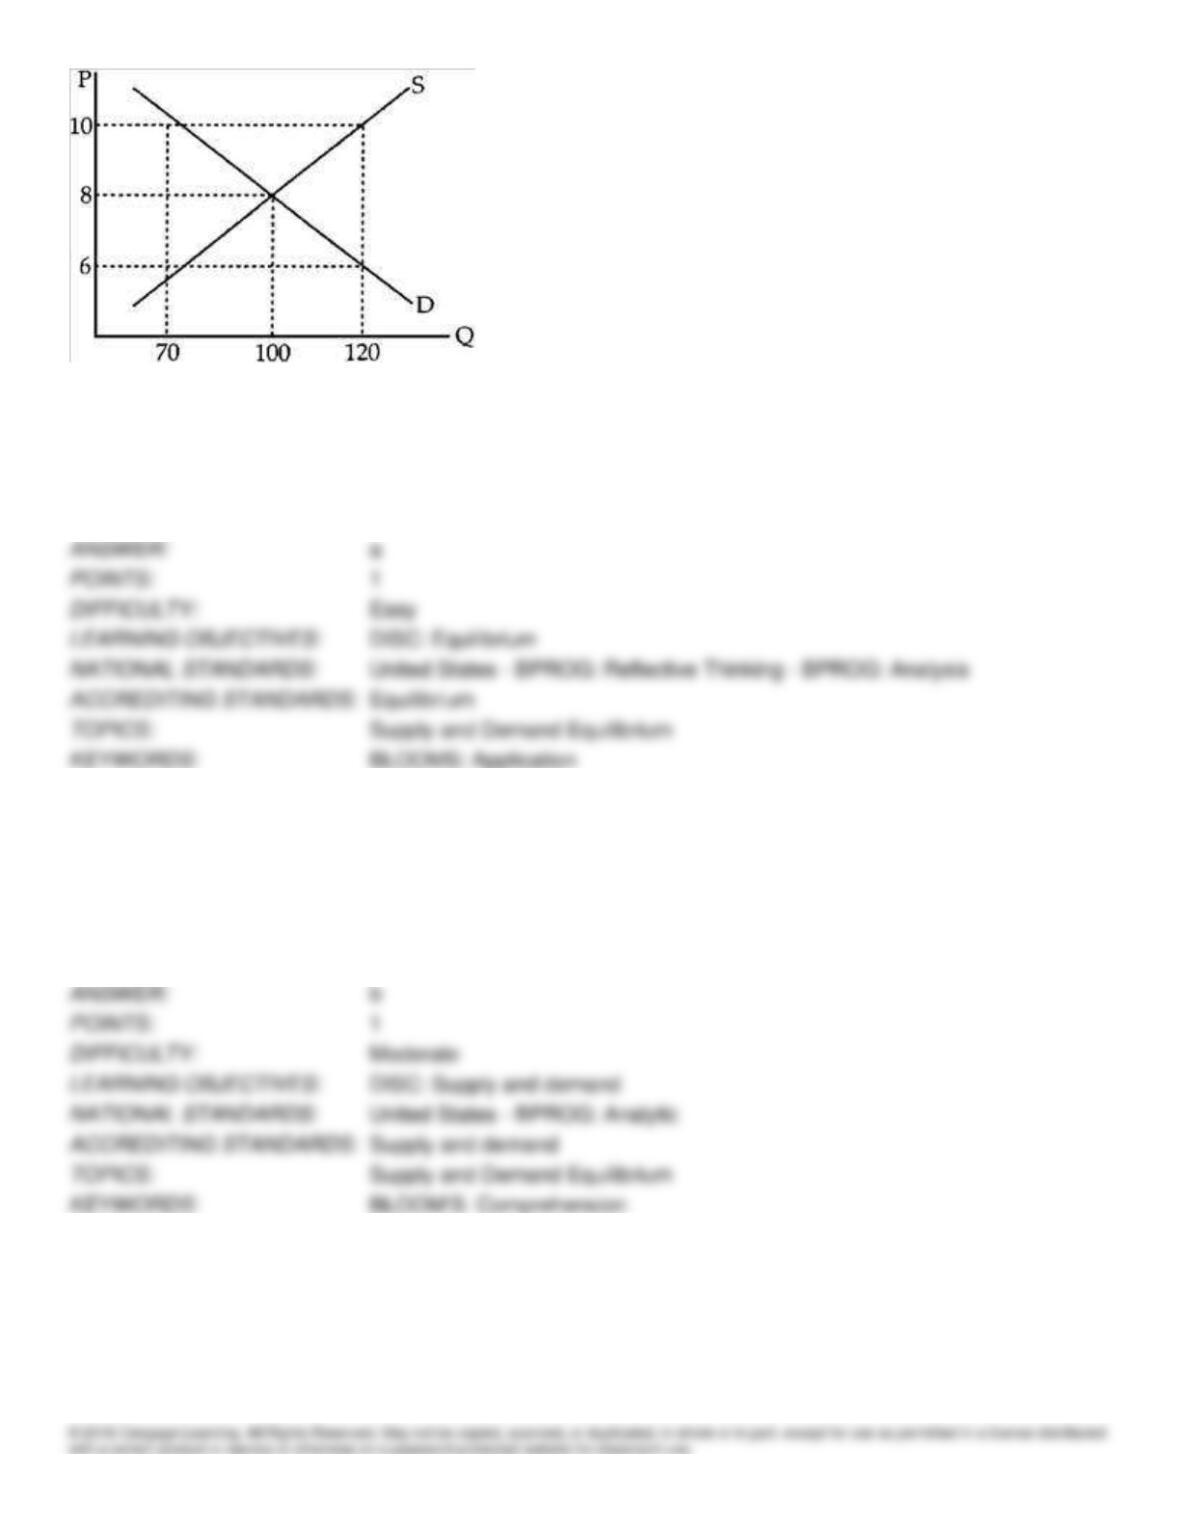
224. In Figure 4-18, there would be a surplus of T-shirts if the price were
a.
$10.
b.
$8.
c.
below $8.
d.
between $8 and $6.
225. On a traditional supply and demand diagram,
a.
price is measured along the horizontal axis and quantity along the vertical axis.
b.
price is measured along the vertical axis and quantity along the horizontal axis.
c.
quantity demanded is measured along the horizontal axis, quantity supplied is measured along the vertical
axis, and price is indicated on the contour lines.
d.
quantity is measured along both axes and price is indicated on the contour lines.
226. An increase in the number of nursing homes and community health centers and the expansion of home care has led to
an increase in the demand for nurses. At the same time, improving opportunities for women in business have reduced the
supply of nurses. Hospitals, the major employers of nurses, have resisted wage increases. The resulting situation could be
described as
a.
the cost disease of the service sector.
b.
a shortage of nurses.
c.
the problem of auxiliary restrictions.
d.
the wage floor problem.
227. At an equilibrium price for gasoline,
a.
everyone with the desire and the income to buy gasoline at that price can do so.
b.
surpluses are inevitable.
c.
inherent market forces will eventually change the quantities demanded and supplied.
d.
suppliers must be using the most efficient oil-drilling equipment available.
228. At an equilibrium price, quantity demanded
a.
exceeds quantity supplied.
b.
equals quantity supplied.
c.
is less than quantity supplied.
d.
Any of the above is possible.
229. The ____ the demand curve for a good, the ____ the change in equilibrium quantity after a shift of the supply curve.
a.
flatter; greater
b.
flatter; smaller
c.
farther from the origin at every output level; greater
d.
farther from the origin at every output level; smaller
230. A market will experience a ____ when the price is above equilibrium and a ____ when the price is below
equilibrium.
a.
shortage, shortage
b.
surplus, surplus
c.
shortage, surplus
d.
surplus, shortage
231. The amount of a good sold in a market at a particular price cannot exceed the quantity
a.
demanded at that price.
b.
supplied at that price.
c.
sold when there is a price floor.
d.
sold when there is a price ceiling.
Figure 4-19
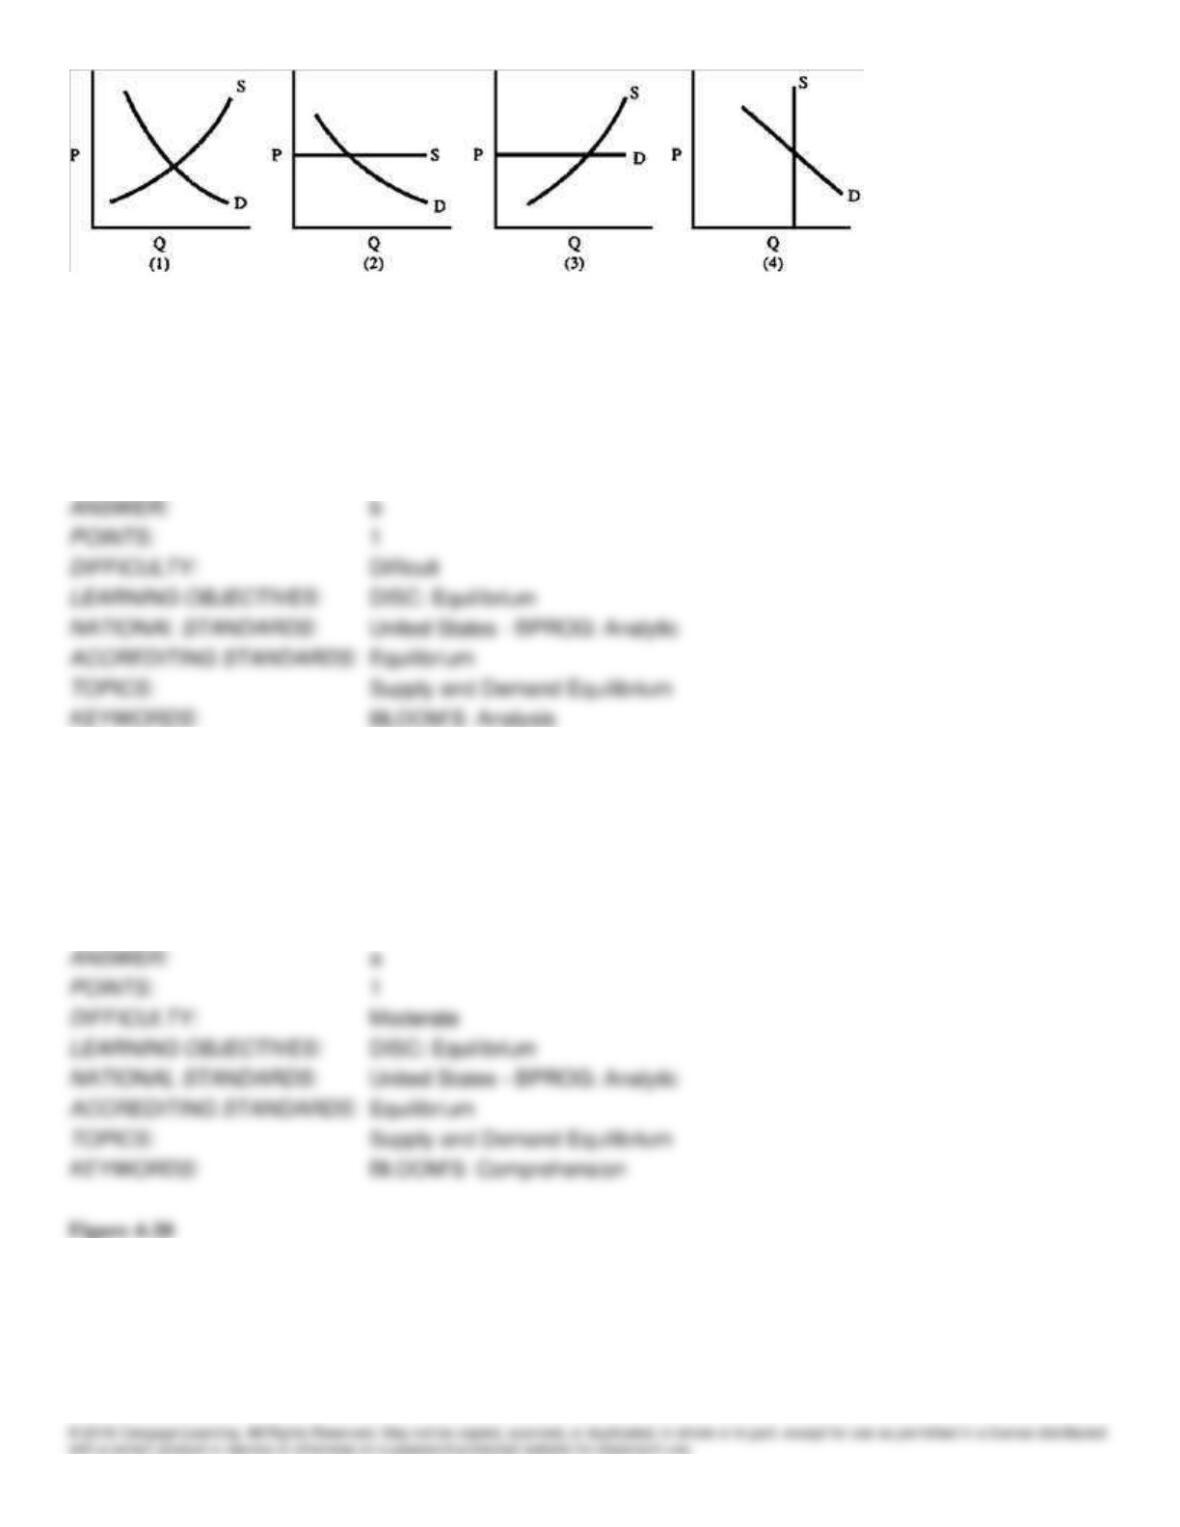
232. After a strike against the Financial News in London began, the number of copies of the competing Broad Street
Journal sold in England increased dramatically, yet there was no increase in price. Which supply and demand graph in
Figure 4-19 represents the situation for the Broad Street Journal before the strike started?
a.
1
b.
2
c.
3
d.
4
233. Equilibrium in a market is
a.
a situation in which there are no inherent forces that produce change.
b.
the natural state of affairs in the market.
c.
the actual price and quantity that will exist in a market.
d.
the best price and quantity that can exist in a market.
e.
All of the above are correct.
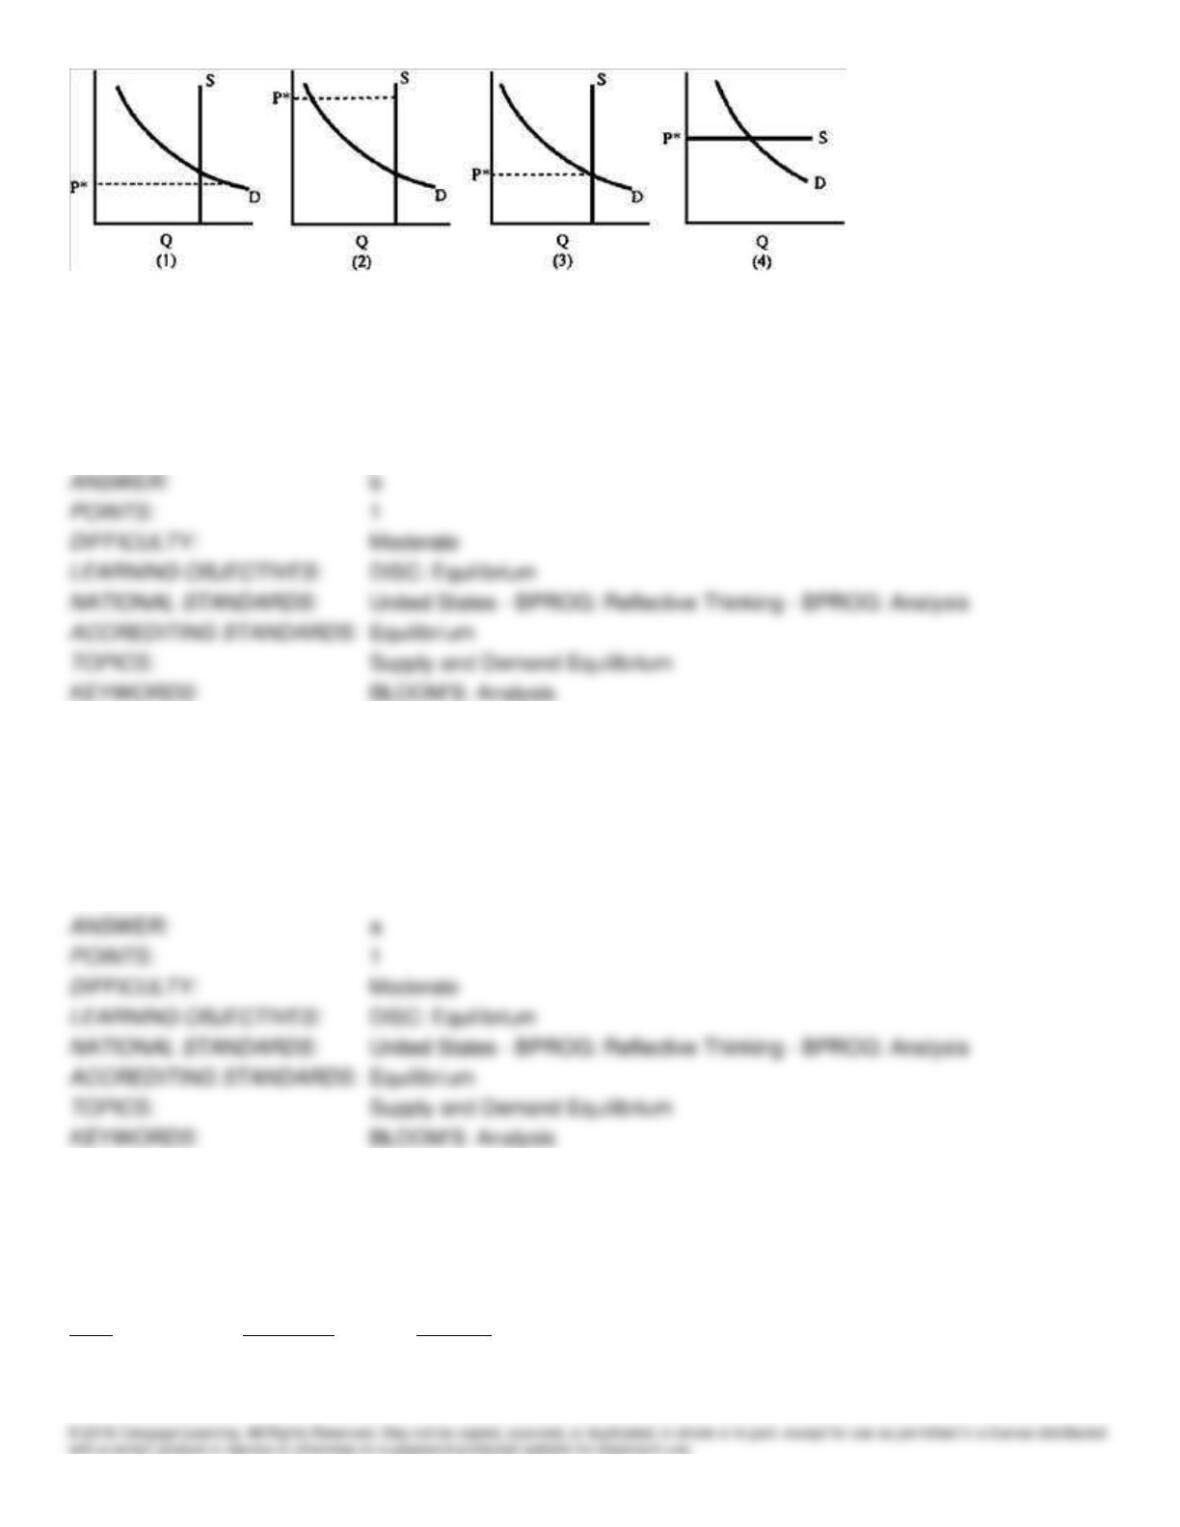
234. If there are empty seats at the university basketball game when the price per ticket is P*, then this situation can best
be represented by which graph in Figure 4-20?
a.
1
b.
2
c.
3
d.
4
235. The presence of scalpers (people selling tickets at a price above the quoted price, P*) at a recent Super Bowl game
suggests that the market for stadium seats could be represented by which graph in Figure 4-20?
a.
1
b.
2
c.
3
d.
4
Table 4-1
Use this table for the following questions.
Quantity
Quantity
Price
Demanded
Supplied
$10
1,000
5,500
9
2,000
5,000
8
3,000
4,500
7
4,000
4,000
6
5,000
3,500
5
6,000
3,000
4
7,000
2,500
3
8,000
2,000
2
9,000
1,500
1
10,000
1,000
236. Refer to Table 4-1. What is the equilibrium price in the example above?
a.
$9
b.
$8
c.
$7
d.
$6
e.
$5
237. Refer to Table 4-1. At $10, what is the surplus?
a.
4,500
b.
3,000
c.
1,500
d.
0
238. Refer to Table 4-1. At $4, what is the shortage?
a.
0
b.
1,500
c.
3,000
d.
4,500
e.
6,000
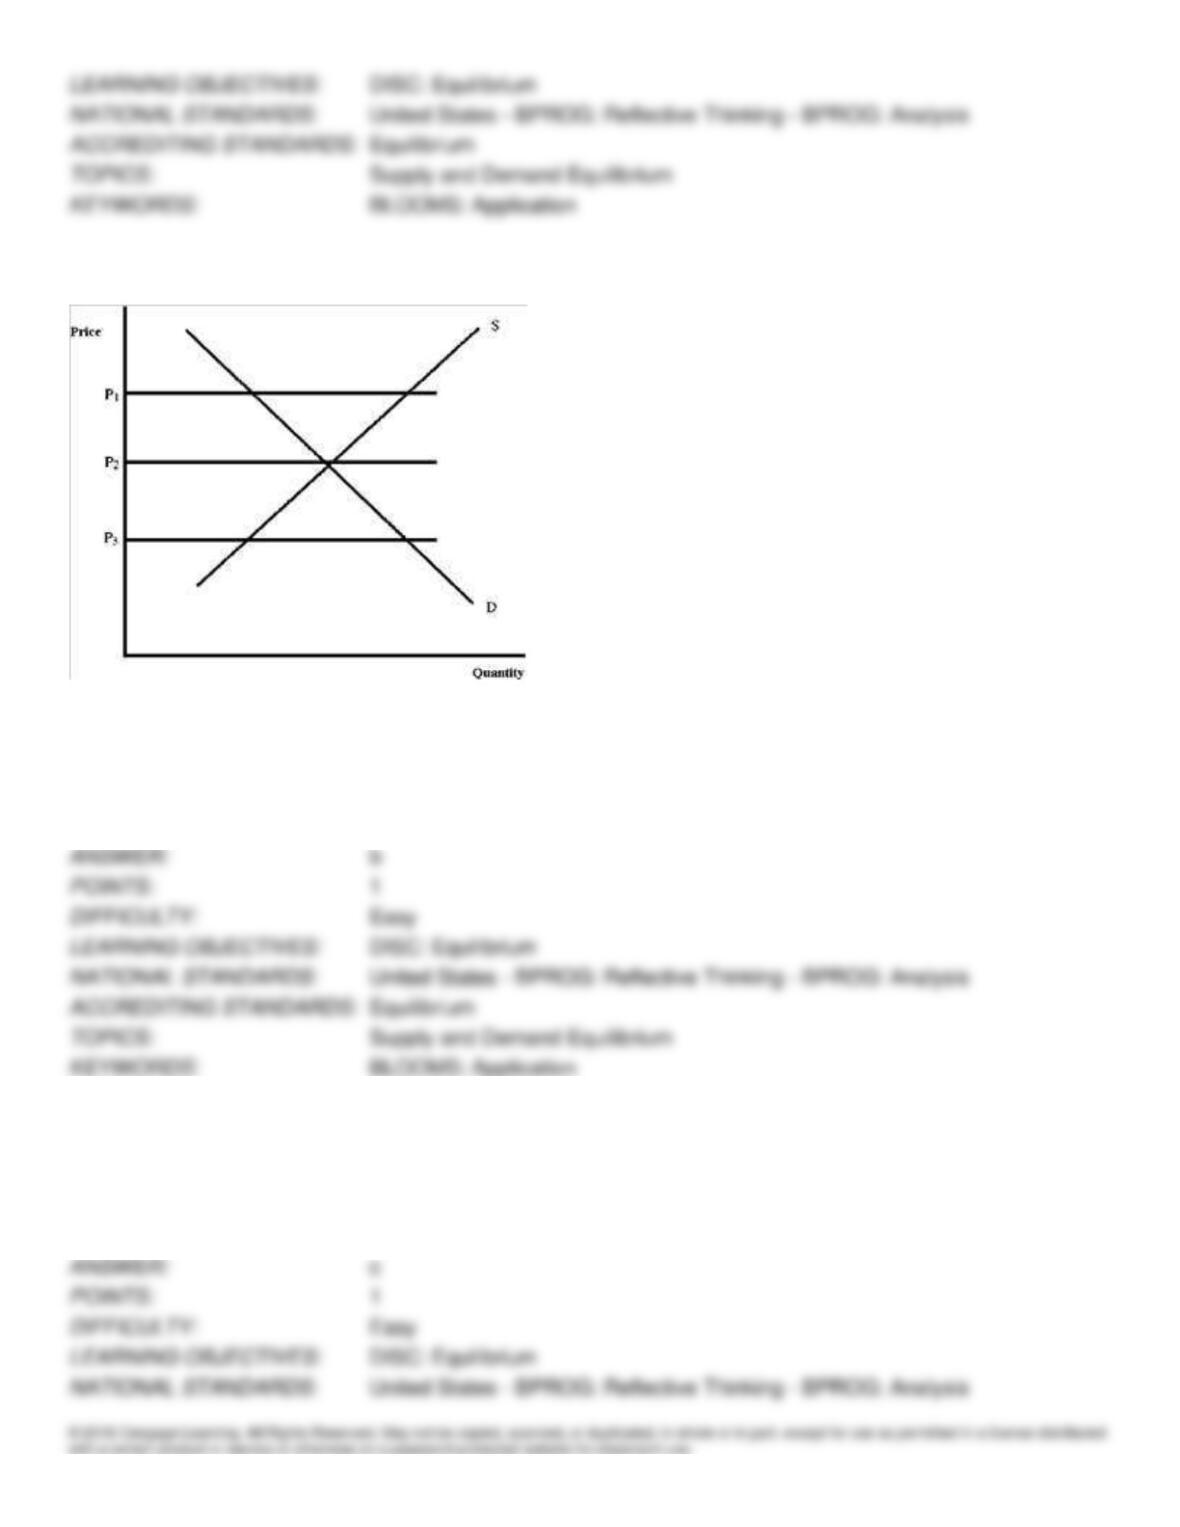
Figure 4-21
239. Which price in Figure 4-21 is equilibrium?
a.
P1
b.
P2
c.
P3
240. A shortage will tend to occur at which price in Figure 4-21?
a.
P1
b.
P2
c.
P3
241. A surplus will tend to occur at which price in Figure 4-21?
a.
P1
b.
P2
c.
P3
242. At price P1 in Figure 4-21, what will tend to happen?
a.
There will be a shortage, and the price will fall.
b.
There will be a shortage, and the price will rise.
c.
There will be a surplus, and the price will rise.
d.
There will be a surplus, and the price will fall.
e.
Equilibrium will occur in the market.
243. At price P3 in Figure 4-21, what will tend to happen?
a.
There will be a shortage, and the price will fall.
b.
There will be a shortage, and the price will rise.
c.
There will be a surplus, and the price will rise.
d.
There will be a surplus, and the price will fall.
e.
Equilibrium will occur in the market.