a.
supply curve shifted to the left.
b.
demand curve shifted to the right.
c.
demand curve shifted to the left.
d.
supply curve shifted to the right.
138. The price of coal fell and the quantity sold also fell. Everything else being equal, it is consistent that
a.
the price of oil fell.
b.
coal miners received large wage increases.
c.
more efficient mining equipment was installed.
d.
consumer incomes rose.
e.
the supply of coal fell.
139. If the demand for steak shifts to the right, the most likely explanation is that
a.
the price of cattle feed has fallen.
b.
consumer income has risen.
c.
the price of steak has fallen.
d.
cattle production has fallen.
140. If oranges and grapefruit are close substitutes, an increase in the price of oranges will shift the demand curve of
a.
both products to the right.
b.
both products to the left.
c.
grapefruit to the right.
d.
oranges to the left.
141. The quantity of Blu-Ray players purchased declined in spite of a decline in price. This implies that the
a.
supply curve for Blu-Ray players shifted to the left.
b.
demand curve for Blu-Ray players shifted to the right.
c.
demand curve for Blu-Ray players shifted to the left.
d.
supply curve for Blu-Ray players shifted to the right.
142. When GM advertises its cars, the company is trying to cause a
a.
rightward shift in the supply.
b.
rightward shift in the demand.
c.
leftward shift in the supply.
d.
leftward shift in the demand.
143. Last year, 1,000 cases of cough syrup were sold at $10; this year, 1,200 cases were sold at $12. The most probable
interpretation of these data is that the
a.
supply and demand curves are shifting to the right.
b.
supply and demand curves are shifting to the left.
c.
supply curve has shifted to the left, with no change in demand.
d.
demand curve has shifted to the right, with no change in supply.
144. Which of the following would cause a movement up (or leftward) along the demand curve for European autos in the
United States?
a.
an increase in the price of American autos
b.
a decrease in the price of American autos
c.
an increase in income in the United States
d.
an increase in the price of European cars
145. An increase in the price of poultry would lead to
a.
a decrease in quantity demanded of fish and an increase in the demand for poultry.
b.
a decrease in quantity demanded of poultry and an increase in the demand for fish.
c.
an increase in quantity demanded of fish and a decrease in the demand for poultry.
d.
an increase in quantity demanded of poultry and a decrease in the demand for fish.
146. For more than a thousand years, the Catholic Church required its members to abstain from meat on Fridays.
Catholics customarily ate fish on Friday. After 1966 abstinence from meat on Fridays was no longer required.
Consequently, the
a.
demand curve for fish shifted to the right.
b.
demand curve for fish shifted to the left.
c.
demand for meat decreased.
d.
price of fish increased.
147. The removal in 1966 of the requirement that Catholics eat fish on Fridays was followed by a 12.5 percent fall in
prices of fresh fish. From this it can be deduced that the
a.
demand curve for fish shifted to the left.
b.
demand curve shifted to the right.
c.
supply curve shifted to the left.
d.
supply curve shifted to the right.
148. The Red Jacket Mountain View Inn in New Hampshire charges $159 per room in the winter ski season and $114
during the summer months. The number of rooms and operating costs are constant year round. These prices indicate
a.
rightward shifts in the demand curve in the summer.
b.
a rightward shift in demand in the winter.
c.
leftward shifts in the supply curve in the summer.
d.
a leftward shift in demand in the winter.
149. How will an increase in price tend to affect demand?
a.
Demand will increase.
b.
Demand will decrease.
c.
Demand will not change.
d.
Uncertain.
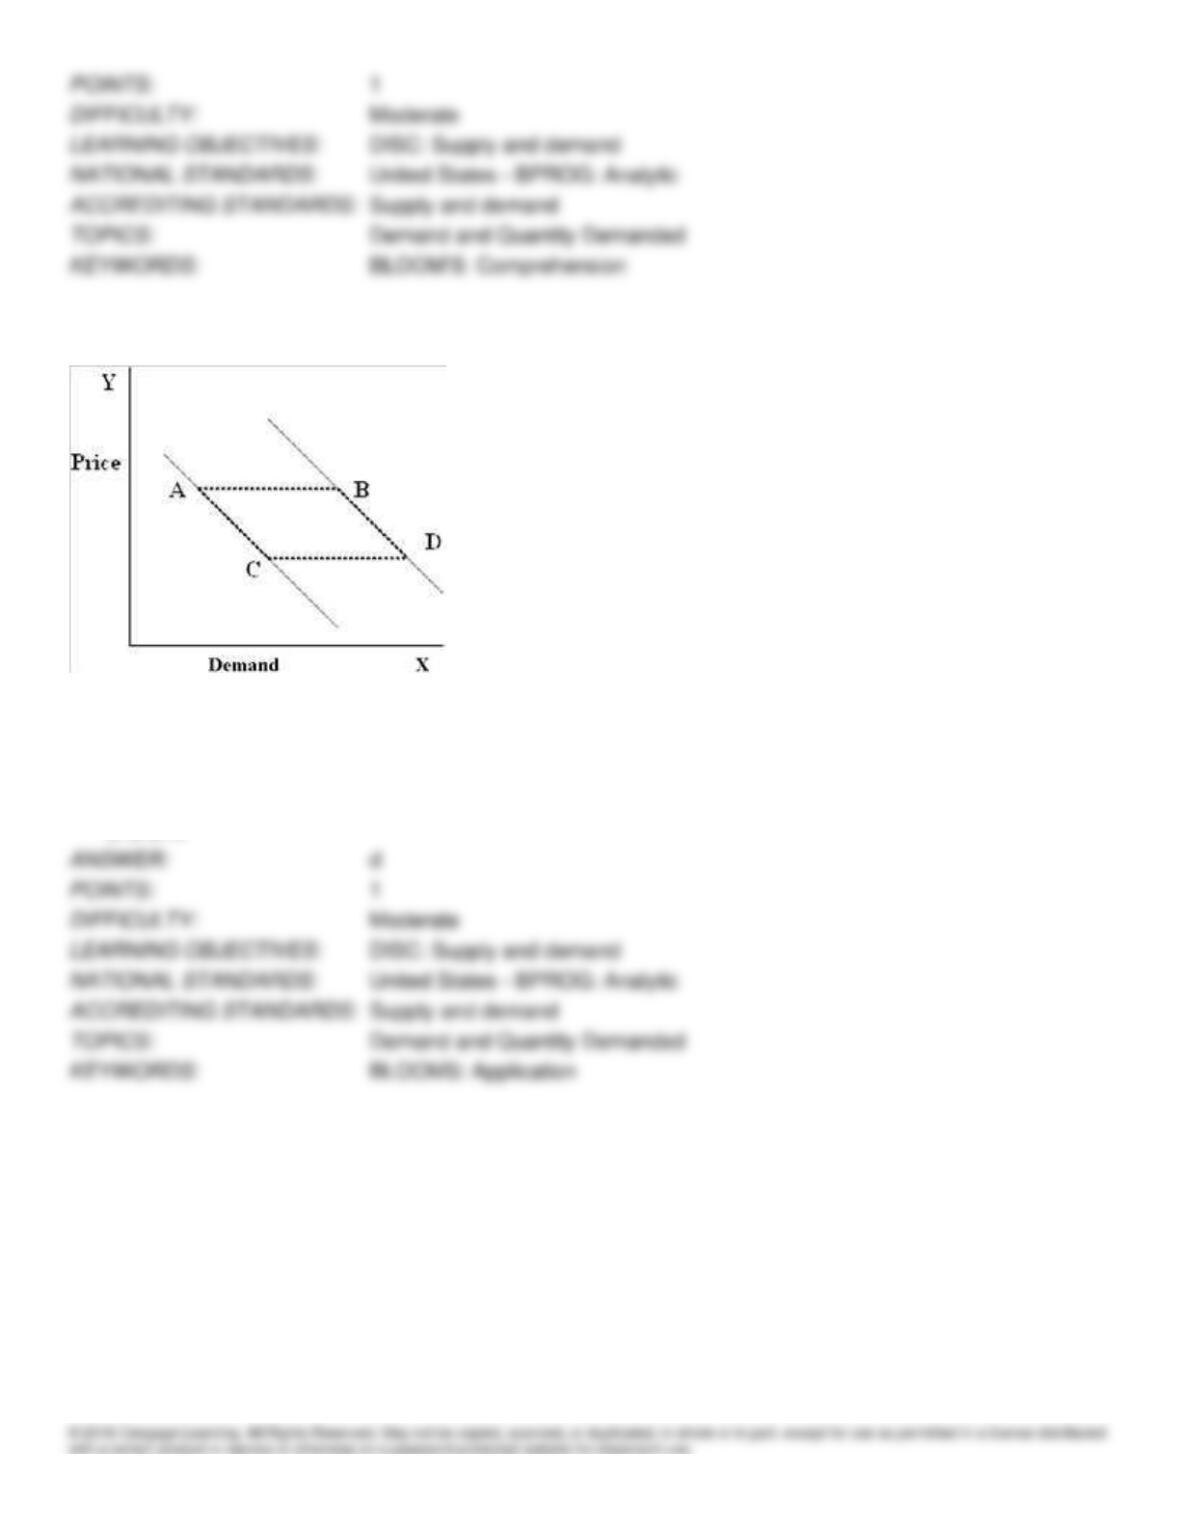
Figure 4-23
150. In Figure 4-23, which movement will be caused by changes in income?
a.
A to C
b.
C to A
c.
B to D
d.
B to A
Figure 4-4
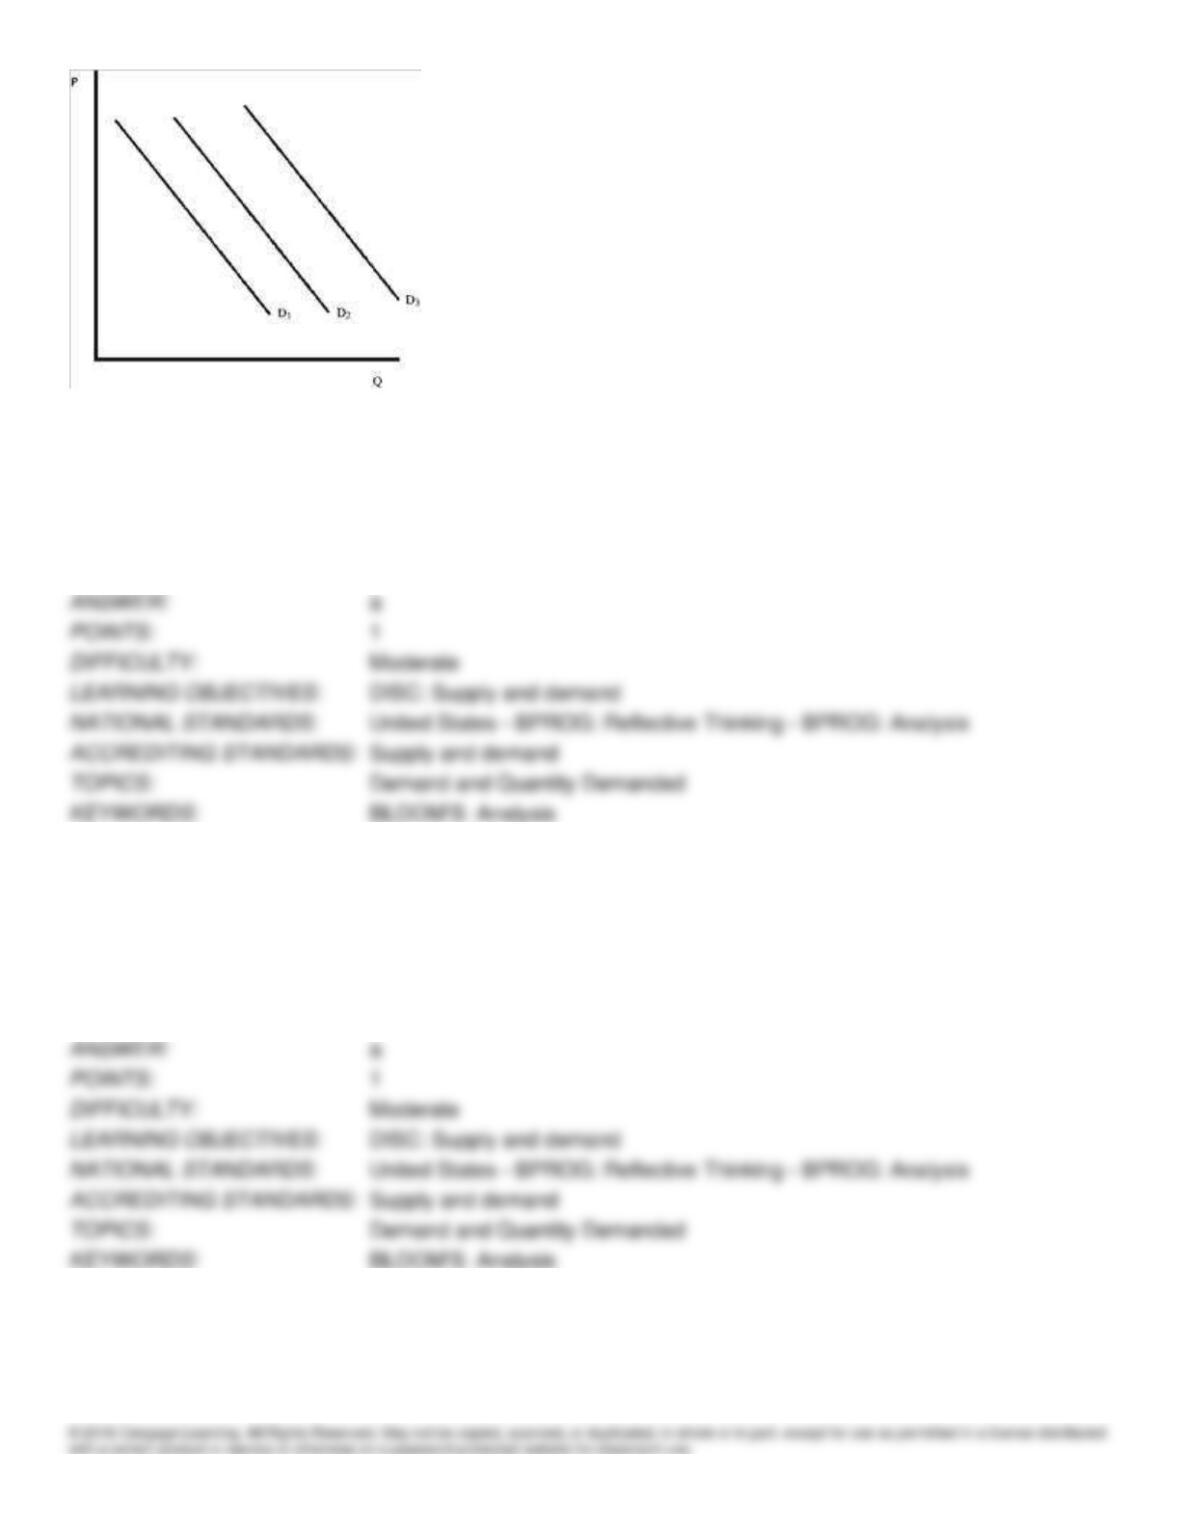
151. In Figure 4-4, an increase in population will change demand from
a.
D1 to D2.
b.
D2 to D1.
c.
D3 to D2.
d.
D3 to D1.
152. Assume that Figure 4-4 shows demand for orange juice. An increase in the price of soda will change demand from
a.
D1 to D2.
b.
D2 to D1.
c.
D3 to D2.
d.
D3 to D1.
153. Assume that Figure 4-4 shows demand for soda. A decrease in the price of apple juice will change demand from
a.
D1 to D2.
b.
D2 to D1.
c.
D2 to D3.
d.
D1 to D3.
154. Assume that Figure 4-4 shows demand for steak. An increase in income of buyers will change demand from
a.
D1 to D2.
b.
D2 to D1.
c.
D3 to D2.
d.
D3 to D1.
155. Assume that Figure 4-4 shows demand for new houses. A decrease in income of buyers will change demand from
a.
D1 to D2.
b.
D2 to D1.
c.
D2 to D3.
d.
D1 to D3.
156. Assume that Figure 4-4 shows demand for MP3 players. An increase in the price of music downloads changes
demand from
a.
D1 to D2.
b.
D2 to D1.
c.
D2 to D3.
d.
D1 to D3.
157. An increase in demand will have what effect on equilibrium price and quantity?
a.
Price will increase; quantity will decrease.
b.
Price will decrease; quantity will increase.
c.
Both price and quantity will increase.
d.
Both price and quantity will decrease.
158. All other factors held constant, if the price of game consoles rise, the demand for gaming titles will
a.
shift to the left, because they are normally used together.
b.
remain constant.
c.
shift to the right, because they are normally used together.
d.
shift to the right, because they are substitutes.
159. A decrease in demand will have what effect on equilibrium price and quantity?
a.
Price will increase; quantity will decrease.
b.
Price will decrease; quantity will increase.
c.
Both price and quantity will increase.
d.
Both price and quantity will decrease.
160. Why do airlines tend to lower ticket prices in the winter?
a.
Supply is relatively variable, and a drop in demand lowers equilibrium price.
b.
Demand is relatively variable, and a drop in supply lowers equilibrium price.
c.
A drop in both supply and demand lowers equilibrium price.
d.
Supply is relatively fixed, and a drop in demand lowers equilibrium price.
e.
Demand is relatively fixed, and a drop in supply lowers equilibrium price.
161. Sugarcane can be used for producing both sugar and ethanol. New regulations in certain countries now allow a higher
level of ethanol in gasoline. An economist would expect sugarcane prices to ____, and quantity sold to ____.
a.
rise; rise.
b.
fall; fall.
c.
rise; fall.
d.
fall; remain the same.
162. Along a supply curve,
a.
supply changes as price changes.
b.
quantity supplied changes as price changes.
c.
supply changes as technology changes.
d.
quantity supplied changes as technology changes.
163. The supply curve shows
a.
the same basic information as the demand curve.
b.
who will have an opportunity to produce or purchase an item.
c.
the quantity produced as a function of the price.
d.
plots of what quantities have been sold over the past few weeks or months.
164. An upward-sloping supply curve shows that
a.
buyers are willing to pay more for a scarce product.
b.
suppliers are willing to increase production of their goods if they can receive higher prices for them.
c.
buyers are unaffected by sellers’ costs of production.
d.
the price of a product is not influenced by the price buyers are willing to pay.
e.
at higher prices, an envy effect begins to affect the demand curve.
165. A common misconception about supply is that
a.
supply depends on many other variables.
b.
price is a major determinant of quantity.
c.
it is a fixed amount.
d.
quantity cannot be determined in advance.
e.
All of the above are correct.
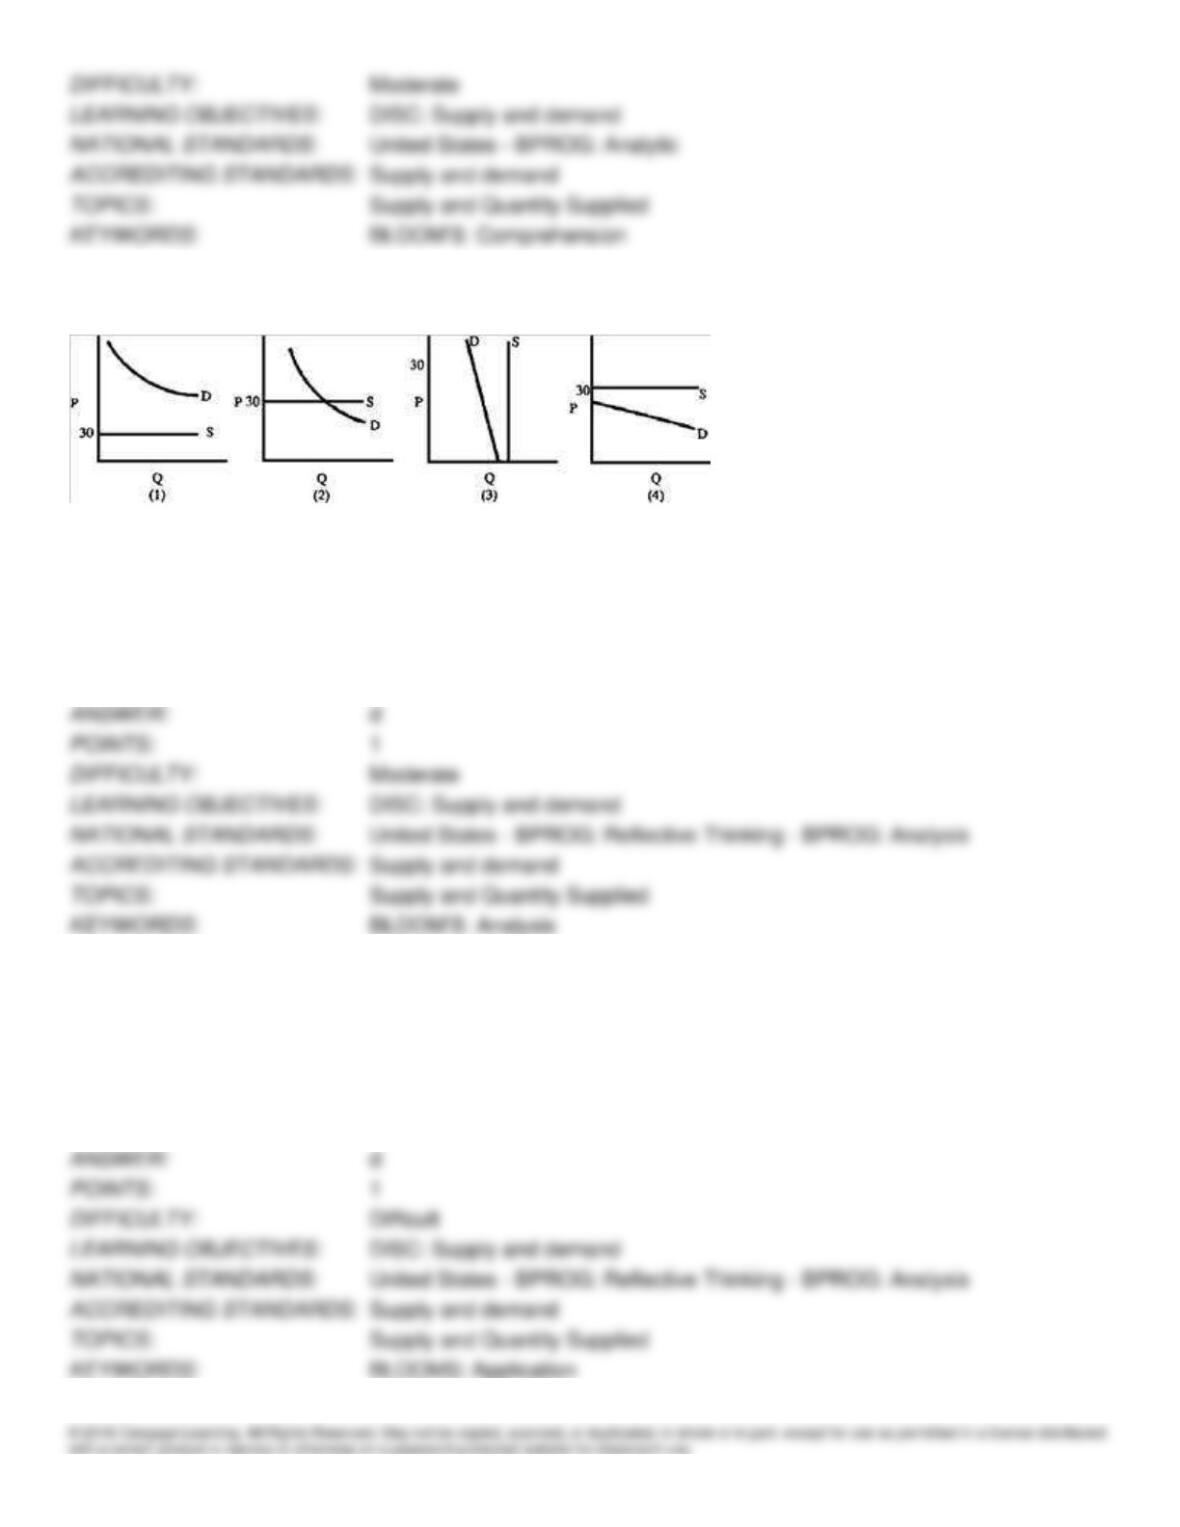
Figure 4-5
166. If the suppliers of a good will sell any amount at $30 but there are no sales, then the market can best be represented
by which graph in Figure 4-5?
a.
1
b.
2
c.
3
d.
4
167. The law of increasing relative costs, depicted by the concavity of the production opportunities frontier, is most
closely related to the
a.
downward slope of the demand curve.
b.
upward slope of the demand curve.
c.
downward slope of the supply curve.
d.
upward slope of the supply curve.
168. A typical supply curve has
a.
slope equal to zero.
b.
slope equal to infinity.
c.
negative slope.
d.
positive slope.
e.
constant slope.
169. A supply schedule shows
a.
the “market potential” for a product.
b.
how much producers are willing and able to sell at different prices.
c.
possible combinations of output under different conditions.
d.
how much consumers would like to buy at different prices.
e.
All of the above are correct.
170. To construct a supply curve, an economist needs data on price and quantity. Each point on the supply curve is
a.
supply of the product.
b.
a quantity supplied at that price.
c.
the amount that people want to buy.
d.
the amount people want to sell to buyers of different incomes.
e.
All of the above are correct.
171. If price rises, what happens to supply for a product?
a.
It increases.
b.
It decreases.
c.
It does not change.
d.
Uncertain-economic theory has no answer to this question.
172. If price rises, what happens to quantity supplied for a product?
a.
It increases.
b.
It decreases.
c.
It does not change.
d.
Quantity supplied is constant, but supply increases.
173. Why does quantity supplied increase when price increases?
a.
Producers find it more profitable to make the item.
b.
People “drop out” of the market, so buyers find it more abundant.
c.
As demand decreases with a high price, surpluses appear.
d.
All of the above.
174. A supply curve can be thought of as
a.
a graphical display of “market potential.”
b.
a graphical representation of the information in a supply schedule.
c.
showing the maximum quantities that firms are able to produce.
d.
a forecasting tool.
e.
All of the above are correct.
175. An important assumption that is made when constructing a supply schedule is
a.
only price and quantity matter in determining supply.
b.
firms always want to sell a certain amount of a product.
c.
supply is too important to be left to the marketplace.
d.
all other determinants of supply are held constant.
e.
demand has a positive slope.
176. Assuming that resources are specialized, the opportunity cost of an item increases as production of it rises. Therefore,
we expect that firms will produce more if
a.
the price increases.
b.
the price decreases.
c.
the opportunity cost is greater than the price.
d.
government asks firms to produce more.
e.
the income of buyers increases.
177. Firms often seek to borrow money to expand their capital stock, and the price they pay for the money is the interest
rate. What happens to the quantity of money supplied if the interest rate increases?
a.
It increases.
b.
It decreases.
c.
It does not change.
d.
It depends entirely on the interest rate.
178. The price for labor is the wage rate. What happens to the supply of labor if wages increase?
a.
It increases.
b.
It decreases.
c.
It does not change.
d.
Uncertain-economic theory has no answer to this question.
179. The price for labor is the wage rate. What happens to the quantity of labor supplied if wages increase?
a.
It increases.
b.
It decreases.
c.
It does not change.
d.
Uncertain-economic theory has no answer to this question.
180. Firms often seek to borrow money to expand their capital stock, and the price they pay for the money is the interest
rate. What happens to supply of money if the interest rate increases?
a.
It increases.
b.
It decreases.
c.
It does not change.
d.
Uncertain-economic theory has no answer to this question.
181. From 2007 to 2008, the Federal Reserve System reduced interest rates, the price that borrowers pay. As a result,
economists expected that the supply of money would
a.
increase.
b.
decrease.
c.
not change.
d.
Uncertain-economic theory has no answer to this question.
182. From 2007 to 2008, the Federal Reserve System reduced interest rates, the price which borrowers pay. As a result,
economists expected that the quantity of money supplied would
a.
increase.
b.
decrease.
c.
not change.
d.
Uncertain-economic theory has no answer to this question.
183. If new manufacturers enter the computer industry, then, holding all other things constant,
a.
each “old” manufacturer must sell fewer computers than before.
b.
some “old” manufacturers must exit the industry.
c.
the equilibrium price of computers must rise.
d.
the equilibrium quantity demanded of computers must rise.
184. A shift in the supply curve of bicycles resulting from higher steel prices will lead to
a.
higher prices of bicycles.
b.
lower prices of bicycles.
c.
a shift in the demand curve for bicycles.
d.
larger output of bicycles.
e.
no change in the price of bicycles.
185. The invention of machinery that can double the amount of gold extracted from raw ore will likely lead mining
companies to
a.
raise the world price of gold to pay for the new machinery.
b.
lower the world price of gold because any amount can now be produced more cheaply.
c.
raise the world price of gold because miners’ wages must double as their productivity doubles.
d.
lower the world price of gold only if new mining companies are not allowed to enter the industry.
186. Pork can be used to produce bacon or sausage, but not both. If the price of bacon rises for some reason, then,
everything else equal,
a.
the price of sausage will rise.
b.
the price of sausage will fall.
c.
the resources used in raising Pork will become more expensive.
d.
the resources used in raising Pork will become less expensive.
187. In January, 2,500 quarts of ice cream are sold in Boston at $2 a quart. In February, 3,000 quarts are sold at $2.50 a
quart. This change in quantity sold and price may have been caused by
a.
a reduction in wages in the Boston area.
b.
the introduction of labor-saving automated ice cream-packing machinery.
c.
the release of a medical study showing that ice cream consumption improves mental health.
d.
the decision by Boston ice cream sellers to eliminate discount coupons.
188. Professional baseball teams in the United States use only wooden bats. If aluminum bats were permitted, the likely
result would be a
a.
shift in the supply curve for aluminum bats.
b.
shift in the supply curve for wooden bats.
c.
change in the quantity supplied of aluminum bats.
d.
persistent shortage of aluminum bats.
189. Suppose the numbers in parentheses represent two points on a line: (59 billion quarts; $4) and (78 billion quarts; $6).
The line is most likely a
a.
production possibilities frontier for milk.
b.
supply curve for milk.
c.
demand curve for milk.
d.
ray through the origin.
e.
time series line.
190. The supply curve of books (which are produced using paper made from trees) will shift to the left in response to
a.
a decline in college tuition.
b.
an increase in home building.
c.
an increase in the supply of lumberjacks.
d.
an end to government regulations that limit timber harvesting in national forests.
191. The price of one good produced by a multiproduct industry rises. For another good produced by that industry
a.
the supply curve will shift to the left.
b.
the supply curve will remain constant.
c.
the supply curve will shift to the right.
d.
the demand curve will shift to the right.
192. The demand for computers has risen dramatically at the same time that the unit cost of production has decreased. As
a result, we can expect
a.
a decrease in price and no predictable impact on output.
b.
a definite decrease in price and increase in output.
c.
an increase in output with no predictable change in price.
d.
no predictable changes in either price or output.
193. The quantity of newspapers sold will decline if
a.
newsprint becomes more expensive.
b.
the printers’ union makes wage concessions.
c.
prices are reduced.
d.
magazine prices rise.
194. A severe freeze has once again damaged the Florida orange crop. The impact on the market for oranges will be a
leftward shift in
a.
demand as consumers try to economize because of the shortage.
b.
both the supply and demand curves.
c.
the supply curve.
d.
the supply curve and a rightward shift in the demand curve, which will result in a higher price.
195. Assume a new technology further reduces the cost of producing calculators. Also assume that consumers have cut
back on their scheduled purchases in anticipation of even more cost-saving developments. As a result, we can expect
a.
a decrease in price but no predictable change in output.
b.
a decrease in output but no predictable change in price.
c.
an increase in output but no predictable change in price.
d.
a predictable decrease in both output and price.