184. The actual benefit of a government subsidy is determined primarily by
a.
the elasticities of demand and supply.
b.
the legal (or statutory) assignment of the subsidy
c.
the number of exchanges that are made possible as a result of the subsidy.
d.
whether the subsidy is paid by cash or check.
185. If a $50 subsidy is legally (statutorily) granted to the sellers of exercise equipment and as a result the
price of exercise equipment to consumers falls by $30, the actual benefit of the subsidy
a.
goes completely to buyers of exercise equipment.
b.
goes completely to sellers of exercise equipment.
c.
is $30 to buyers and $20 to sellers.
d.
is $20 to buyers and $30 to sellers.
186. If a $300 subsidy is legally (statutorily) granted to the buyers of computers and as a result the selling
price of computers rises by $200, the actual benefit of the subsidy
a.
goes completely to the buyers of computers.
b.
goes completely to the sellers of computers.
c.
is $100 to computer buyers and $200 to computer sellers.
d.
is $200 to computer buyers and $100 to computer sellers.
187. If the federal government began granting a subsidy of 10 cents per apple to apple growers and as a
result the price of apples to consumers falls by 8 cents,
a.
the actual benefit of this subsidy goes mostly to consumers.
b.
the actual benefit of this subsidy goes mostly to producers.
c.
the actual benefit of this subsidy would be shared equally by producers and consumers.
d.
nobody would benefit from the subsidy.
188. A subsidy on a product will generate more actual benefit for consumers (and less for producers) when
a.
the supply of the product is relatively inelastic.
b.
the supply of the product is relatively elastic.
c.
the demand for the product is relatively elastic.
d.
either a or c is true.
189. A subsidy on a product will generate more actual benefit for producers (and less for consumers) when
a.
the supply of the product is relatively inelastic.
b.
the supply of the product is relatively elastic.
c.
the demand for the product is relatively inelastic.
d.
either b or c is true
190. The more elastic the supply of a product, the more likely that the actual benefit of a subsidy granted of
the product will
a.
go to sellers.
b.
go to buyers.
c.
go equally to both buyers and sellers.
d.
do none of the above.
191. The more inelastic the demand for a product, the more likely that the actual benefit of a subsidy
granted on the product will
a.
go to sellers.
b.
go to buyers.
c.
go equally to both buyers and sellers.
d.
do none of the above.
192. Which of the following generalizations about the benefit of a subsidy is correct?
a.
The more inelastic the supply of a product, the larger the portion of the benefit will be to
buyers.
b.
The more inelastic the demand for a product, the larger the portion of the benefit will be to
buyers.
c.
The more elastic the supply of a product, the smaller the portion of the benefit will be to
buyers.
d.
The distribution of the benefit of a subsidy is not affected by the elasticity of the supply
and demand for the product for which the subsidy is granted.
193. The benefit of a subsidy will go primarily to buyers when the
a.
demand for the product is highly inelastic and supply is relatively elastic.
b.
demand for the product is highly elastic and the supply is relatively inelastic.
c.
subsidy is legally (statutorily) granted to the seller of the product.
d.
subsidy is legally (statutorily) granted to the buyer of the product.
194. Suppose that the federal government grants a 50 cent per gallon subsidy to buyers of gasoline and that
the demand for gasoline is highly inelastic while the supply is highly elastic. Under these
circumstances, the benefit of the subsidy
a.
will go primarily to producers.
b.
will go primarily to consumers.
c.
will be split equally between consumers and producers.
d.
cannot be determined because the actual benefit of a subsidy is not influenced by the
elasticities of supply and demand.
195. When government gives a subsidy to buyers of good X, the benefits of the subsidy flow to
a.
the buyers of good X only.
b.
the sellers of good X only.
c.
the buyers and sellers of good x equally.
d.
both the buyers and sellers of good x, and the distribution of the benefits will be dependent
on the elasticity of demand and the elasticity of supply.
196. When the purchase of a good is subsidized, economic analysis indicates that
a.
the buyers of the product will gain at the expense of the sellers.
b.
the sellers of the product will gain at the expense of the buyers.
c.
the buyers and sellers will benefit equally.
d.
the more inelastic the supply of the good relative to its elasticity of demand, the larger the
share of benefits that will accrue to the sellers of the product.
197. In the two decades following 1990, subsidized federal loans per full-time student more than tripled.
Economic analysis indicates that this expansion in subsidies
a.
reduced the cost of a college education by the amount of the subsidies.
b.
increased the cost of a college education by the amount of the subsidies.
c.
reduced the cost of a college education of the students receiving the subsidies, but this
gain was partially offset by increases in the cost of education resulting from the subsidies.
d.
reduced the cost of a college education for students who did not accept the subsidies, but
the net cost of education of those receiving the subsidies rose.
198. In the two decades following 1990, subsidized federal loans per full-time student more than tripled.
Economic analysis indicates that this expansion in subsidies
a.
reduced the cost of a college education for all students.
b.
increased the cost of a college education for all students.
c.
reduced the net cost of a college education for students receiving the subsidies, but
increased the cost of college for other students.
d.
increased the net cost of a college education for those receiving the subsidies, but reduced
the cost of college for other students.
199. When a subsidy program allocates subsidies to a subset of the population, the result is greater demand
and higher prices in the market where purchases are subsidized, raising costs for
a.
only those buyers receiving the subsidies.
b.
primarily those buyers receiving the subsidies.
c.
all buyers in that market.
d.
only the taxpayers who pay for the subsidy.
200. If the supply of health care services is highly inelastic, programs that subsidize the cost of purchasing
medical services will
a.
lead to higher prices for medical services.
b.
lead to lower prices for medical services.
c.
not affect the price of medical services.
d.
help the buyers of medical services more than the sellers of those services.
201. Subsidy programs that provide benefits to well organized interest groups will
a.
be unattractive to elected political officials.
b.
be highly attractive to elected political officials.
c.
be attractive to elected political officials only if the subsidies reduce the cost of supplying
the good.
d.
be attractive to elected political officials only if the subsidies increase the efficiency of
resource use.
Figure 4-1
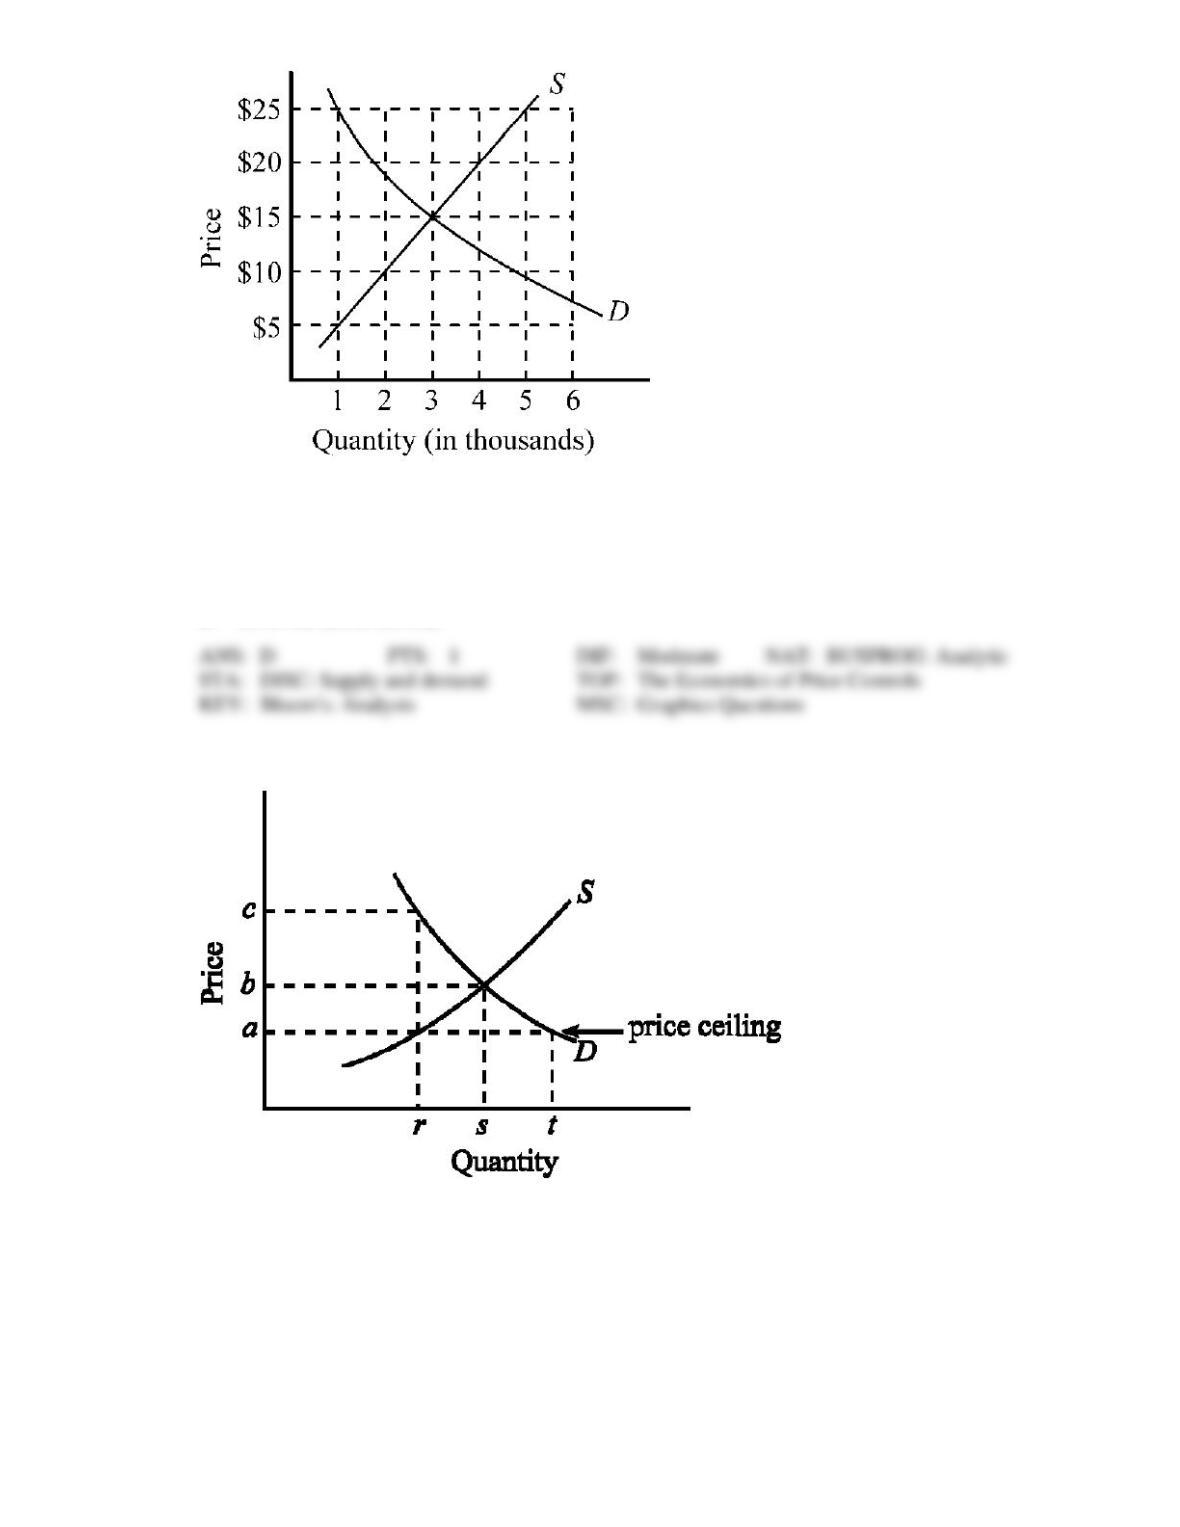
202. Figure 4-1 illustrates the market for compact discs. If the government imposes a price floor of $25 for
compact discs, which of the following will be true?
a.
Consumers would wish to purchase 1,000 compact discs.
b.
Producers would wish to sell 5,000 compact discs.
c.
There would be a surplus of 4,000 compact discs.
d.
All of the above are true.
Figure 4-2
203. Given the demand and supply conditions shown in Figure 4-2, if the government imposes a price
ceiling of a, indicate the quantity consumers would like to buy and the amount producers would be
willing to supply.
a.
Consumers would want to buy t; producers would be willing to sell r.
b.
Consumers would want to buy r; producers would be willing to sell t.
c.
Consumers would want to buy t; producers would be willing to sell s.
d.
Consumers would want to buy s; producers would be willing to sell s.
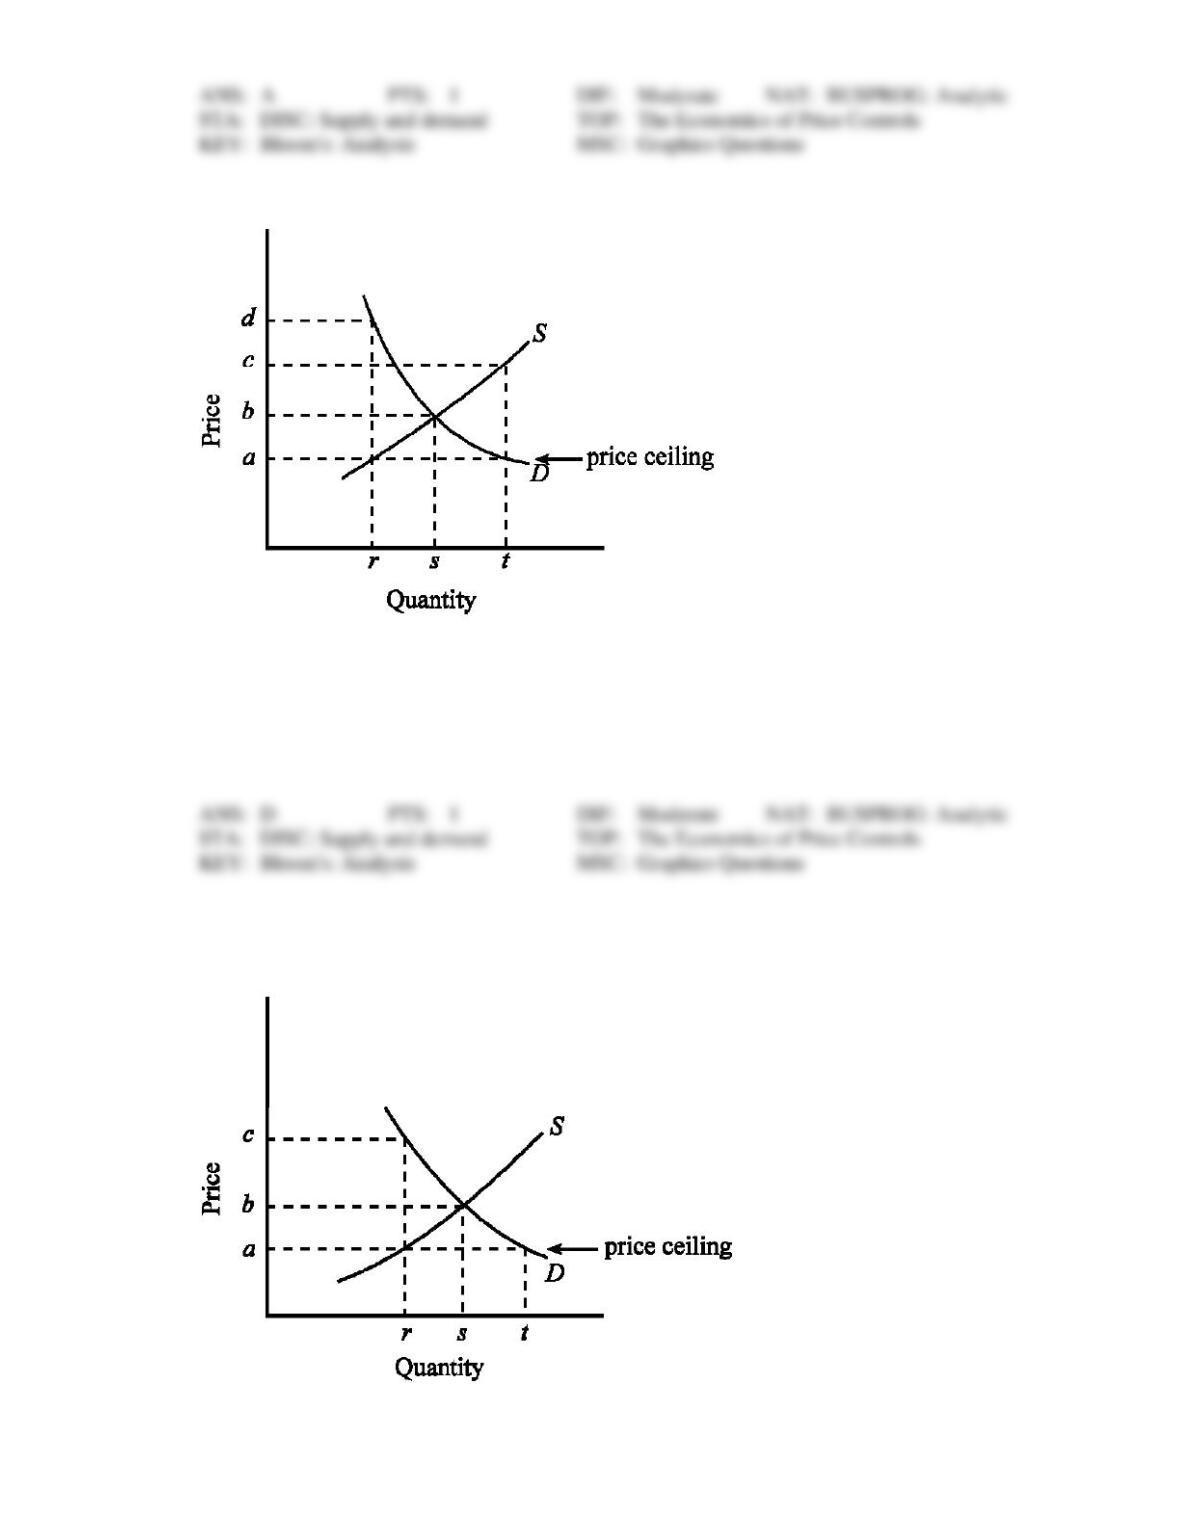
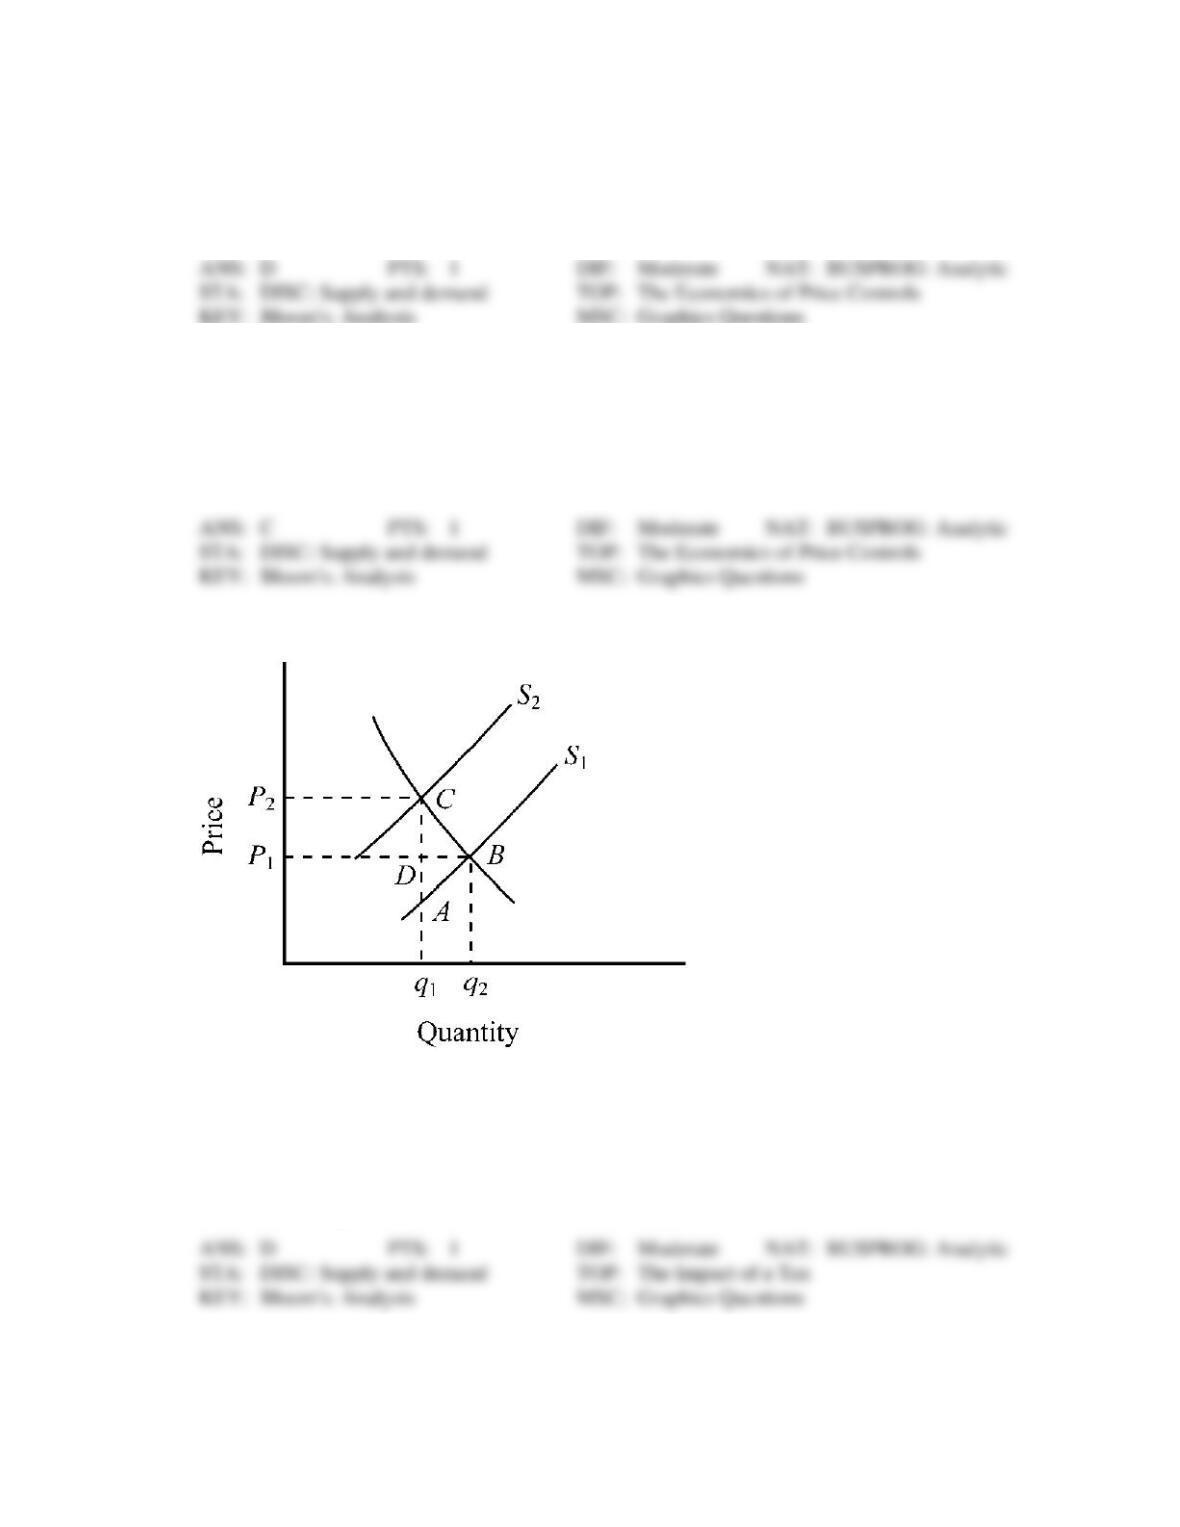
Figure 4-3
204. Figure 4-3 indicates the demand (D) and supply (S) for the rental housing market in a large city. If the
government imposed a price ceiling of a, which of the following would be true?
a.
The quantity of rental housing demanded would be t.
b.
The quantity of rental housing supplied would be r.
c.
There would be a shortage of rental housing.
d.
All of the above are true.
Use the figure below to answer the following question(s).
Figure 4-4
205. Given the demand and supply conditions shown in Figure 4-4, if the government imposes a price
ceiling of a, which of the following would be true?
a.
Consumers would want to buy r units.
b.
Consumers would want to buy s units.
c.
Producers would wish to sell s units.
d.
Producers would wish to sell r units.
206. Given the demand and supply conditions shown in Figure 4-4, what will happen as the result of
imposing a price ceiling of a?
a.
Demand for the product will decline.
b.
Supply will increase.
c.
There will be a shortage of the product.
d.
Over time, the quality of the product offered by suppliers will increase.
Figure 4-5
207. Figure 4-5 represents the market for gasoline before and after a per-gallon tax. What does the
triangular area ABC represent?
a.
the amount of revenue raised due to imposing the tax
b.
the loss in consumer surplus due to imposing the tax
c.
the loss in producer surplus due to imposing the tax
d.
the deadweight loss (or excess burden) caused by the tax
Use the figure below illustrating the impact of an excise tax to answer the following question(s).
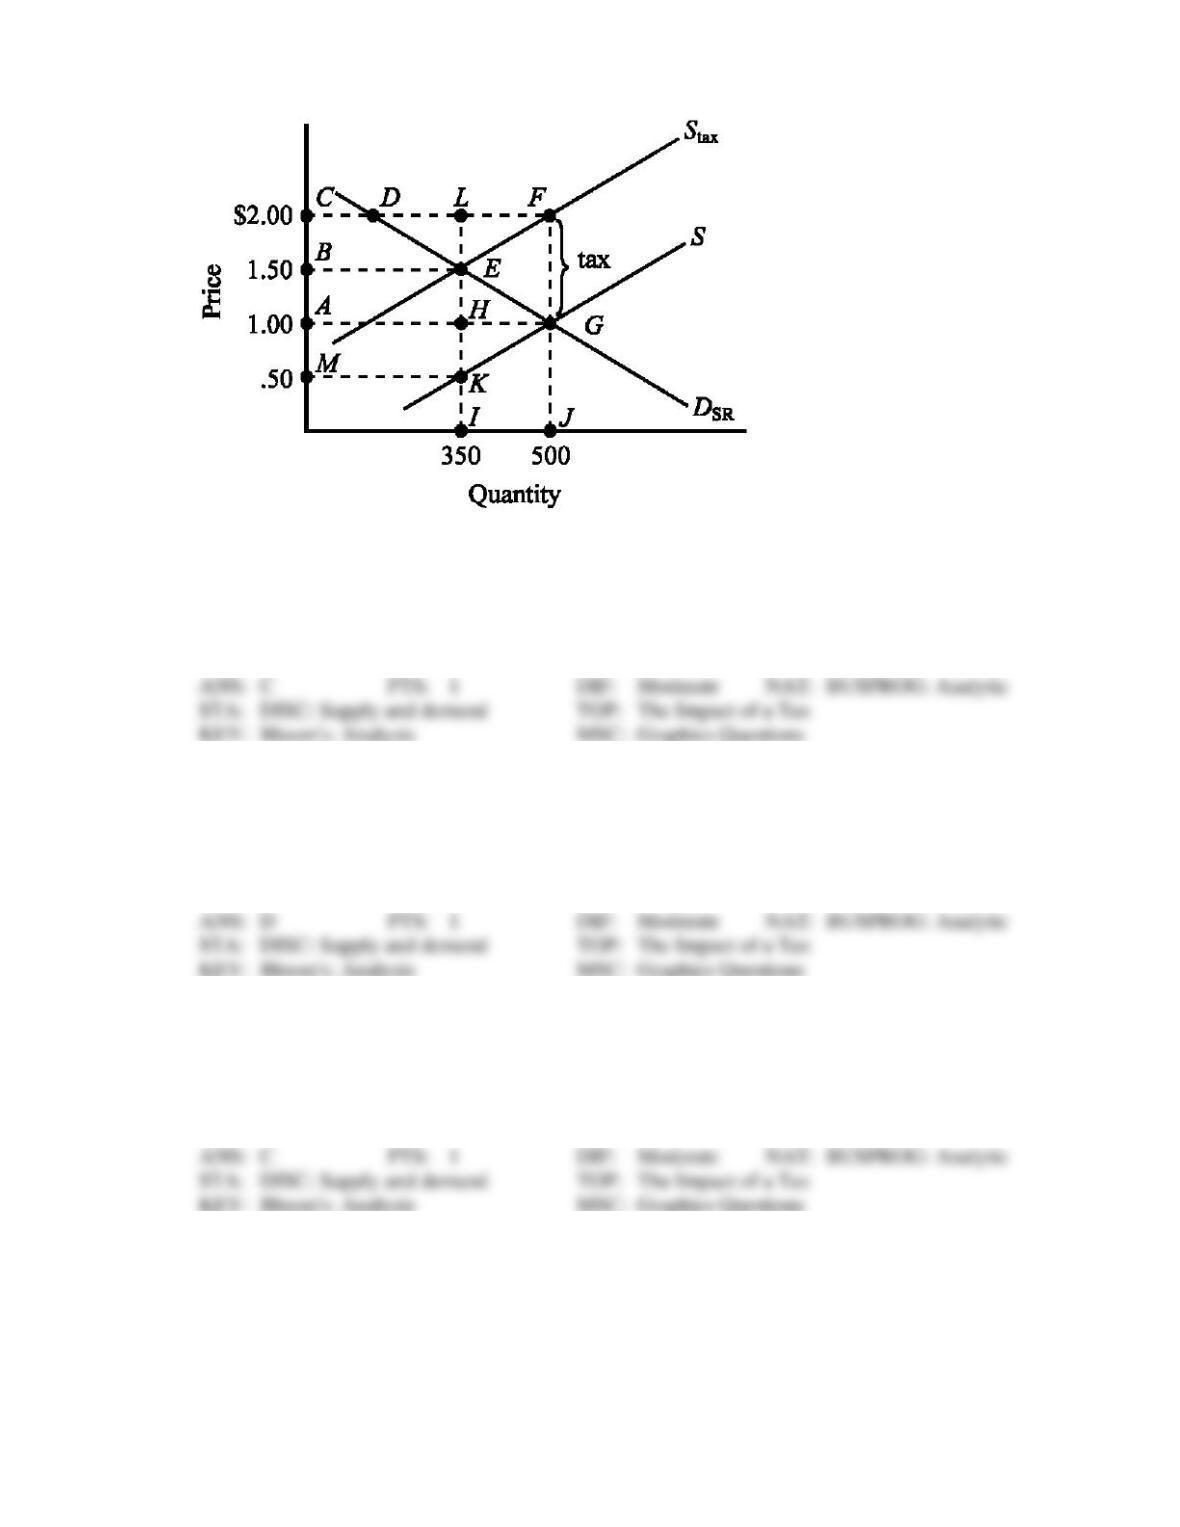
Figure 4-6
208. Refer to Figure 4-6. The amount of the excise tax I is
a.
$.50.
b.
$1.50.
c.
$1.00.
d.
$2.00.
209. Refer to Figure 4-6. The amount of the actual tax burden paid by consumers and producers is
a.
$1.00 for consumers and $.50 for producers
b.
$1.00 for consumers and $1.00 for producers.
c.
$.25 for consumers and $.75 for producers.
d.
$.50 for consumers and $.50 for producers.
210. The deadweight loss of the tax illustrated in Figure 4-6 is given by the area
a.
ABEH.
b.
DFE.
c.
EKG.
d.
EFG.
211. The revenue generated by the tax illustrated in Figure 4-6 is given by the area
a.
ACLH.
b.
BEKM.
c.
ACFG.
d.
0AGJ.
Use the figure below to answer the following question(s).
Figure 4-7
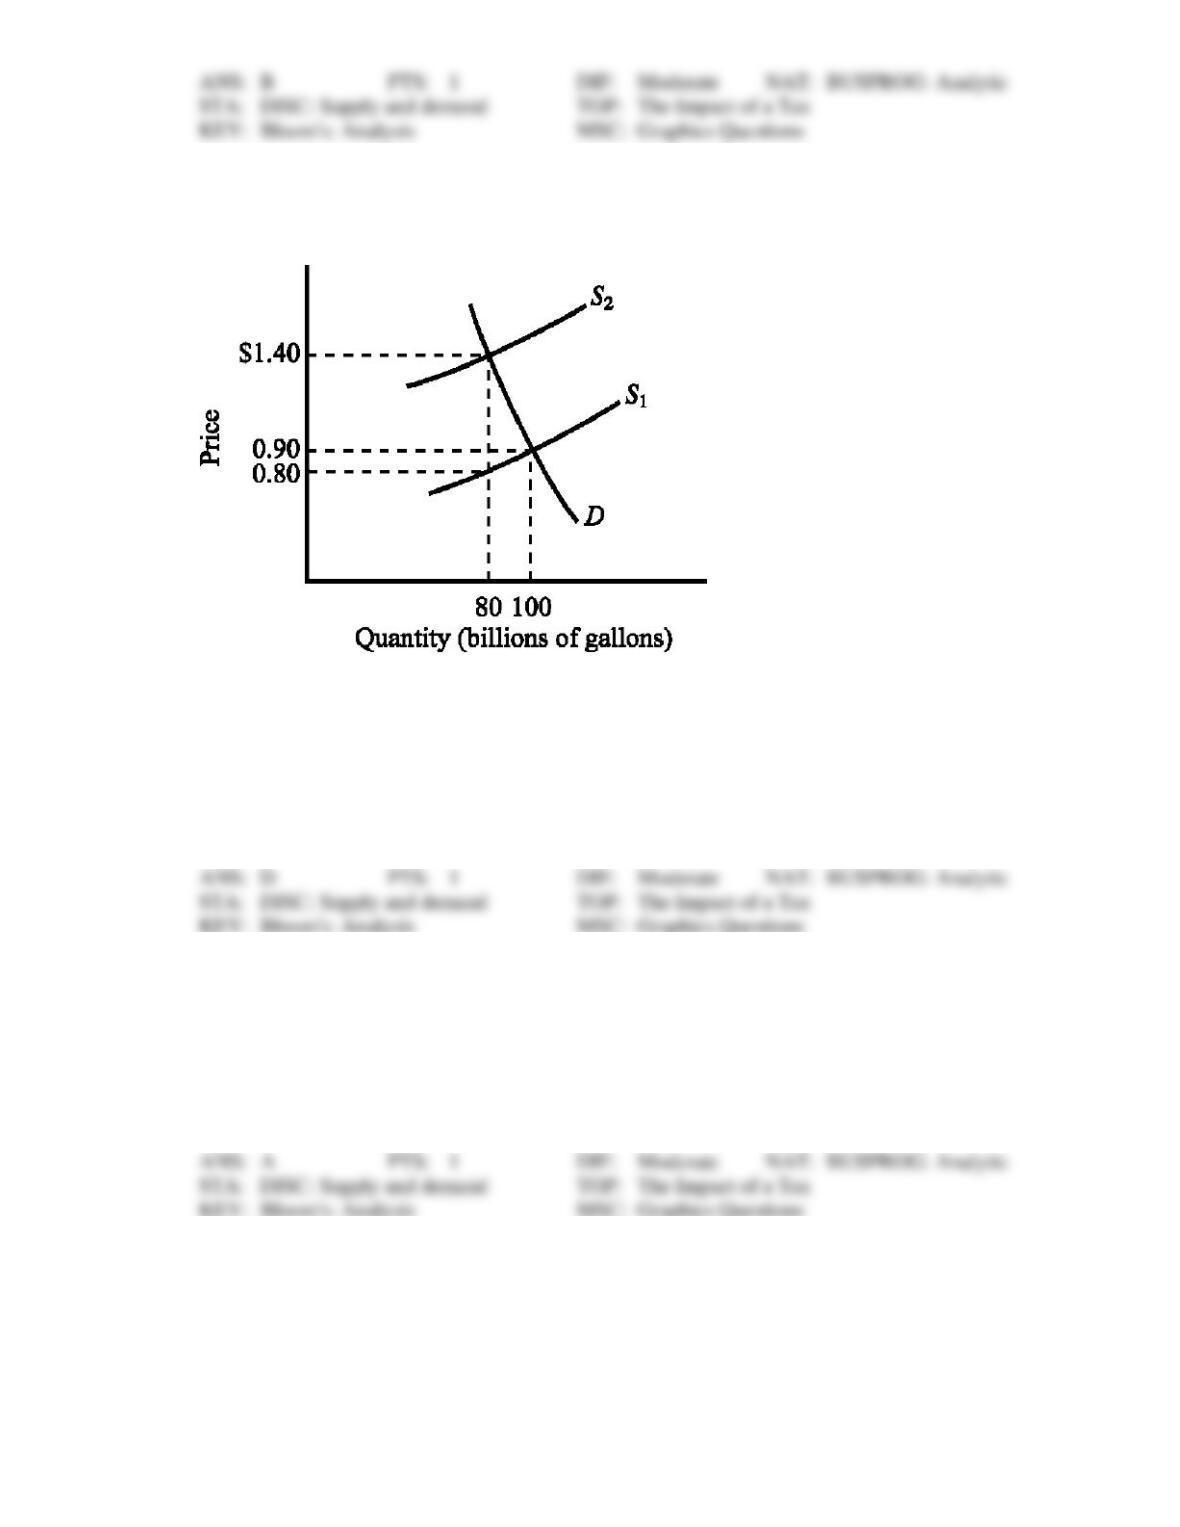
212. Refer to Figure 4-7. The supply curve S1 and the demand curve D indicate initial conditions in the
market for gasoline. A $.60-per-gallon excise tax on gasoline is levied, which shifts the supply curve
from S1 to S2. Imposing the tax causes the equilibrium price of gasoline to increase from
a.
$.80 to $1.40.
b.
$.80 to $1.50.
c.
$.90 to $1.50.
d.
$.90 to $1.40.
213. Refer to Figure 4-7. The supply curve S1 and the demand curve D indicate initial conditions in the
market for gasoline. A $.60-per-gallon excise tax on gasoline is levied, which shifts the supply curve
from S1 to S2. Which of the following states the actual burden of the tax?
a.
$.50 for buyers and $.10 for sellers
b.
$.50 for sellers and $.10 for buyers
c.
The entire $.60 falls on sellers.
d.
The entire $.60 falls on buyers.
214. Refer to Figure 4-7. The supply curve S1 and the demand curve D indicate initial conditions in the
market for gasoline. A $.60-per-gallon excise tax on gasoline is levied. How much revenue does the
$.60-per-gallon tax generate for the government?
a.
$40 billion
b.
$48 billion
c.
$50 billion
d.
$60 billion
215. Refer to Figure 4-7. Which of the following is true for the tax illustrated?
a.
The tax increases the price of gasoline by $.60.
b.
Since the demand for gasoline is more inelastic than the supply, consumers bear most of
the burden of the tax.
c.
Since the demand for gasoline is more elastic than the supply, consumers bear most of the
burden of the tax.
d.
Since the supply of gasoline is highly inelastic, the primary burden of the tax is imposed
on the suppliers of gasoline.
Use the figure below to answer the following question(s).
Figure 4-8
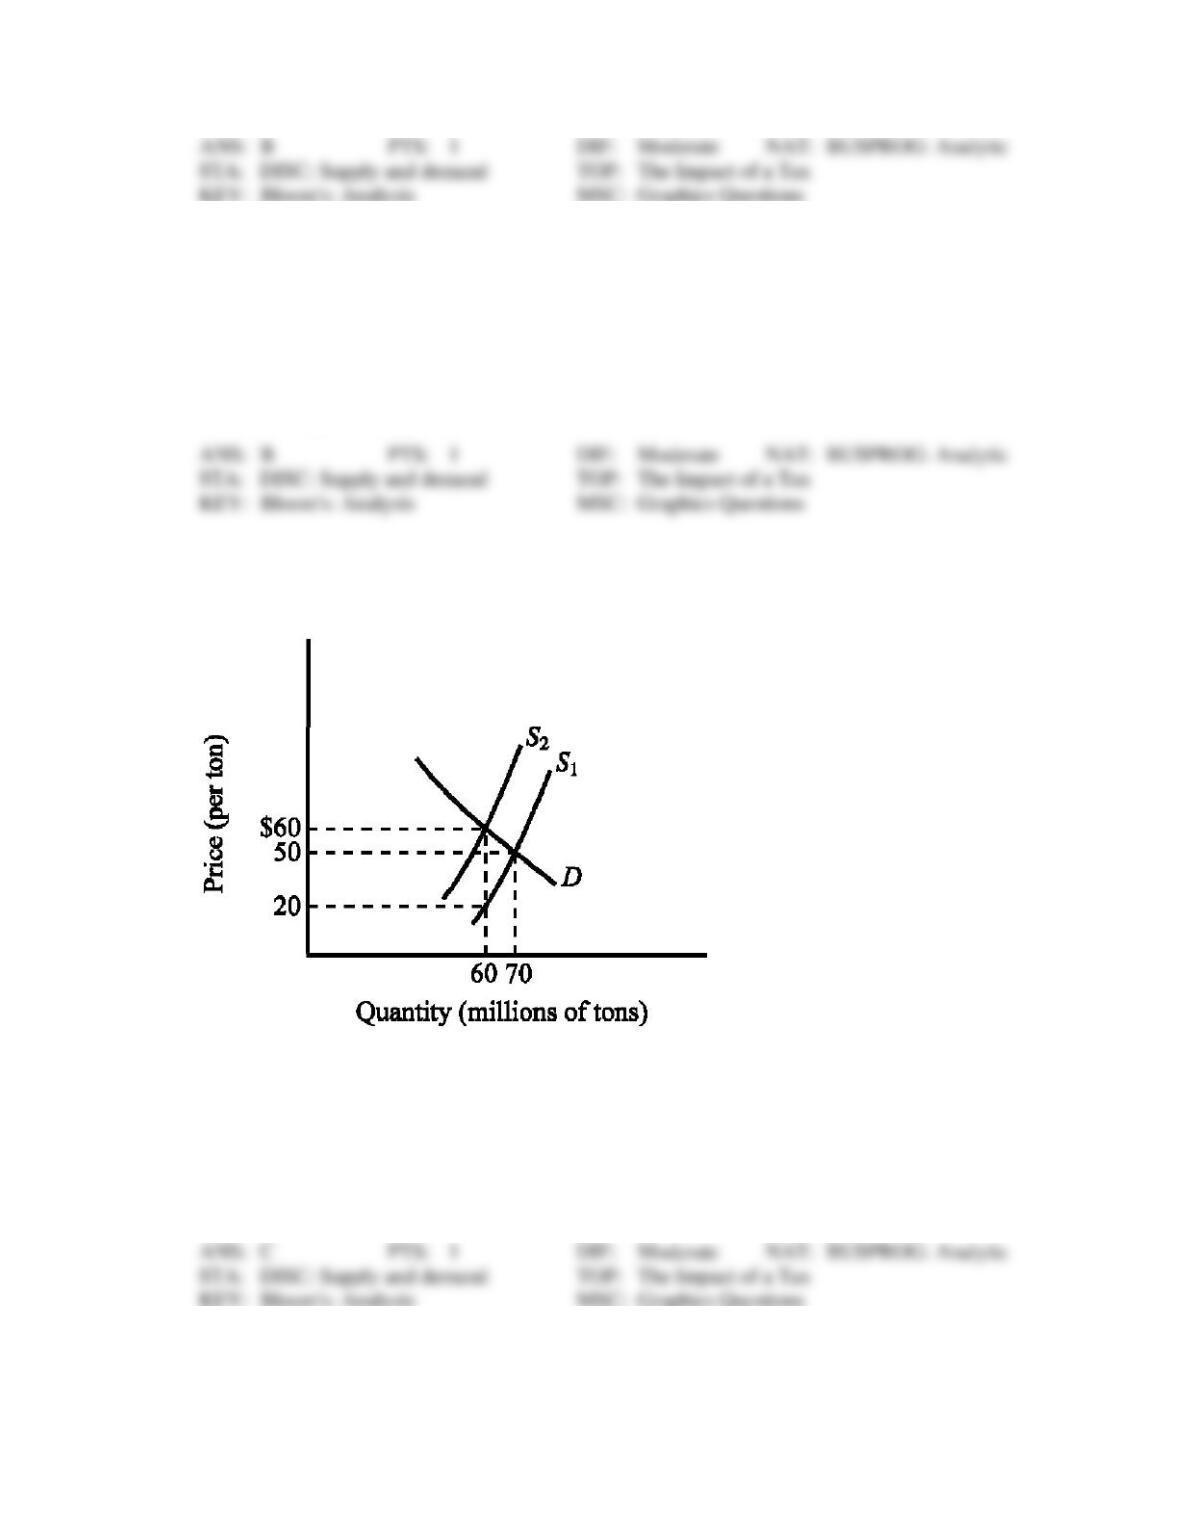
216. Refer to Figure 4-8. The supply curve S1 and the demand curve D indicate initial conditions in the
market for soft coal. A $40-per-ton tax on soft coal is levied, shifting the supply curve from S1 to S2.
Imposing the tax increases the equilibrium price of soft coal from
a.
$20 to $60 per ton.
b.
$20 to $50 per ton.
c.
$50 to $60 per ton.
d.
$50 to $90 per ton.
217. Refer to Figure 4-8. The supply curve S1 and the demand curve D indicate initial conditions in the
market for soft coal. A $40-per-ton tax on soft coal is levied, shifting the supply curve from S1 to S2.
Which of the following states the actual burden of the tax?
a.
$10 for buyers and $30 for sellers
b.
$30 for buyers and $10 for sellers
c.
The entire $40 falls on sellers.
d.
The entire $40 falls on buyers.
218. Refer to Figure 4-8. How much revenue does the $40-per-ton tax generate for the government?
a.
$600 million
b.
$700 million
c.
$2.4 billion
d.
$2.8 billion
219. Refer to Figure 4-8. Which of the following is true?
a.
The tax increases the price of soft coal by $40 per ton.
b.
Since the demand for soft coal is more inelastic than the supply, consumers bear most of
the burden of the tax.
c.
Since the demand for soft coal is more elastic than the supply, suppliers of soft coal bear
most of the burden of the tax.
d.
Since the supply of soft coal is highly inelastic, the primary burden of the tax is imposed
on the consumers of soft coal.
Use the figure below to answer the following question(s).
Figure 4-9
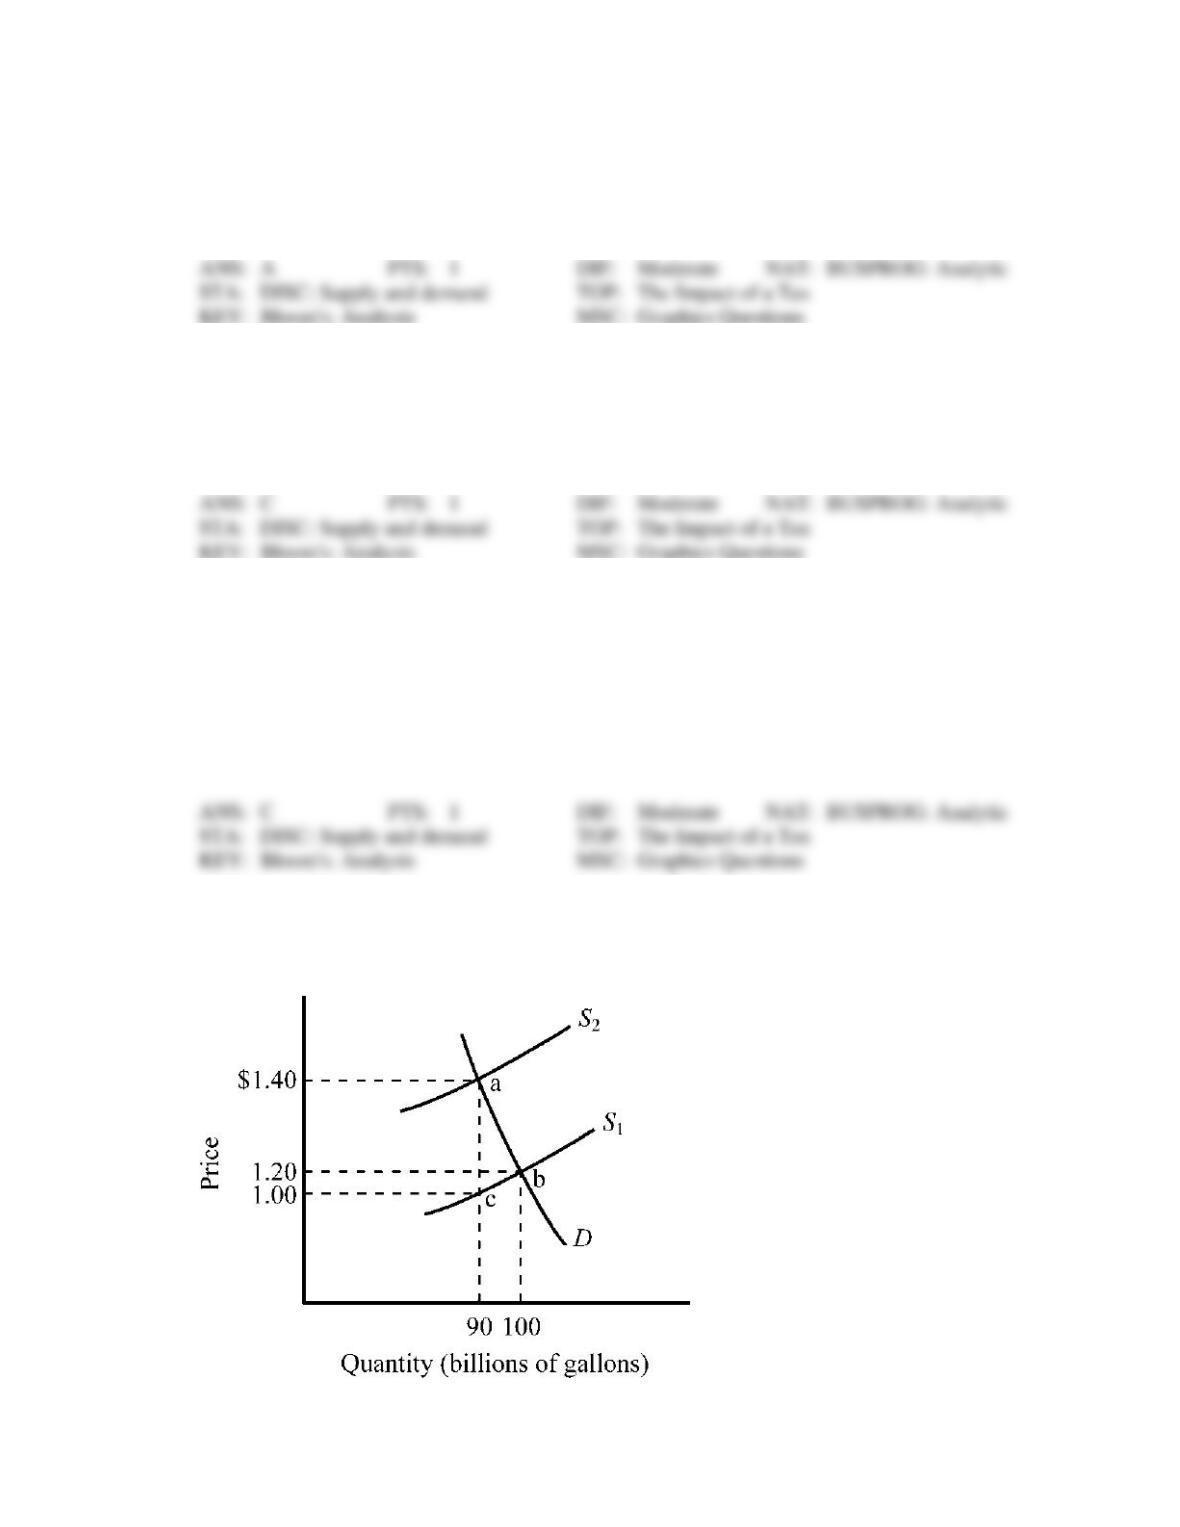
220. Refer to Figure 4-9. The market for gasoline was initially in equilibrium at point b. If a $.40 excise tax
was imposed,
a.
the supply of gasoline would shift to S2.
b.
the price of gasoline to consumers would increase from $1.20 per gallon to $1.40 per
gallon.
c.
the net price received by producers of gasoline would decline from $1.20 per gallon to
$1.00 per gallon.
d.
all of the above would occur.
221. Refer to Figure 4-9. The market for gasoline was initially in equilibrium at point b and a $.40 excise
tax is illustrated. How much revenue would the $.40 gasoline tax raise?
a.
$18 million
b.
$36 million
c.
$72 million
d.
$100 million
222. Refer to Figure 4-9. The market for gasoline was initially in equilibrium at point b and a $.40 excise
tax is illustrated. Which of the following states the actual burden of the tax?
a.
$.20 for buyers and $.20 for sellers
b.
$.30 for buyers and $.10 for sellers
c.
The entire $.40 falls on sellers.
d.
The entire $.40 falls on buyers.
223. Refer to Figure 4-9. The market for gasoline was initially in equilibrium at point b and a $.40 excise
tax is illustrated. What does the triangular area abc represent?
a.
the revenue the government derives from the tax
b.
the tax paid by consumers
c.
the tax paid by producers
d.
the deadweight loss (or excess burden) created by the tax
Use the figure below to answer the following question(s).
Figure 4-10
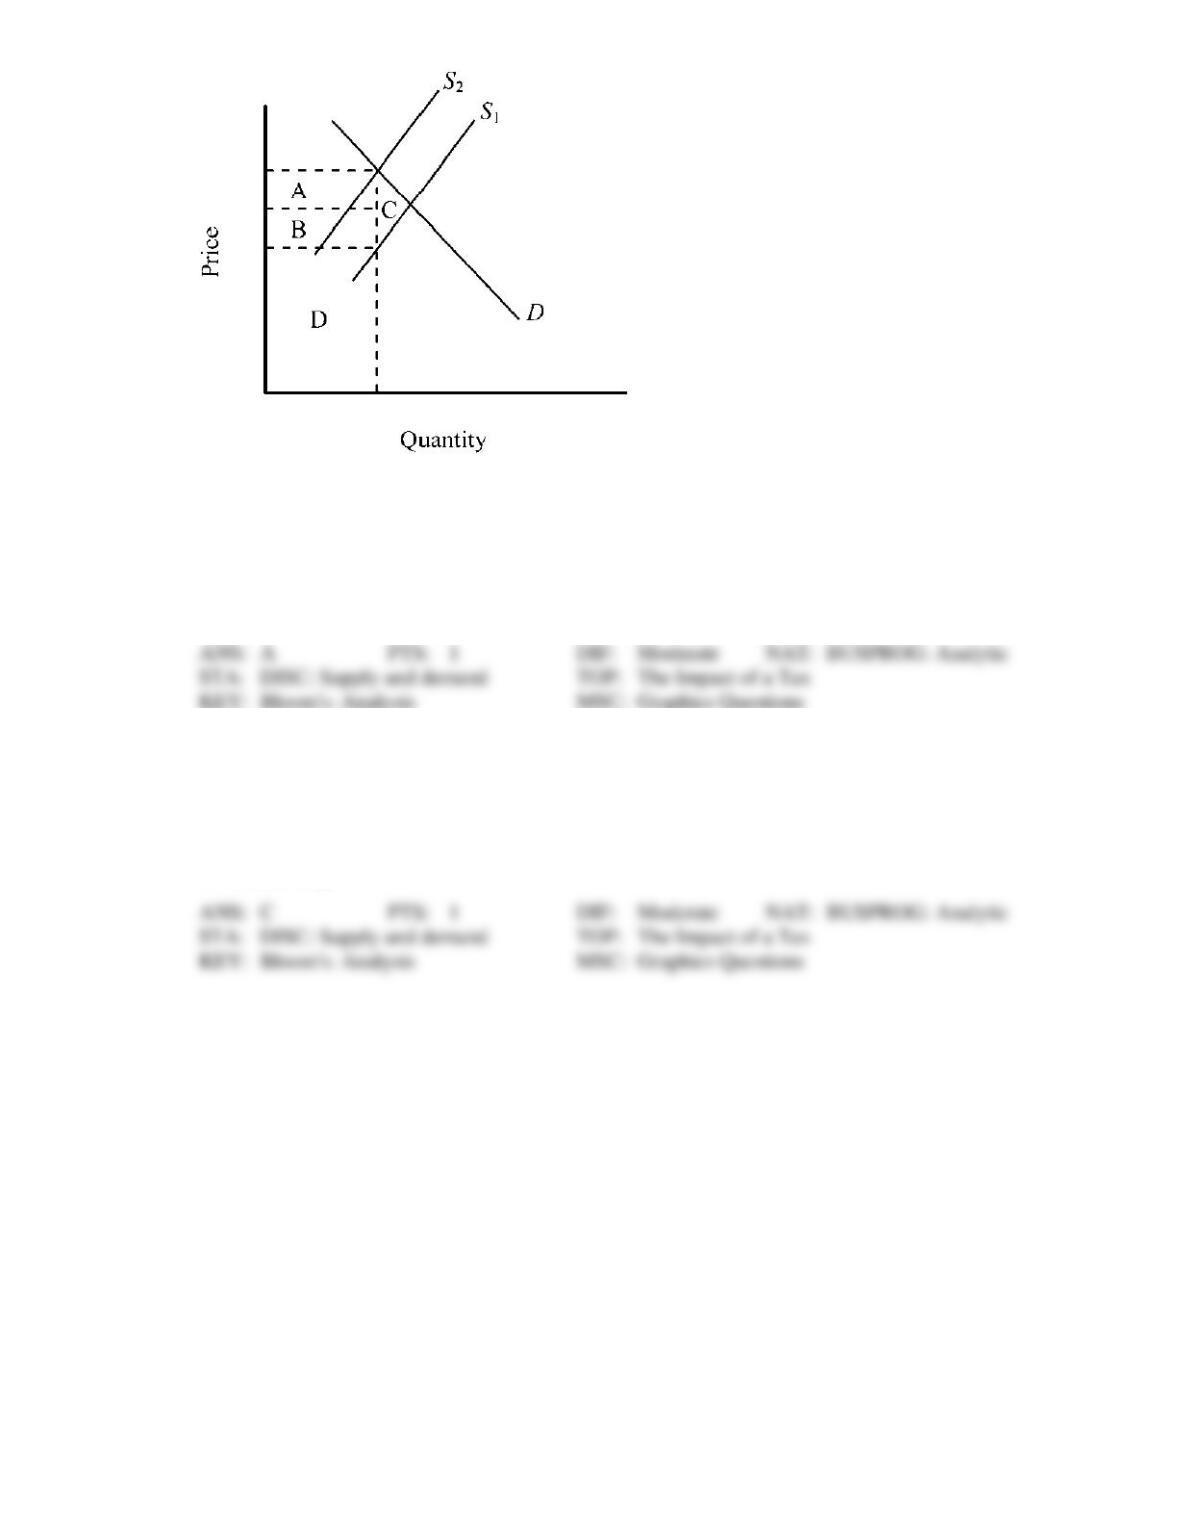
224. Figure 4-10 shows the market for a good before and after an excise tax is imposed. What does the
triangular area C represent?
a.
the deadweight loss accompanying the tax
b.
the tax revenue derived from sellers
c.
the tax revenue derived from buyers
d.
the total tax revenue generated by the tax
225. Refer to Figure 4-10. The accompanying graph shows the market for a good before and after an excise
tax is imposed. The total tax revenue generated is indicated by
a.
area A + area B + area D.
b.
area A + area B + area C.
c.
area A + area B.
d.
area D only.
Use the figure below to answer the following question(s).
Figure 4-11
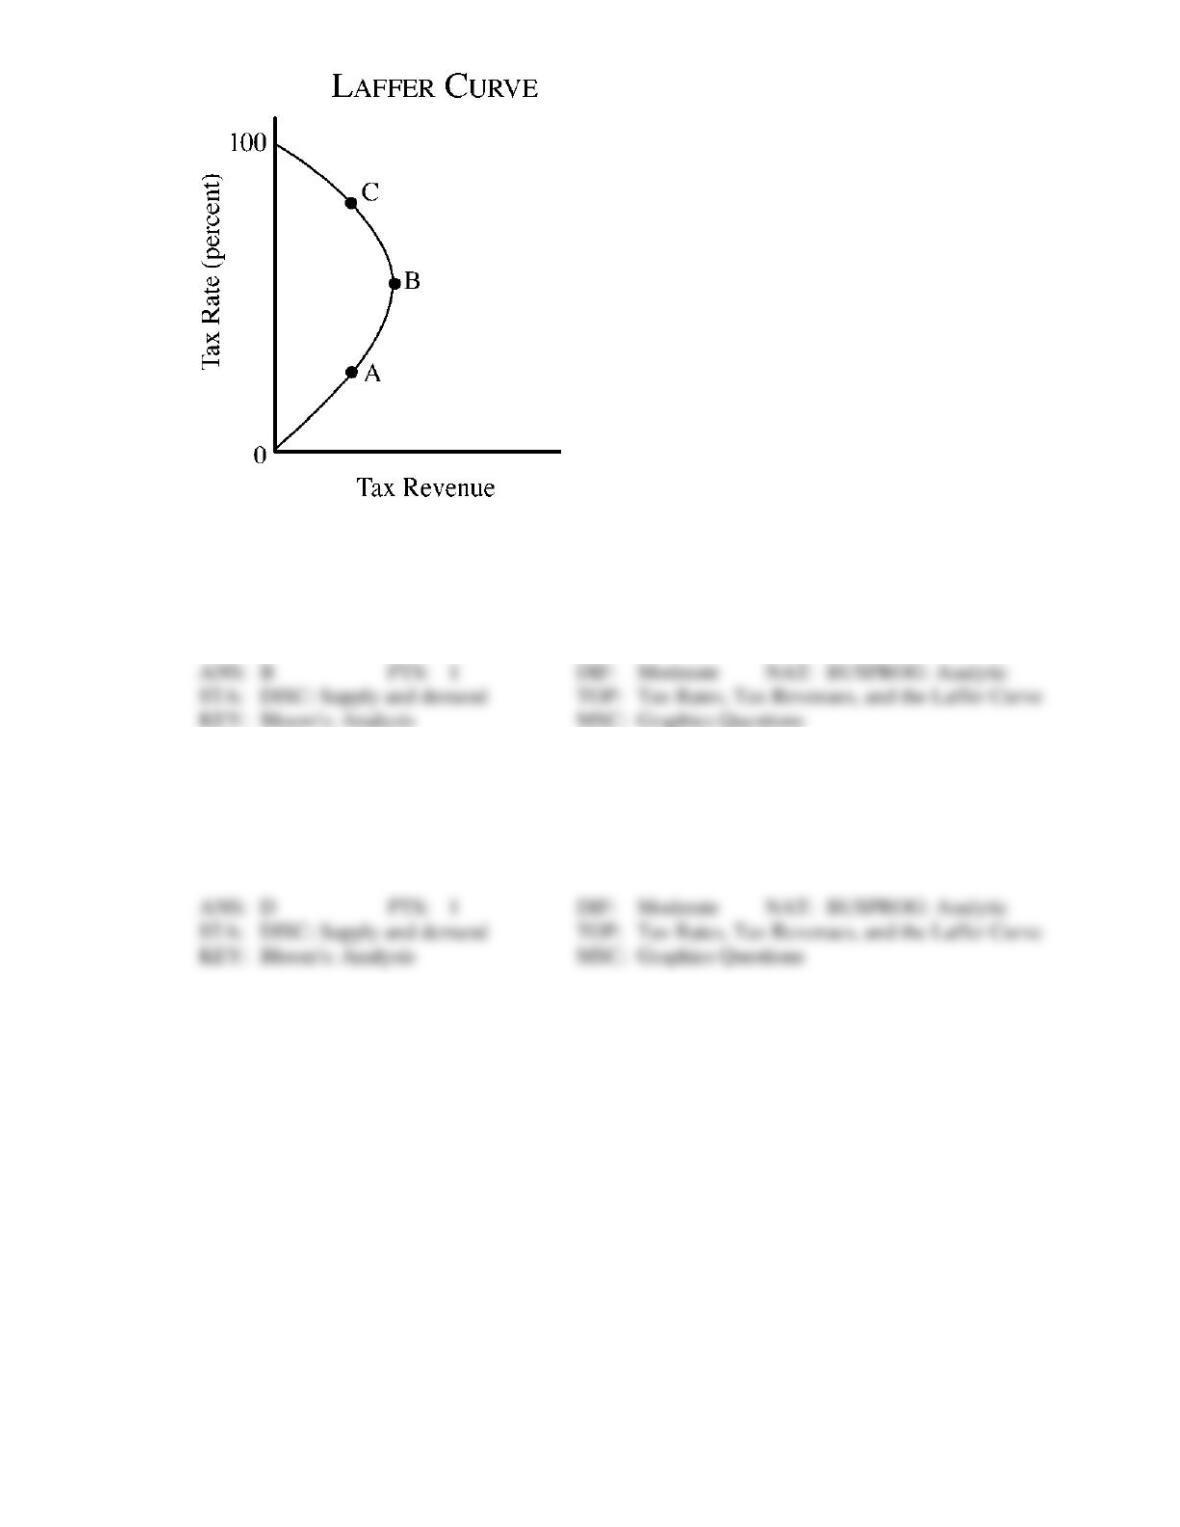
226. Refer to Figure 4-11. On the Laffer curve shown, tax revenue could be increased by
a.
decreasing the marginal tax rates if we were currently at point A.
b.
decreasing the marginal tax rates if we were currently at point C.
c.
increasing the marginal tax rates if we were currently at point B.
d.
increasing the marginal tax rates if we were currently at point C.
227. Refer to Figure 4-11. On the Laffer curve shown, which of the following is true?
a.
Tax revenue would increase if marginal tax rates were lowered from point C.
b.
Tax revenue would decrease if marginal tax rates were lowered from point A.
c.
Tax revenues are maximized at a tax rate corresponding to point B.
d.
All of the above are true.
Use the figure below to answer the following question(s).
Figure 4-12
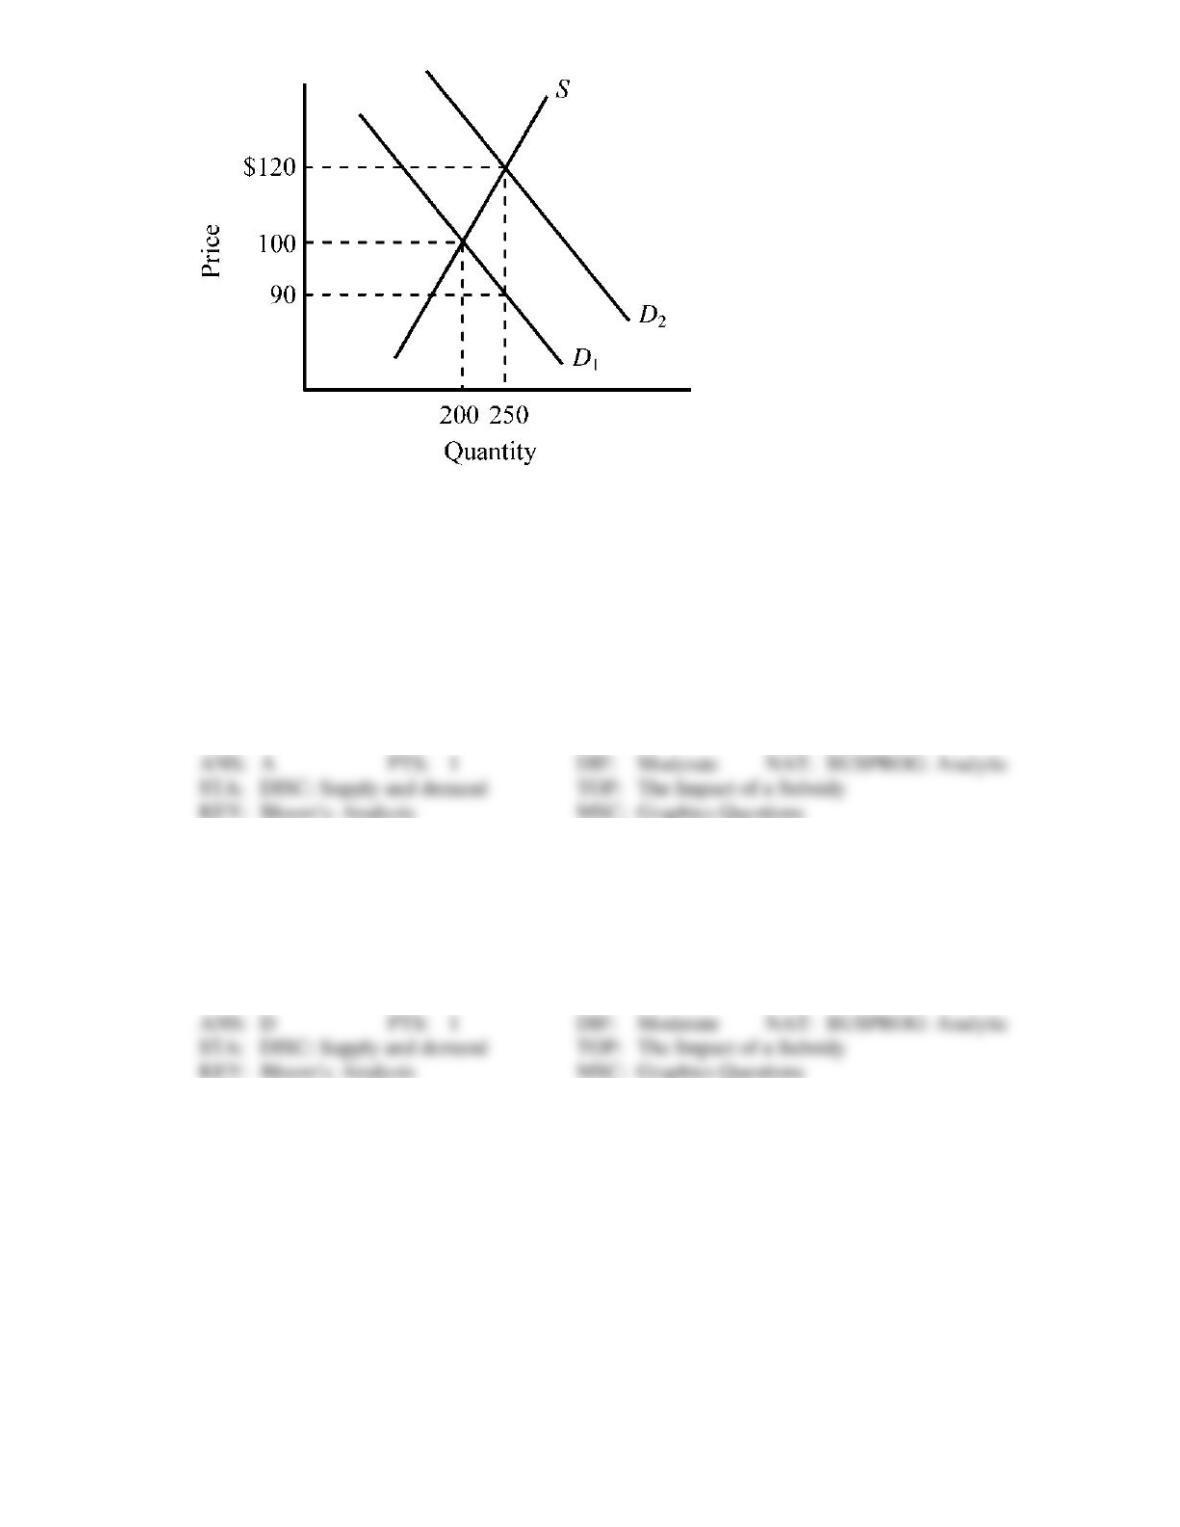
228. Refer to Figure 4-12. The supply curve S and the demand curve D1 indicate initial conditions in the
market for college textbooks. A new government program is implemented that grants students a $30
per textbook subsidy on every textbook they purchase, shifting the demand curve from D1 to D2.
Which of the following is true for this subsidy given the information provided in the exhibit?
a.
Textbook buyers will receive an actual benefit of $10 from the subsidy, while textbook
sellers will receive an actual benefit of $20 from the subsidy.
b.
Textbook buyers will receive an actual benefit of $20 from the subsidy, while textbook
sellers will receive an actual benefit of $10 from the subsidy.
c.
Textbook buyers will receive the full $30 benefit from the subsidy.
d.
Textbook sellers will receive the full $30 benefit from the subsidy.
229. Refer to Figure 4-12. The exhibit illustrates the impact of granting a subsidy on a particular good.
Which of the following is true for this subsidy given the information provided in the exhibit?
a.
The subsidy has been statutorily (legally) paid to buyers.
b.
The subsidy results in an increase in the selling price of the good.
c.
Sellers will receive a larger proportion of the benefit from this subsidy than buyers.
d.
All of the above are true.
230. Refer to Figure 4-12. The supply curve S and the demand curve D1 indicate initial conditions in the
market for college textbooks. A new government program is implemented that grants students a $30
per textbook subsidy on every textbook they purchase, shifting the demand curve from D1 to D2.
Which of the following is true for this subsidy given the information provided in the exhibit?
a.
The original average selling price of textbooks was $100, and after the subsidy it rises to
$120.
b.
$90 represents the net price a buyer must pay for a textbook after taking into account the
subsidy payment.
c.
Textbook buyers will receive an actual benefit of $10 from the subsidy, while textbook
sellers will receive an actual benefit of $20 from the subsidy.
d.
All of the above are true.
Use the figure below to answer the following question(s).
Figure 4-13
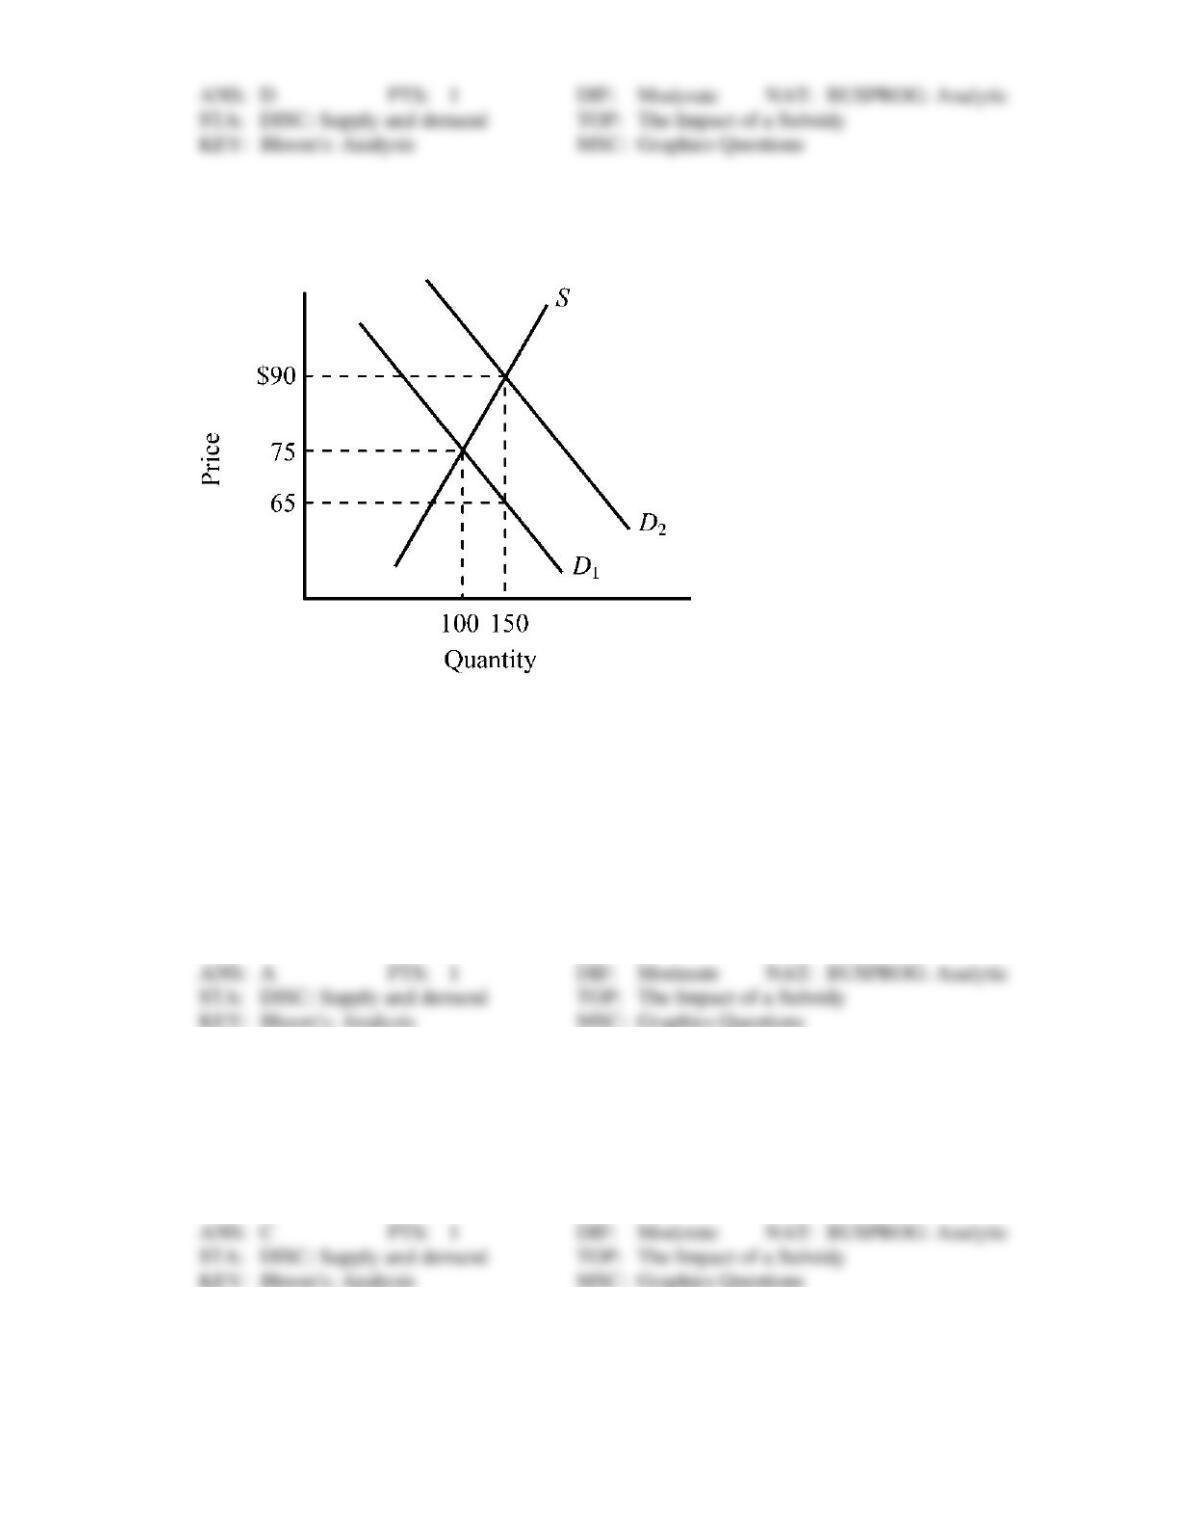
231. Refer to Figure 4-13. The supply curve S and the demand curve D1 indicate initial conditions in the
market for flu shots. A new government program is implemented that grants buyers a $25 subsidy
when they buy a flu shot, shifting the demand curve from D1 to D2. Which of the following is true for
this subsidy given the information provided in the exhibit?
a.
Buyers of flu shots will receive an actual benefit of $10 from the subsidy, while sellers of
flu shots will receive an actual benefit of $15 from the subsidy.
b.
Buyers of flu shots will receive an actual benefit of $15 from the subsidy, while sellers of
flu shots will receive an actual benefit of $10 from the subsidy.
c.
Buyers of flu shots will receive the full $25 benefit from the subsidy.
d.
Sellers of flu shots will receive the full $25 benefit from the subsidy.
232. Refer to Figure 4-13. The exhibit illustrates the impact of granting a subsidy on a particular good.
Which of the following is true for this subsidy given the information provided in the exhibit?
a.
The subsidy has been statutorily (legally) paid to sellers.
b.
The subsidy results in a decrease in the market selling price of the good.
c.
Sellers will receive a larger proportion of the benefit from this subsidy than buyers.
d.
The subsidy results in a reduction in the quantity purchased.
233. Refer to Figure 4-13. The supply curve S and the demand curve D1 indicate initial conditions in the
market for flu shots. A new government program is implemented that grants buyers a $25 subsidy
when they buy a flu shot, shifting the demand curve from D1 to D2. Which of the following is true for
this subsidy given the information provided in the figure?
a.
The original price of a flu shot was $75, and after the subsidy, it rises to $90.
b.
$65 represents the net price a buyer must pay for a flu shot after taking into account the
subsidy payment.
c.
Buyers of flu shots will receive an actual benefit of $10 from the subsidy, while sellers of
flu shots will receive an actual benefit of $15 from the subsidy.
d.
All of the above are true.