CHAPTER 4—DEMAND ANALYSIS Key
1. If two services provide the same amount of satisfaction or utility, the consumer is said to display:
2. When preferences are transitive, consumers are able to:
3. A utility function is:
4. The utility derived from consumption is:
5. All combinations of goods and services that provide the same utility are identified by the:
6. The increase in overall consumption made possible by a price cut is the:
7. A utility function is a descriptive statement that relates total utility to:
8. According to the law of diminishing marginal utility:
9. Given limited budgets, consumers obtain the most satisfaction if they purchase goods and services that:
10. An indifference curve is a set of market baskets that:
11. An increase in the quantity purchased following a price cut is:
12. The marginal rate of substitution is always equal to:
13. If the quantity of X is measured on the horizontal axis and the quantity of Y is measured on the vertical axis,
14. Point elasticity measures elasticity:
15. Arc elasticity is measured:
16. With inelastic demand, a price increase produces:
17. A direct relation exists between the price of one product and the demand for:
18. The demand for a product tends to be inelastic if:
19. If the income elasticity of demand for a good is greater than one, the good is:
20. A product that enjoys rapidly growing demand over time is likely to be:
21. When the product demand curve is Q = 140 – 10P, and price is decreased from P1 = $10 to P2 = $9, the arc
price elasticity of demand is:
22. Goods for which eI > 1 are often referred to as:
23. If eP = -3 and MC = $0.66, the profit-maximizing price is:
24. With elastic demand:
25. When marginal cost is greater than zero, the profit-maximizing point price elasticity of demand must be:
26. Consumer Preferences. Indicate whether each of the following statements is true or false. Explain why.
A.
According to the more is better principle, all goods and services are desirable in the sense of being able to satisfy consumer wants.
B.
When preferences are complete, consumers know how much a given good or service is preferred compared to another good or service.
C.
The nonsatiation principle dictates that each incremental unit of consumption causes marginal utility to rise.
D.
If two services provide the same amount of satisfaction or utility, the consumer is said to display indifference between the two.
E.
The consumer’s understanding of cardinal utility makes possible a rank ordering of preferred goods and services.
A.
True. According to the more is better principle, all goods and services are desirable in the sense of being able to satisfy consumer wants.
services.
marginal utility is positive, not rising.
True. If two services provide the same amount of satisfaction or utility, the consumer is said to display indifference between the two.
E.
False. The consumer’s understanding of ordinal utility makes possible a rank ordering of preferred goods and services.
27. Utility Theory. Determine whether each of the following statements is true or false. Explain why.
A.
According to the theory of consumer behavior, more is not always better.
B.
Consumers must know how much one product is preferred over another in order to make informed consumption decisions.
C.
A utility function is a descriptive statement that relates satisfaction or well-being to the consumption of goods and services.
D.
The nonsatiation principle is specific to a given time and place.
E.
Total utility measures the consumer’s overall level of satisfaction derived from consumption activities
28. Indifference Curves. Confirm that each of the following statements is true or false. Explain why.
A.
Intersecting indifference curves would reflect a violation of the “more is better” principle.
B.
Indifference curves must have positive slope.
C.
Higher indifference curves are better.
D.
The law of diminishing marginal utility gives indifference curves a bowed outward, or convex to the origin, appearance
E.
Indifference curves represents all market baskets that provide a given consumer the same amount of utility or satisfaction.
fact that goods and services both provide consumer benefits, and reflects the “more is better” principle.
maintain the same degree of utility. As a result, indifference curves have negative slope.
to lower indifference curves that represent smaller combinations of goods and services.
appearance
E.
True. Indifference curves represent all market baskets that provide a given consumer the same amount of utility or satisfaction.
29. Substitutes and Complements. Determine whether each of the following statements is true or false.
Indicate why.
A.
Substitutes are goods and services that become more desirable when consumed together.
B.
Complements are goods and services that can be used to fulfill a similar need or desire.
C.
When goods and service can be freely but imperfectly substituted, indifference curves have a U-shape.
D.
Perfect substitutes are goods and services that satisfy the same need or desire and have a L-shaped appearance..
E.
Perfect complements are goods and services consumed together in the same combination and have a straight-line appearance.
A.
False. Substitutes are goods and services that can be used to fulfill a similar need or desire.
B.
False. Goods and services that become more desirable when consumed together are called complements.
C.
True. When goods and service can be freely but imperfectly substituted, indifference curves have a U-shape.
D.
False. Perfect substitutes are goods and services that satisfy the same need or desire and are represented by straight lines.
E.
False. Perfect complements are goods and services consumed together in the same combination and have a L-shaped appearance.
good or service.
preferred over another.
C.
True. A utility function is a descriptive statement that relates satisfaction or well-being to the consumption of goods and services.
additional satisfaction or well-being.
of other goods and services constant.
30. Consumer Surplus. Explain why each of the following statements is true or false.
A.
Consumer surplus exists if an individual consumer is able to buy something for less than the maximum amount they are willing to pay.
B.
Consumer surplus is the value of purchased goods and services and equals the amount paid to sellers.
C.
A firm can enhance profits by charging each customer a per-unit fee equal to marginal cost, plus a fixed fee equal to the amount of
consumer surplus generated at that per-unit fee.
D.
The optimal bundle price is a single lump sum amount equal to the total area under the demand curve at that point.
E.
If exact information about the value of each individual product for each individual consumer was available, the firm could earn
maximum profits by precisely tying the price charged to the marginal value derived by each customer.
31. Elasticity. The demand for mini cassette players can be characterized by the following point elasticities:
price elasticity = -2, cross-price elasticity with AA Alkaline batteries = -1.5, and income elasticity = 3. Indicate
whether each of the following statements is true or false, and explain your answer.
A.
A price increase for cassette players will decrease both the number of units demanded and the total revenue of sellers.
B.
The cross-price elasticity indicates that a 2% reduction in the price of cassette players will cause a 3% increase in battery demand.
C.
Demand for cassette players is price elastic and they are cyclical normal goods.
D.
Falling battery prices will definitely increase revenues received by sellers of both cassette players and batteries.
E.
A 3% price reduction in cassette players would be necessary to overcome the effects of a 2% decline in income.
elasticity indicates that this is indeed the case here. The fact that price elasticity equals -2 indicates that demand is elastic with respect to
price, and therefore that a price increase will also decrease total revenues.
B.
False. The cross-price elasticity indicates that a 2% decrease in the price of batteries will have the effect of increasing cassette player
demand by 3%.
True. Demand is price elastic (see part A). Because the income elasticity is positive, cassette players are a normal good. Moreover,
because the income elasticity is greater than one, cassette player demand is also cyclical.
will increase the demand for cassette players and resulting revenues for sellers. However, we have no information concerning the price
elasticity of demand for batteries, and therefore do not know the effect of falling battery prices on battery revenues.
E.
True. A 3% reduction in price will cause a 6% increase in the quantity of cassette players demanded. A 2% decline in income will cause
a 6% fall in demand. These changes will be mutually offsetting.
True. Consumers buy goods and services because transacting in the marketplace makes them better off. Consumer surplus exists if an
individual consumer is able to buy something for less than the maximum amount they are willing to pay.
B.
False. Consumer surplus is the value of purchased goods and services above and beyond the amount paid to sellers.
True. In general, a firm can enhance profits by charging each customer a per-unit fee equal to marginal cost, plus a fixed fee equal to the
amount of consumer surplus generated at that per-unit fee.
D.
True. The optimal bundle price is a single lump sum amount equal to the total area under the demand curve at that point.
E.
True. If exact information about the value of each individual product for each individual consumer was available, the firm could earn
maximum profits by precisely tying the price charged to the marginal value derived by each customer.
32. Elasticity. The demand for Penn’s Oil motor oil can be characterized by the following point elasticities:
price elasticity = -2.5, cross-price elasticity with Value Lean motor oil = 1.5, and income elasticity = 0.75.
Indicate whether each of the following statements is true or false, and explain your answer.
A.
A price increase for Penn’s Oil will decrease both the number of units demanded and the total revenue of sellers.
B.
The cross-price elasticity indicates that a 2% increase in the price of Value Lean will cause a 3% increase in Penn’s Oil demand.
C.
Demand for Penn’s Oil is price elastic and the motor oil is a cyclical, normal good.
D.
Falling Value Lean prices will definitely increase revenues received by manufacturers of both brands of oil.
E.
A 0.9% price reduction for Penn’s Oil would be necessary to overcome the effects of a 3% decline in income.
33. Demand Analysis. The Crank Yankers DVD (season two) has been a hot seller during recent weeks. An
analysis of weekly demand shows:
Q = 3,000 – 90P
where Q is DVD sales and P is price.
A.
How many DVDs could be sold at a $20 price?
B.
Calculate the point price elasticity of demand at a price of $20.
Q
= 3,000 – 90P
= 3,000 – 90(20)
= 1,200
B.
The point price elasticity of demand at a price of $20 is calculated as follows:
to price, and therefore that a price increase will also decrease total revenues.
income elasticity is less than one, Penn’s Oil demand is not cyclical.
price elasticity of demand for Value Lean, and therefore do not know the effect of falling prices on its revenues.
a 2.25% fall in demand. These changes will be mutually offsetting.
34. Demand Analysis. The South Park DVD (season three) has been a slow seller during recent months. An
analysis of monthly demand shows:
Q = 5,000 – 160P
where Q is DVD sales and P is price.
A.
How many DVDs could be sold at a $25 price?
B.
Calculate the point price elasticity of demand at a price of $25.
35. Demand Analysis. The CSI DVD (season four) has been a hot seller during recent weeks. An analysis of
weekly demand shows:
Q = 15,000 – 500P
where Q is DVD sales and P is price.
A.
How many DVDs could be sold at a $20 price?
B.
Calculate the point price elasticity of demand at a price of $20.
A.
Q
= 15,000 – 500P
= 15,000 – 500(20)
= 5,000
The point price elasticity of demand at a price of $20 is calculated as follows:
A.
Q
= 5,000 – 160P
= 5,000 – 160(25)
= 1,000
B.
The point price elasticity of demand at a price of $25 is calculated as follows:

36. Demand Analysis. KRDY-FM is contemplating a T-shirt advertising promotion. Monthly sales data from
T-shirt shops marketing the “Listen to KRDY-FM” design indicate that:
Q = 15,000 – 800P
where Q is T-shirt sales and P is price.
A.
How many T-shirts could KRDY-FM sell at $15 each?
B.
What price would KRDY-FM have to charge to sell 5,000 T-shirts?
C.
At what price would T-shirt sales equal zero?
D.
How many T-shirts could be given away?
E.
Calculate the point price elasticity of demand at a price of $15.
A.
Q
= 15,000 – 800P
= 15,000 – 800(15)
= 3,000
B.
Q
= 15,000 – 800P
5,000
= 15,000 – 800P
800P
= 10,000
P
= $12.50
C.
Q
= 15,000 – 800P
0
= 15,000 – 800P
800P
= 15,000
P
= $18.75
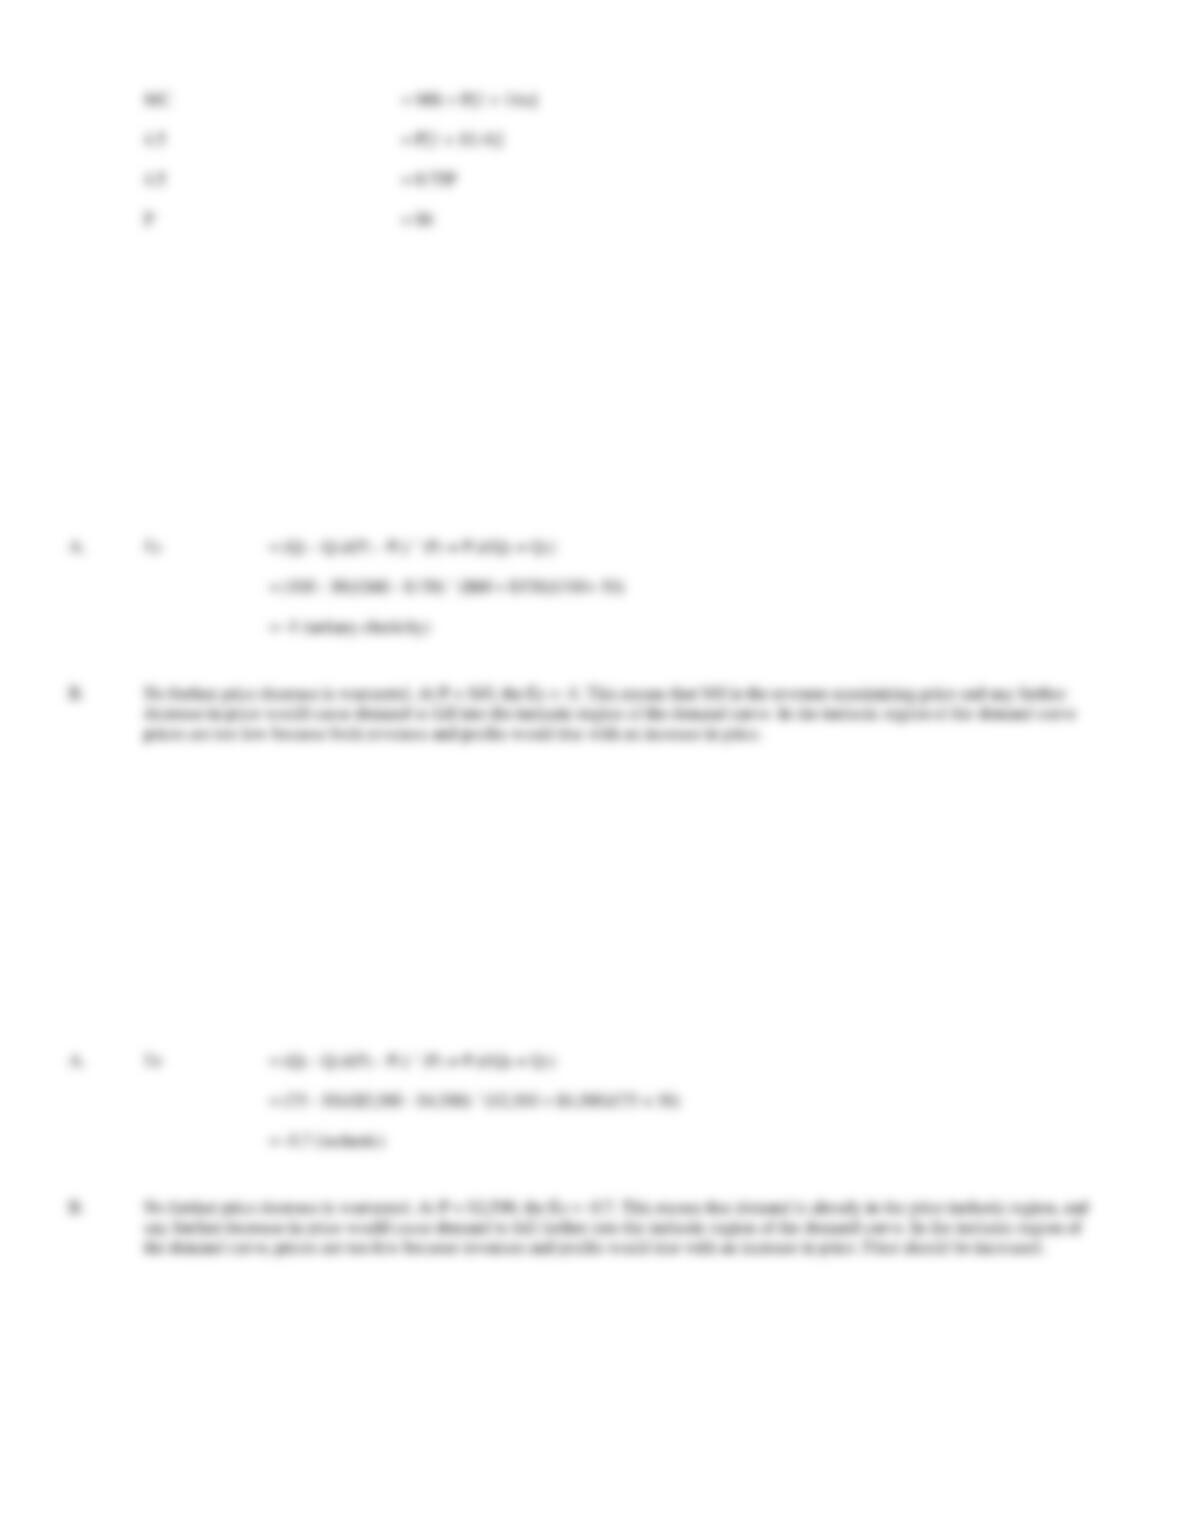
D.
Q
= 15,000 – 800P
Q
= 15,000 – 800(0)
Q
= 15,000
E.
The point price elasticity of demand at a price of $15 is calculated as follows:
37. Demand Analysis. The San Diego Zoo is contemplating a stuffed panda bear advertising promotion.
Annualized sales data from local shops marketing the “Can’t Bear it When You’re Away” bear indicate that:
Q = 50,000 – 1,000P
where Q is Panda bear sales and P is price.
A.
How many pandas could the zoo sell at $30 each?
B.
What price would the zoo have to charge to sell 25,000 pandas?
C.
At what price would panda sales equal zero?
D.
How many bears could be given away?
E.
Calculate the point price elasticity of demand at a price of $10.
A.
Q
= 50,000 – 1,000P
= 50,000 – 1,000(30)
= 20,000
B.
Q
= 50,000 – 1,000P
25,000
= 50,000 – 1,000P
1,000P
= 25,000
P
= $25
C.
Q
= 50,000 – 1,000P
0
= 50,000 – 1,000P
1,000P
= 50,000
P
= $50
D.
Q
= 50,000 – 1,000P
Q
= 50,000 – 1,000(0)
Q
= 50,000
E.
The point price elasticity of demand at a price of $30 is calculated as follows:

38. Demand Analysis. Robert E. Lee Grade School is contemplating a chocolate bar fund raiser. Weekly sales
data from Mrs. Grant’s fifth grade class indicate that:
Q = 4,000 – 1,000P
where Q is chocolate bar sales and P is price.
A.
How many chocolate bars could be sold at $2 each?
B.
What price would have to be charged to sell 2,500 chocolate bars?
C.
At what price would sales equal zero?
D.
How many chocolate bars could be given away?
E.
Calculate the point price elasticity of demand at a price of $2.
A.
Q
= 4,000 – 1,000P
= 4,000 – 1,000(2)
= 2,000
B.
Q
= 4,000 – 1,000P
2,500
= 4,000 – 1,000P
1,000P
= 1,500
P
= $1.50
C.
Q
= 4,000 – 1,000P
0
= 4,000 – 1,000P
1,000P
= 4,000
P
= $4
D.
Q
= 4,000 – 1,000P
Q
= 4,000 – 1,000(0)
Q
= 4,000
E.
The point price elasticity of demand at a price of $2 is calculated as follows:
39. Demand Analysis. Aspen, Colorado is engaging in a bumper-sticker advertising campaign. Monthly sales
data from ski shops selling the “Don’t Worry-Be Happy (in Aspen)” bumper-stickers indicate that:
Q = 6,000 – 2,000P
where Q is bumper-sticker sales and P is price.
A.
How many bumper-stickers could Aspen sell at $2 each?
B.
What price would Aspen have to charge to sell 5,000 bumper-stickers?
C.
At what price would bumper-sticker sales equal zero?
D.
How many bumper-stickers could be given away?
E.
Calculate the point price elasticity of demand at a price of $1.
A.
Q
= 6,000 – 2,000P
= 6,000 – 2,000(2)
= 2,000
B.
Q
= 6,000 – 2,000P
5,000
= 6,000 – 2,000P
2,000P
= 1,000
P
= $0.50
C.
Q
= 6,000 – 2,000P
0
= 6,000 – 2,000P
2,000P
= 6,000
P
= $3
D.
Q
= 6,000 – 2,000P
Q
= 6,000 – 2,000(0)
Q
= 6,000
E.
The point price elasticity of demand at a price of $2 is calculated as follows:
40. Optimal Price. Last week, Discount Food Stores, Inc. reduced the average price on the 22 ounce size of
Dishwashing Liquid by 1%. In response, sales jumped by 8%.
A.
Calculate the point price elasticity of demand for Dishwashing Liquid.
B.
Calculate the optimal price for Dishwashing Liquid if marginal cost is 70¢ per unit.
= 0.08/(-0.01)
B.
The optimal price is found setting MC = MR and solving for P where:
= MR = P[1 + 1/eP]
0.7
= P[1 + 1/(-8)]
0.7
= 0.875P
P
= $0.80 or 80¢
41. Optimal Price. Last week, Wally’s Burgers, Inc. reduced the average price on the 1/2-pound Papa burger by
1%. In response, sales jumped by 2%.
A.
Calculate the point price elasticity of demand for Papa burgers.
B.
Calculate the optimal price for Papa burgers if marginal cost is $1 per unit.
= 0.02/(-0.01)
B.
The optimal price is found setting MC = MR and solving for P where:
42. Optimal Price. Last month, Forest Lumber, Inc. reduced the average price on the eight-foot pine 2´4s by
1%. In response, sales jumped by 4%.
A.
Calculate the point price elasticity of demand for eight-foot 2´4s.
B.
Calculate the optimal price for eight-foot 2´4s if marginal cost is $1.50 per unit.
= 0.04/(-0.01)
B.
The optimal price is found setting MC = MR and solving for P where:
= MR = P[1 + 1/eP]
1.5
= 0.75P
43. Optimal Price. Last month, Rick’s Bike Shop, Inc. increased the price on the 24 ounce can of bearing
grease by 1%. In response, sales dropped by 4%.
A.
Calculate the point price elasticity of demand for bearing grease.
B.
Calculate the optimal price for bearing grease if marginal cost is $4.50 per unit.
B.
The optimal price is found setting MC = MR and solving for P where:
= MR = P[1 + 1/eP]
1
= P[1 + 1/(-2)]
1
= 0.5P
P
= $2
44. Arc Price Elasticity. Assume that amazon.com dropped the price on a men’s Seiko watch (SGF719) from
$120 to $60, and sales jumped from 50 to 100 units per day.
A.
Calculate the implied arc price elasticity of demand.
B.
Is a further price decrease warranted? Why or why not?
= (100 – 50)/($60 – $120) ´ ($60 + $120)/(100+ 50)
45. Arc Price Elasticity. Assume that amazon.com cut the price on a 1.10ct Princess Cut Diamond Solitaire
engagement ring from $4,500 to $2,500, and sales rose from 50 to 75 units per week.
A.
Calculate the implied arc price elasticity of demand.
B.
Is a further price decrease warranted? Why or why not?
A.
= (Q2 – Q1)/(P2 – P1) ´ (P2 + P1)/(Q2 + Q1)
= (75 – 50)/($2,500 – $4,500) ´ ($2,500 + $4,500)/(75 + 50)
the demand curve, prices are too low because revenues and profits would rise with an increase in price. Price should be increased.
= MR = P[1 + 1/eP]
4.5
= P[1 + 1/(-4)]
4.5
= 0.75P
P
= $6
46. Arc Income Elasticity. Glenco Motors sells an average of 20 Toyota Camry XLE four-door sedans per
month. Evanston Toyota sells twice as many. Based upon data obtained in the financing process, Glenco
customers earn an average household income of $100,000 per year, while Evanston customers earn $125,000
per year.
A.
Calculate the implied arc income elasticity of demand.
B.
How would you characterize demand for these Toyota Camrys?
47. Arc Income Elasticity. The Omaha Best Buy sells seventy-five 50″ HDTVs per week whereas the Des
Moines store sells only fifty 50″ HDTVs per week. Based upon data obtained in the financing process, Omaha
customers earn an average income of $55,000 per year, while Des Moines customers earn $45,000 per year.
A.
Calculate the implied arc income elasticity of demand.
B.
How would you characterize demand for these 50″ HDTVs?
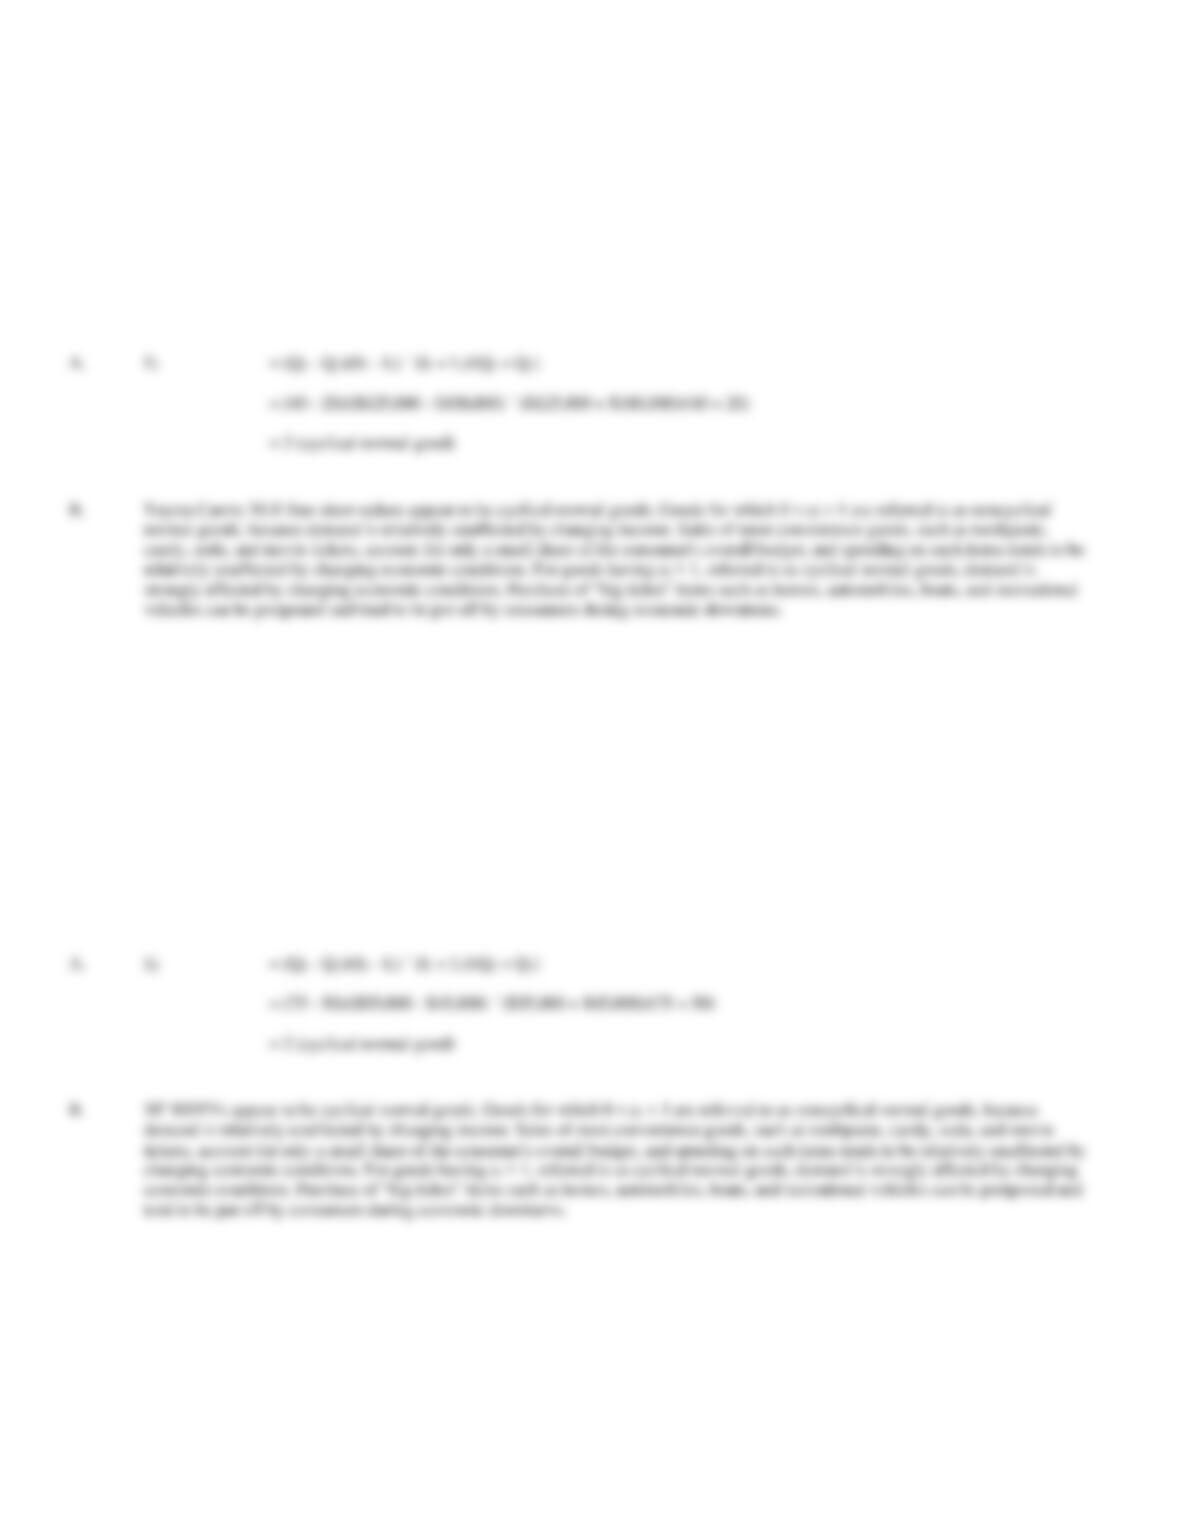
A.
= (Q2 – Q1)/(I2 – I1) ´ (I2 + I1)/(Q2 + Q1)
= (75 – 50)/($55,000 – $45,000) ´ ($55,000 + $45,000)/(75 + 50)
= 2 (cyclical normal good)
tend to be put off by consumers during economic downturns.
= (Q2 – Q1)/(I2 – I1) ´ (I2 + I1)/(Q2 + Q1)
= (40 – 20)/($125,000 – $100,000) ´ ($125,000 + $100,000)/(40 + 20)
= 3 (cyclical normal good)
vehicles can be postponed and tend to be put off by consumers during economic downturns.
48. Income Elasticity. Deluxe Carpeting, Inc., is a leading manufacturer of stain-resistant carpeting. Demand
for Deluxe products is tied to the overall pace of building and remodeling activity and, therefore, is sensitive to
changes in national income. The carpet manufacturing industry is highly competitive, so Deluxe demand is also
very price-sensitive.
During the past year, Deluxe sold 28 million square feet of carpeting at an average wholesale price of $16 per
square foot. This year, GDP per capita is expected to fall from $57,000 to $51,000 as the nation enters a steep
recession. Without any price change, Deluxe expects current-year sales to fall to 20 million units.
A.
Calculate the implied arc income elasticity of demand.
B.
Given the projected fall in income, the sales manager believes that current volume of 28 million units could only be maintained with a
price cut of $2 per unit. On this basis, calculate the implied arc price elasticity of demand.
C.
Holding all else equal, would a further increase in price result in higher or lower total revenue?
49. Income Elasticity. The Electronics Warehouse, Inc. is a leading retailer of home theater systems. Demand
for home theater systems is sensitive to changes in national income. Electronics retailing is highly competitive,
so retail demand for home theater systems is also very price-sensitive. During the past year, the Electronics
Warehouse sold 550,000 home theater systems at an average retail price of $4,000 per unit. This year, GDP per
household is expected to fall from $58,800 to $53,200 as the nation enters a steep recession. Without any price
change, the Electronics Warehouse expects current-year sales to fall to 450,000 units.
A.
Calculate the implied arc income elasticity of demand.
B.
Given the projected fall in income, the sales manager believes that current volume of 550,000 units could only be maintained with a
price cut of $500 per unit. On this basis, calculate the implied arc price elasticity of demand.
C.
Holding all else equal, would a further increase in price result in higher or lower total revenue?
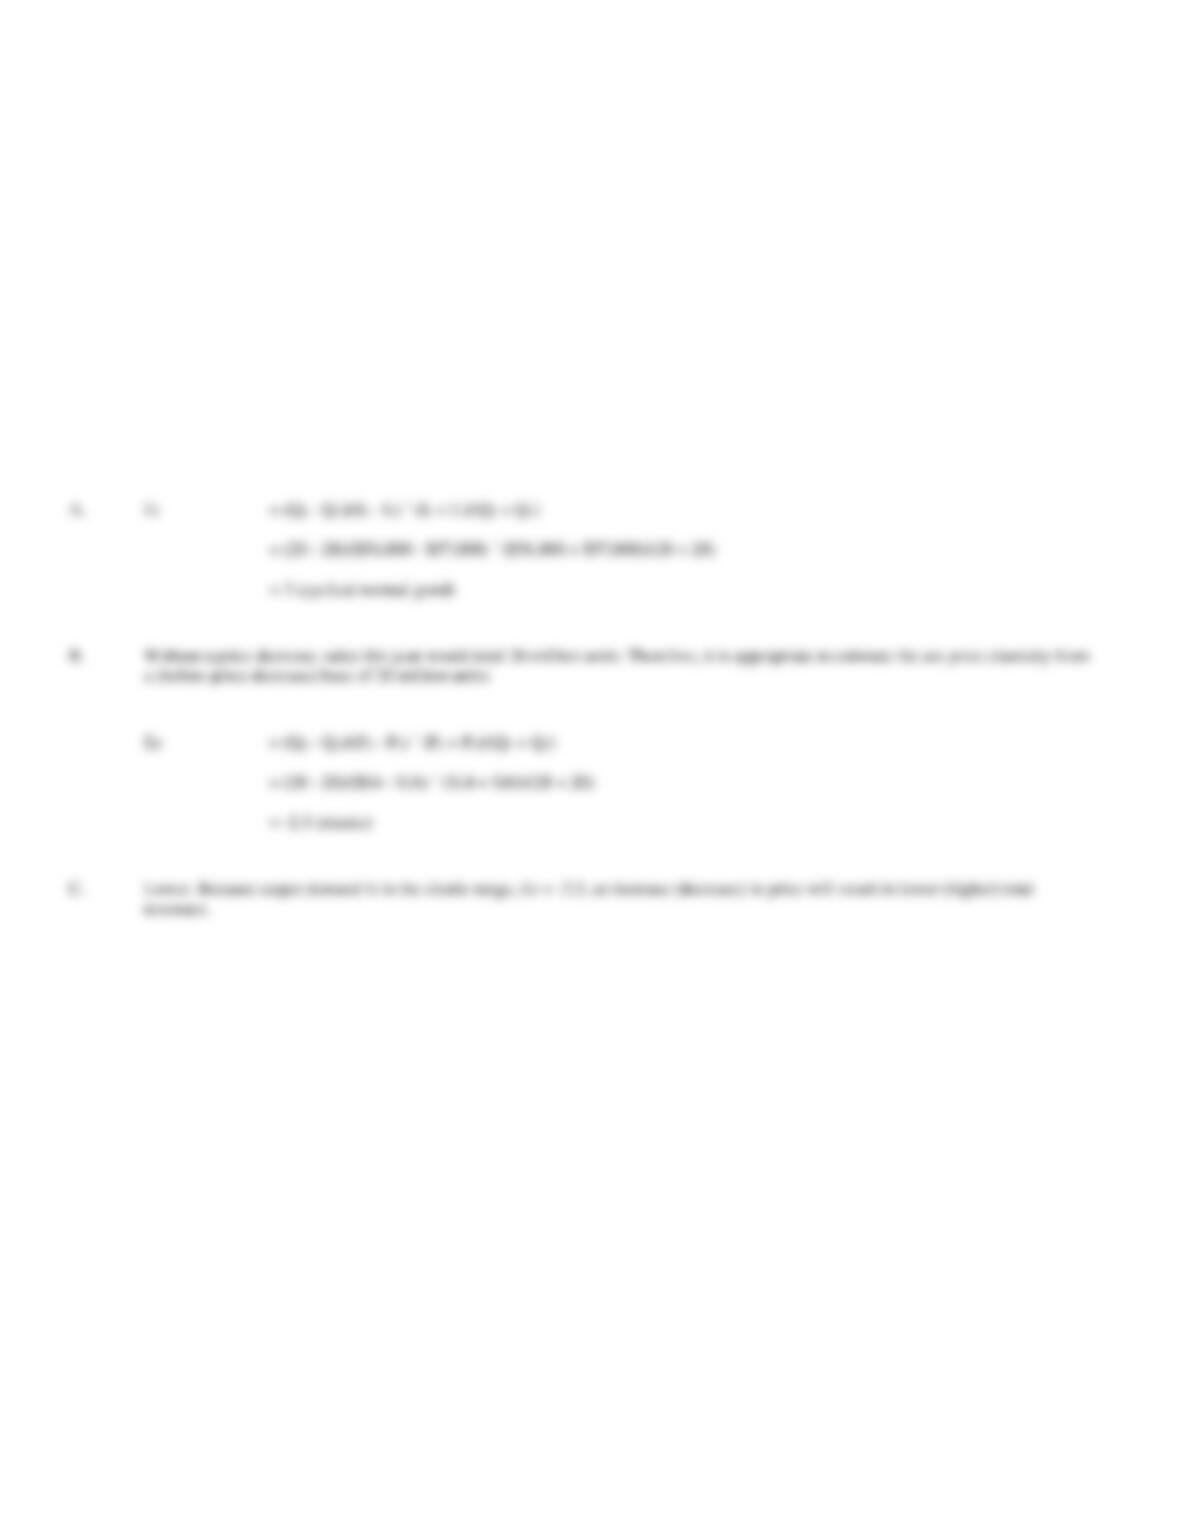
A.
= (Q2 – Q1)/(I2 – I1) ´ (I2 + I1)/(Q2 + Q1)
= (20 – 28)/($51,000 – $57,000) ´ ($51,000 + $57,000)/(20 + 28)
= 3 (cyclical normal good)
B.
Without a price decrease, sales this year would total 20 million units. Therefore, it is appropriate to estimate the arc price elasticity from
a (before-price-decrease) base of 20 million units:
= (Q2 – Q1)/(P2 – P1) ´ (P2 + P1)/(Q2 + Q1)
= (28 – 20)/($14 – $16) ´ ($14 + $16)/(28 + 20)
C.
Lower. Because carpet demand is in the elastic range, EP = -2.5, an increase (decrease) in price will result in lower (higher) total
revenues.
50. Price Elasticity. Z-Best Pizza recently decided to raise its regular price on medium pizzas from $9 to $12
following increases in the costs of labor and materials. Unfortunately, sales dropped sharply from 8,100 to
4,500 pizzas per month. In an effort to regain lost sales, Z-Best ran a coupon promotion featuring $5 off the new
regular price. Coupon printing and distribution costs totaled $100, and caused only a modest increase in the
typical advertising budget of $2,400 per month. The promotion was judged a success as it proved highly
popular with consumers. In the period prior to expiration, coupons were used on 40% of all purchases and
monthly sales rose to 7,500 pizzas.
A.
Calculate the arc price elasticity implied by the initial response to Z-Best’s price increase.
B.
Calculate the effective price reduction resulting from the coupon promotion.
C.
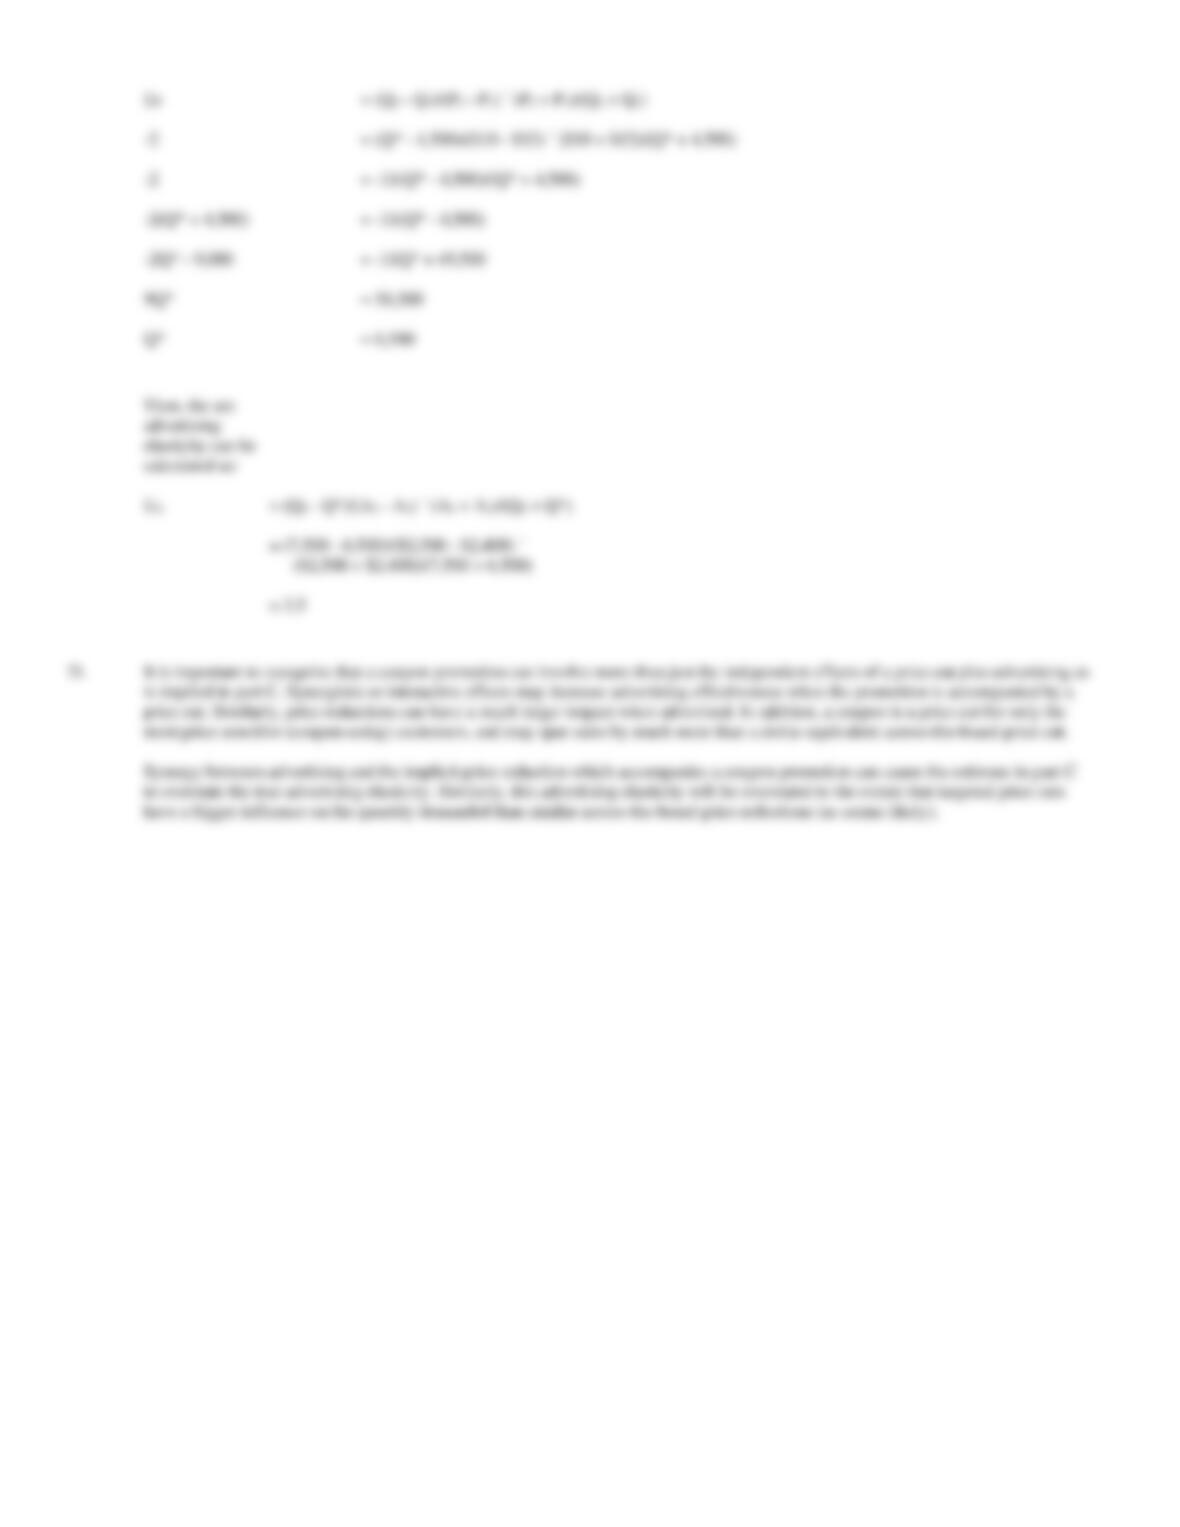
In light of this price reduction, and assuming no change in the price elasticity of demand, calculate Z-Best’s arc advertising elasticity.
D.
Why might the true arc advertising elasticity differ from that calculated in Part C?
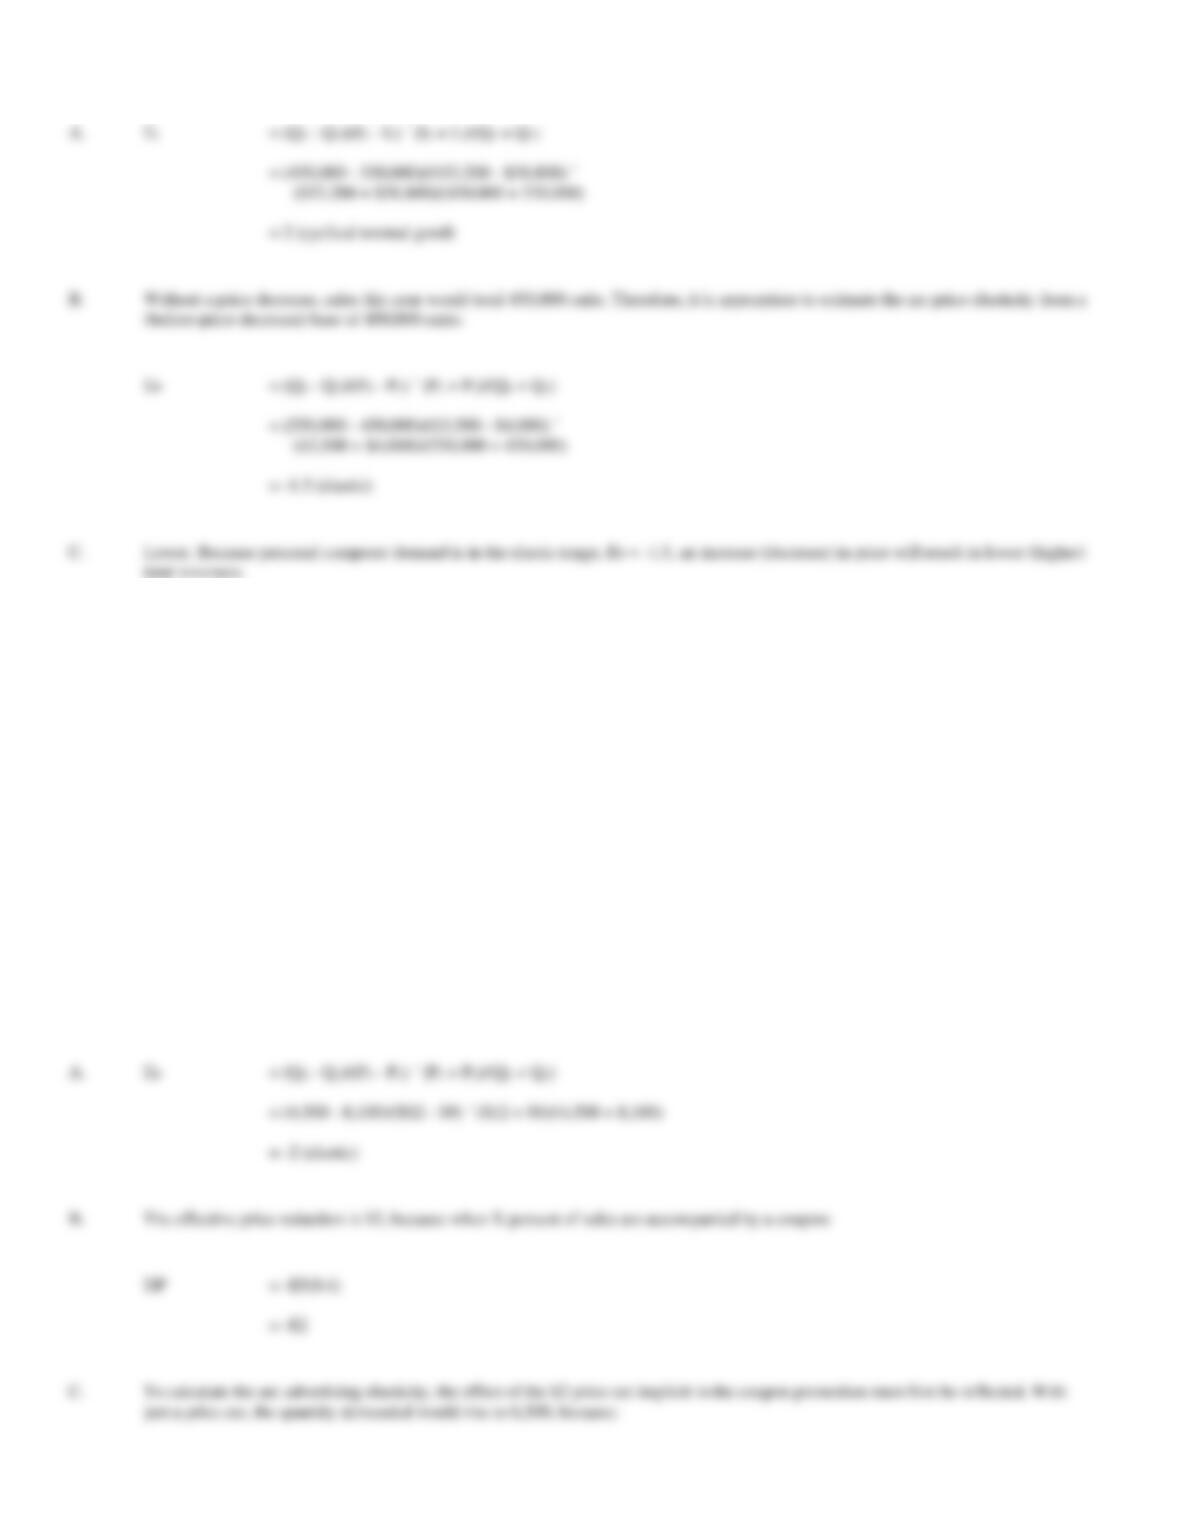
A.
= (Q2 – Q1)/(P2 – P1) ´ (P2 + P1)/(Q2 + Q1)
= (4,500 – 8,100)/($12 – $9) ´ ($12 + $9)/(4,500 + 8,100)
B.
The effective price reduction is $2, because when X percent of sales are accompanied by a coupon:
DP
just a price cut, the quantity demanded would rise to 6,500, because:
A.
= (Q2 – Q1)/(I2 – I1) ´ (I2 + I1)/(Q2 + Q1)
= (450,000 – 550,000)/($53,200 – $58,800) ´
($53,200 + $58,800)/(450,000 + 550,000)
= 2 (cyclical normal good)
(before-price-decrease) base of 450,000 units:
= (Q2 – Q1)/(P2 – P1) ´ (P2 + P1)/(Q2 + Q1)
= (550,000 – 450,000)/($3,500 – $4,000) ´
($3,500 + $4,000)/(550,000 + 450,000)
total revenues.