Chapter 04: Analysis of Financial Statements
b.
c.
d.
e.
MODERATE
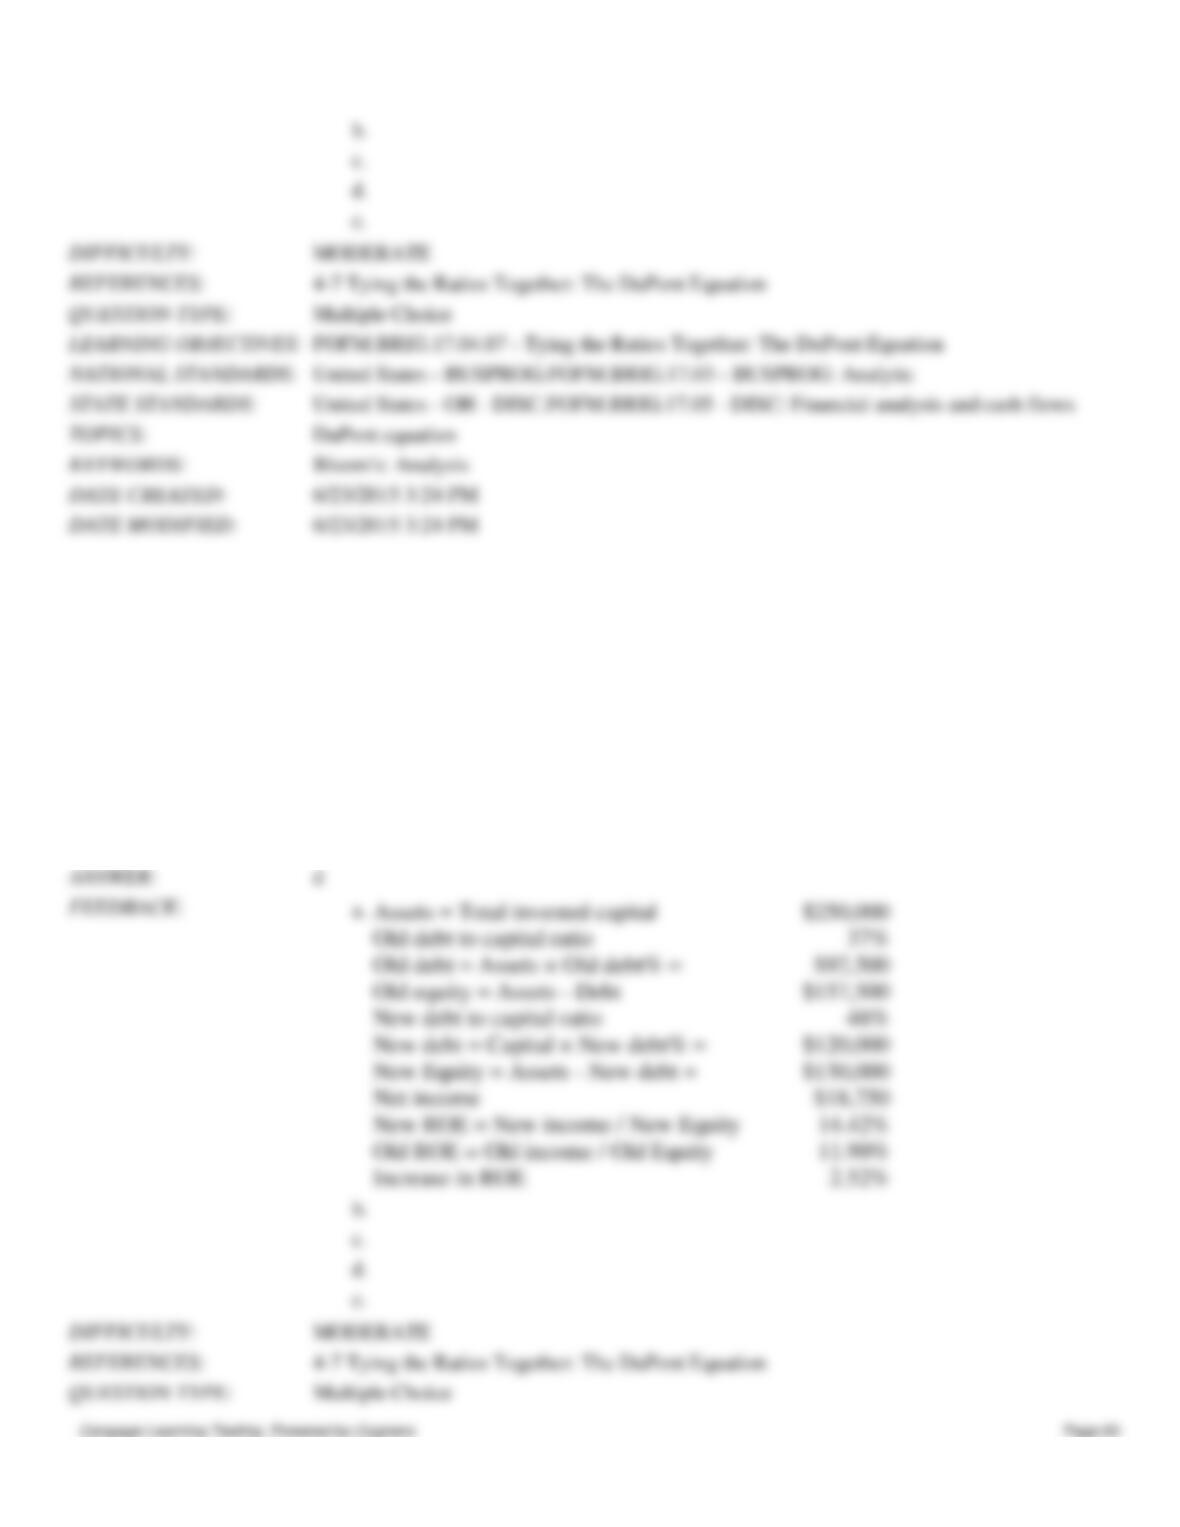
110. Last year Jandik Corp. had $250,000 of assets (which is equal to its total invested capital), $18,750 of net income,
and a debt-to-total-capital ratio of 37%. Now suppose the new CFO convinces the president to increase the debt-to-total-
capital ratio to 48%. Sales, total assets and total invested capital will not be affected, but interest expenses would increase.
However, the CFO believes that better cost controls would be sufficient to offset the higher interest expense and thus keep
net income unchanged. By how much would the change in the capital structure improve the ROE? Do not round your
intermediate calculations.
a.
1.94%
b.
2.07%
c.
2.57%
d.
2.52%
e.
1.96%
b.
c.
d.
e.
Chapter 04: Analysis of Financial Statements
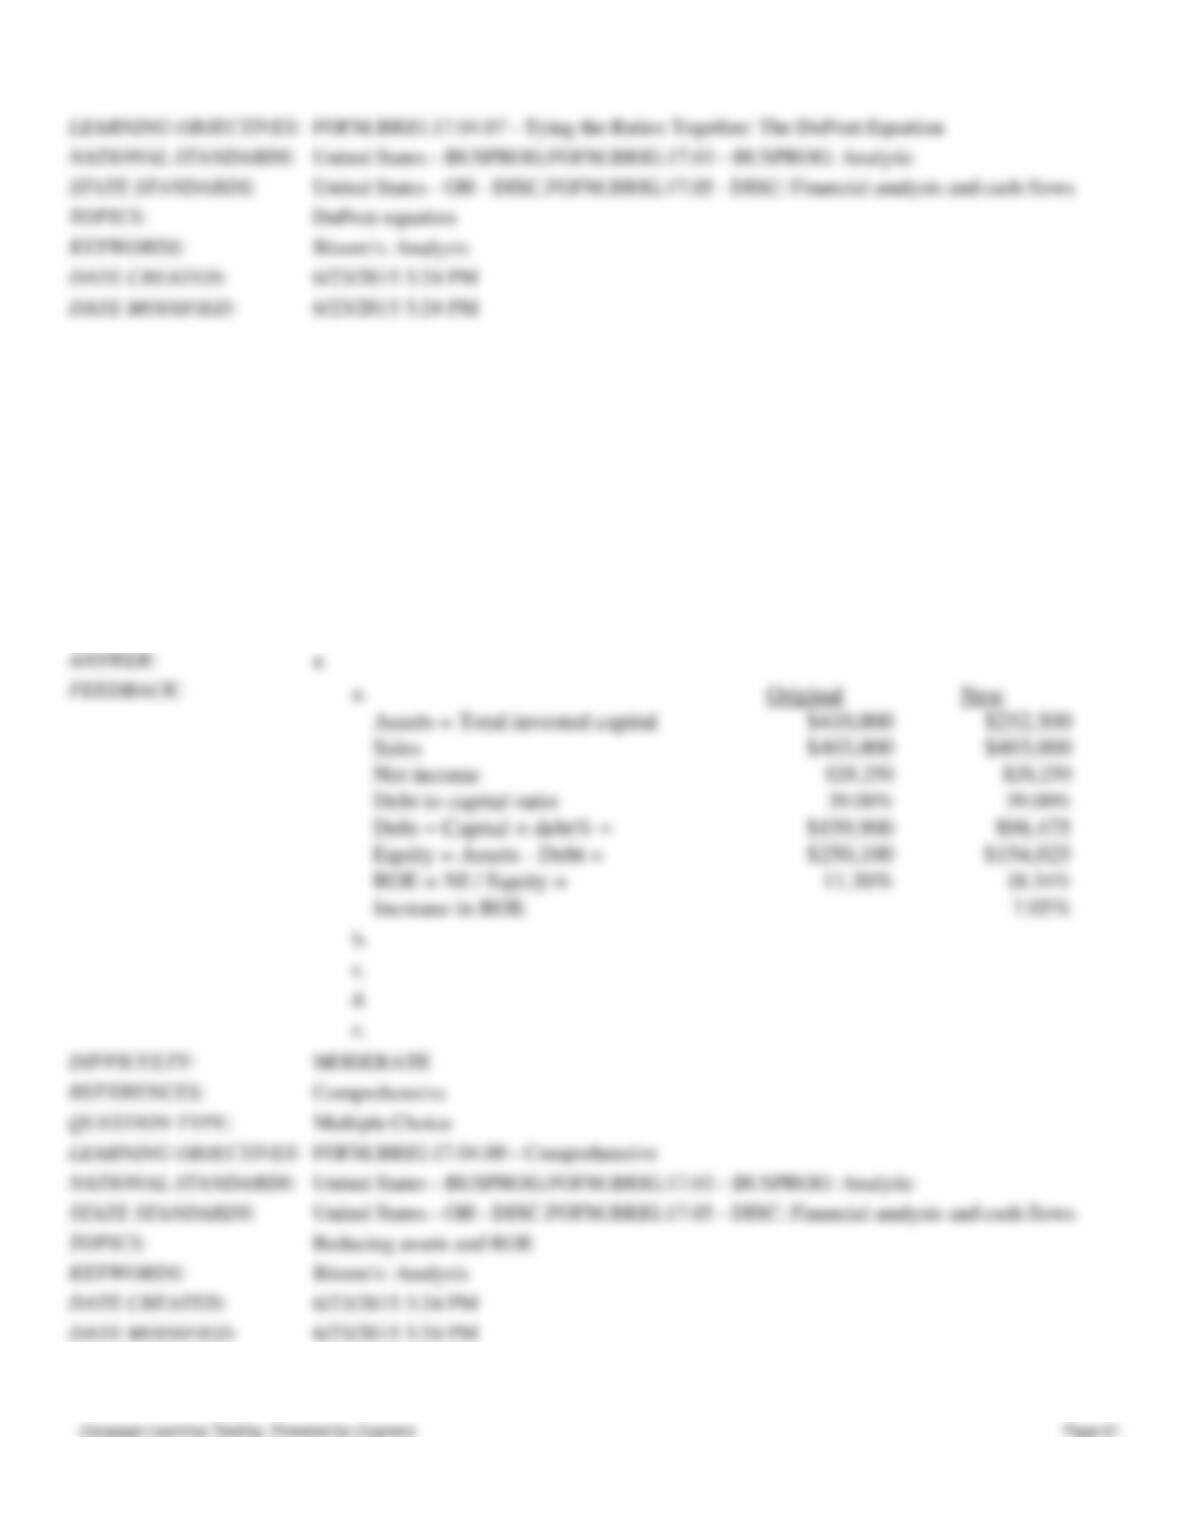
111. Last year Kruse Corp had $410,000 of assets (which is equal to its total invested capital), $403,000 of sales, $28,250
of net income, and a debt-to-total-capital ratio of 39%. The new CFO believes the firm has excessive fixed assets and
inventory that could be sold, enabling it to reduce its total assets and total invested capital to $252,500. The firm finances
using only debt and common equity. Sales, costs, and net income would not be affected, and the firm would maintain the
same capital structure (but with less total debt). By how much would the reduction in assets improve the ROE? Do not
round your intermediate calculations.
a.
7.05%
b.
6.69%
c.
6.41%
d.
7.26%
e.
7.82%
a
b.
c.
d.
e.
MODERATE
Comprehensive
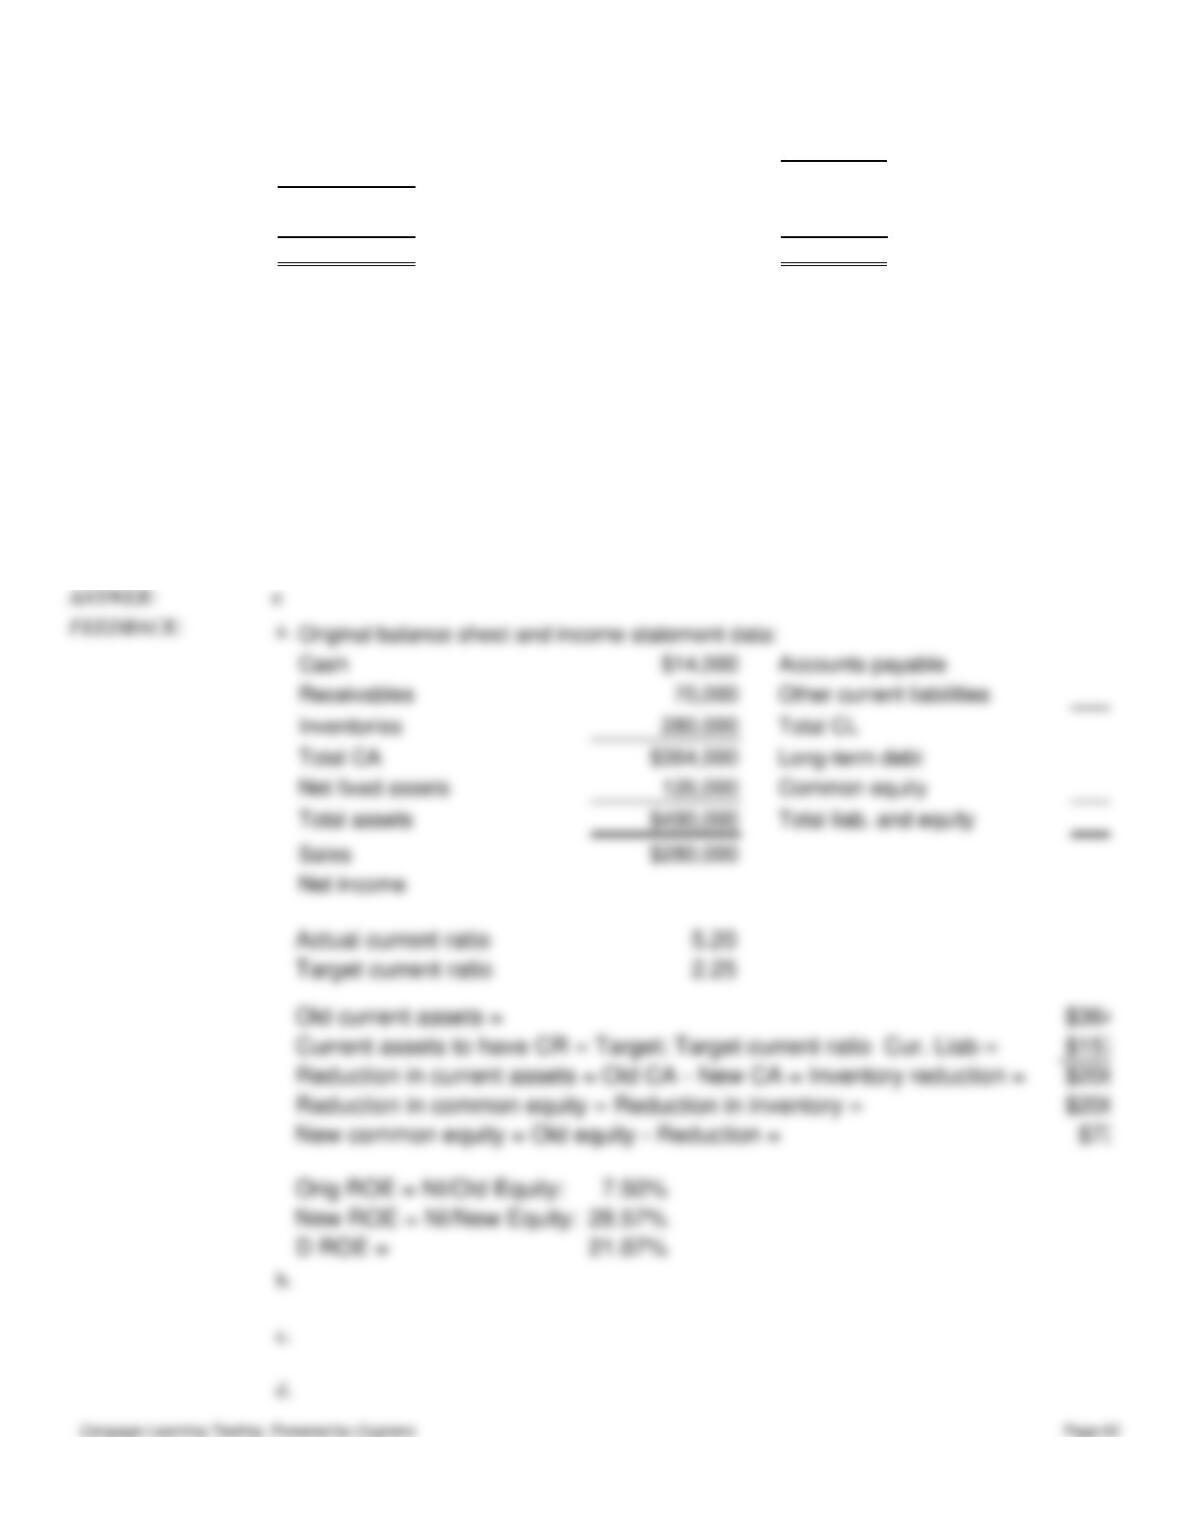
112. Jordan Inc has the following balance sheet and income statement data:
Chapter 04: Analysis of Financial Statements
Cash
$14,000
Accounts payable
$42,000
Receivables
70,000
Other current liabilities
28,000
Inventories
280,000
Total CL
$70,000
Total CA
$364,000
Long-term debt
140,000
Net fixed assets
126,000
Common equity
280,000
Total assets
$490,000
Total liab. and equity
$490,000
Sales
$280,000
Net income
21,000
The new CFO thinks that inventories are excessive and could be lowered sufficiently to cause the current ratio to equal the
industry average, 2.25, without affecting either sales or net income. Assuming that inventories are sold off and not
replaced to get the current ratio to the target level, and that the funds generated are used to buy back common stock at
book value, by how much would the ROE change? Do not round your intermediate calculations.
a.
16.65%
b.
22.13%
c.
22.55%
d.
21.07%
e.
21.07%
e
d.
Chapter 04: Analysis of Financial Statements
CHALLENGING
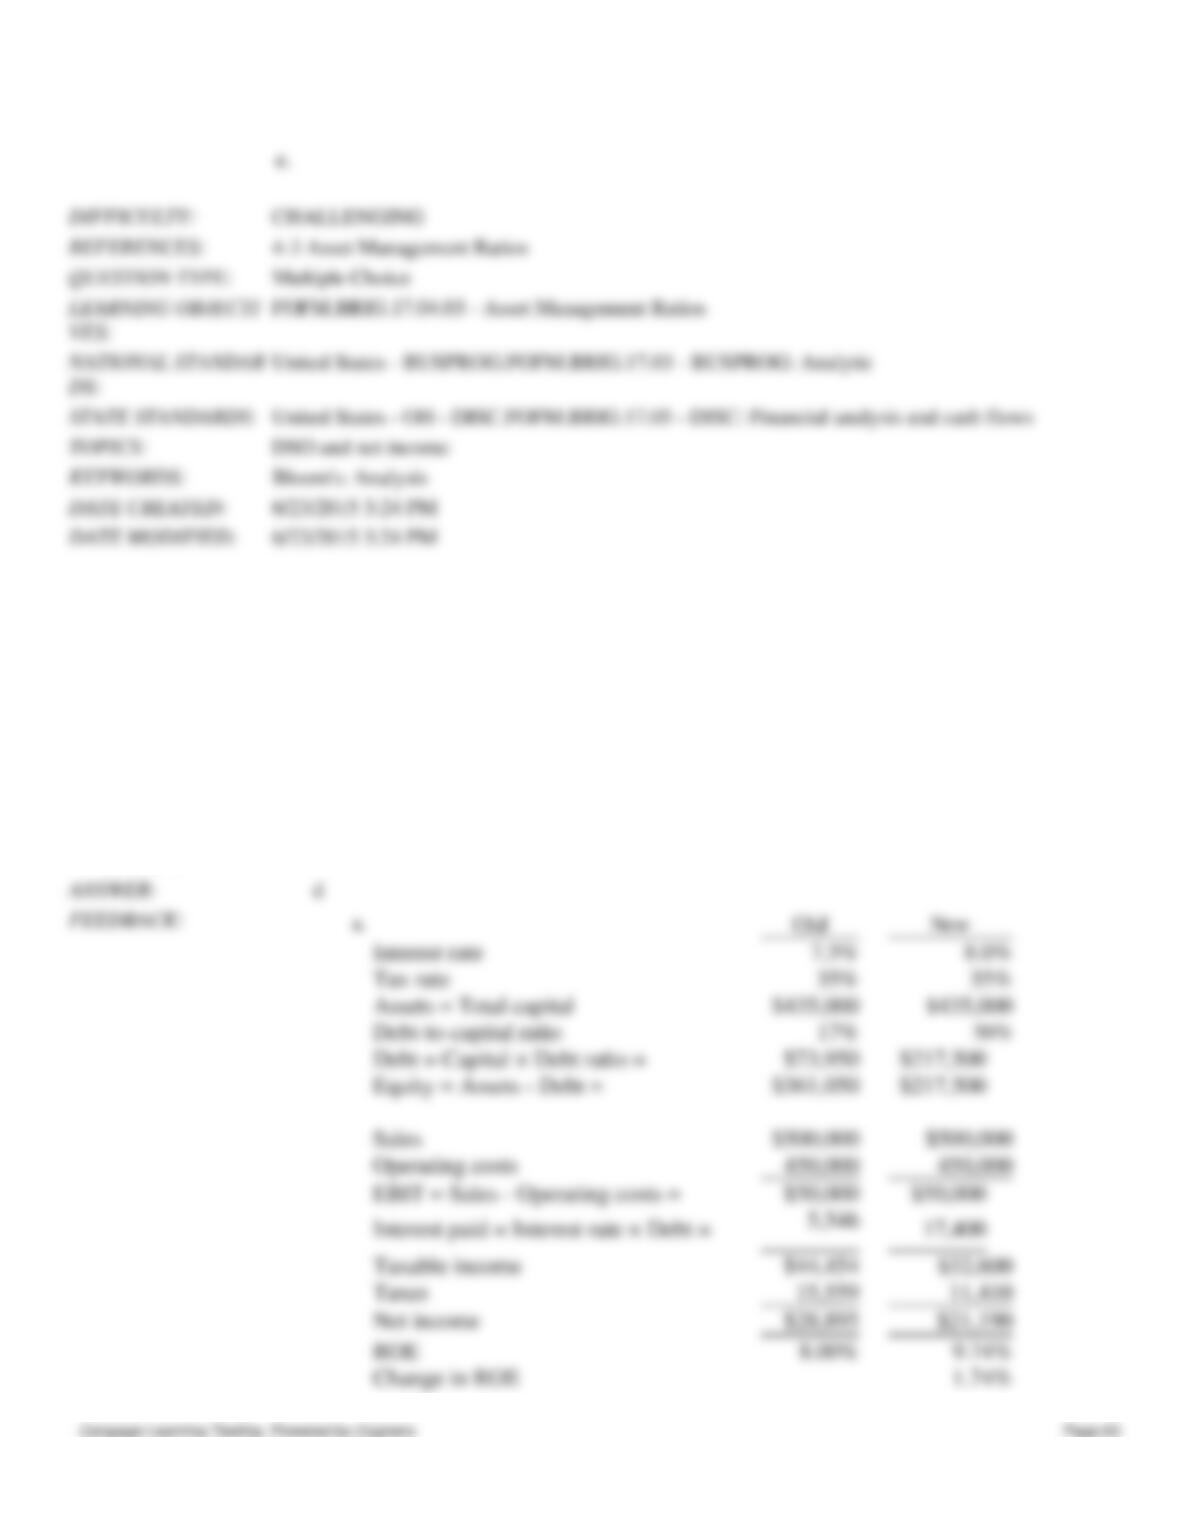
113. Last year Hamdi Corp. had sales of $500,000, operating costs of $450,000, and year-end assets (which is equal to its
total invested capital) of $435,000. The debt-to-total-capital ratio was 17%, the interest rate on the debt was 7.5%, and the
firm’s tax rate was 35%. The new CFO wants to see how the ROE would have been affected if the firm had used a 50%
debt-to-total-capital ratio. Assume that sales, operating costs, total assets, total invested capital, and the tax rate would not
be affected, but the interest rate would rise to 8.0%. By how much would the ROE change in response to the change in the
capital structure? Do not round your intermediate calculations.
a.
1.84%
b.
1.32%
c.
1.90%
d.
1.74%
e.
1.67%
Chapter 04: Analysis of Financial Statements
b.
c.
d.
e.
CHALLENGING
Comprehensive
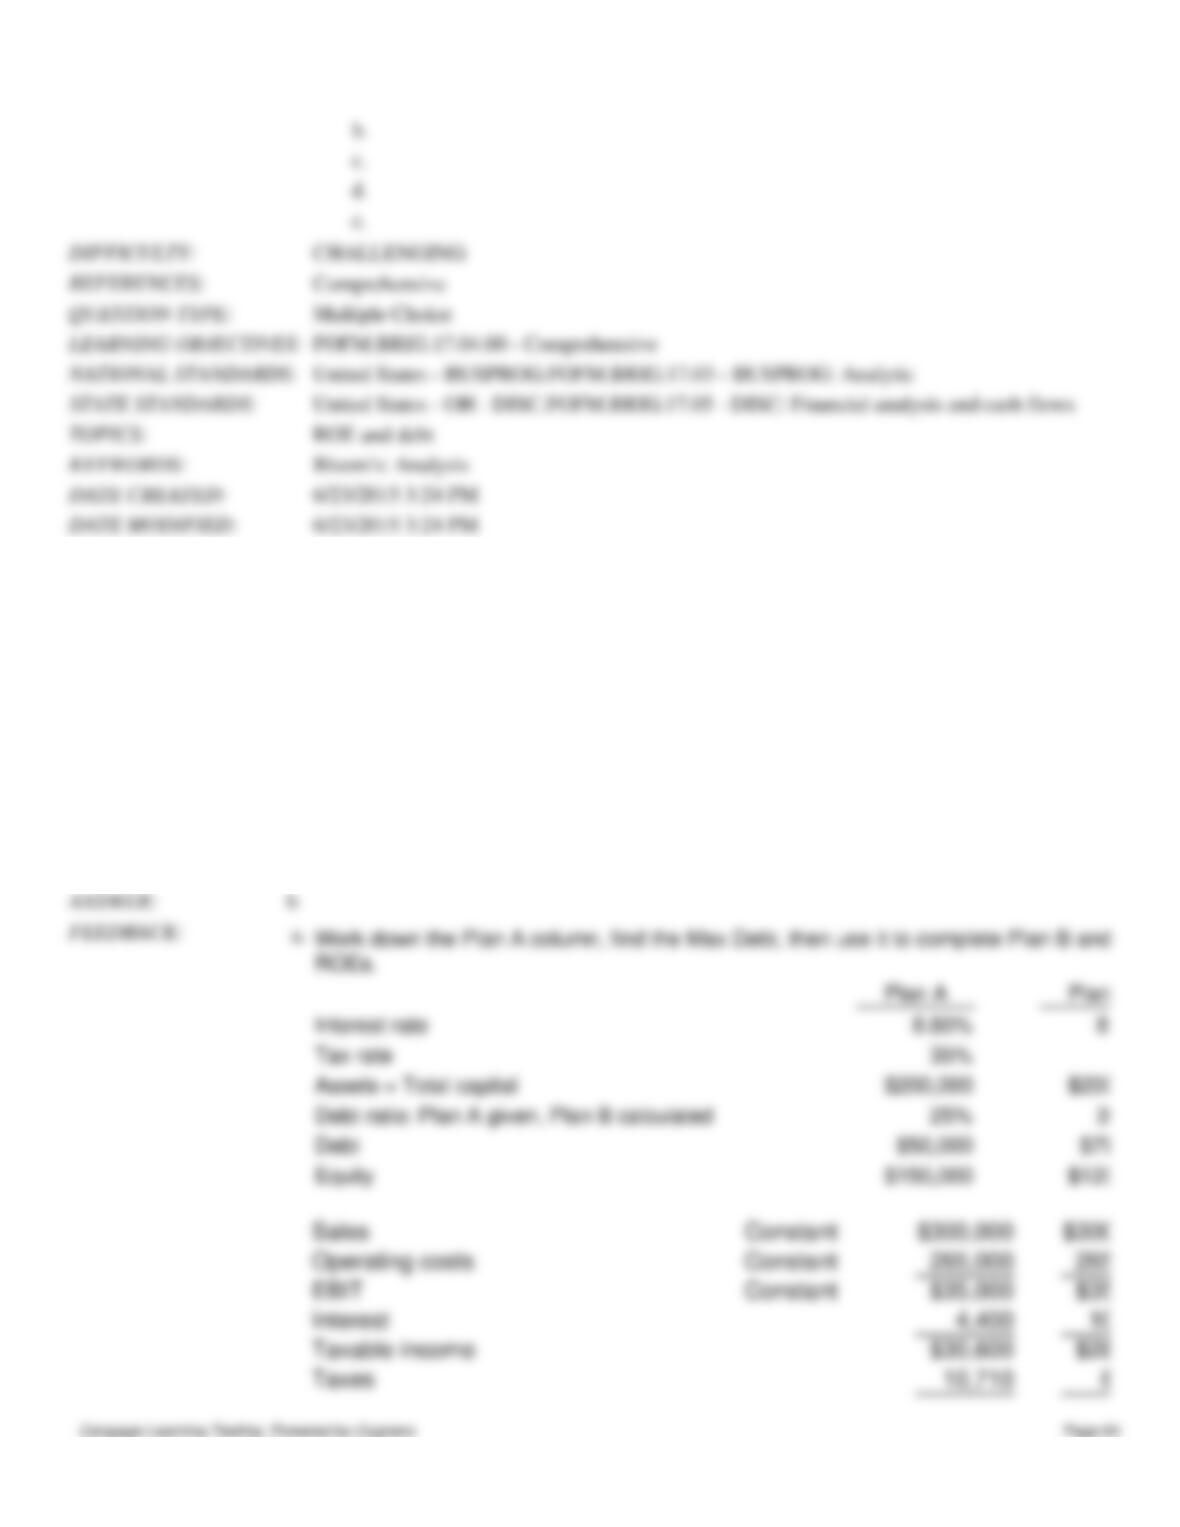
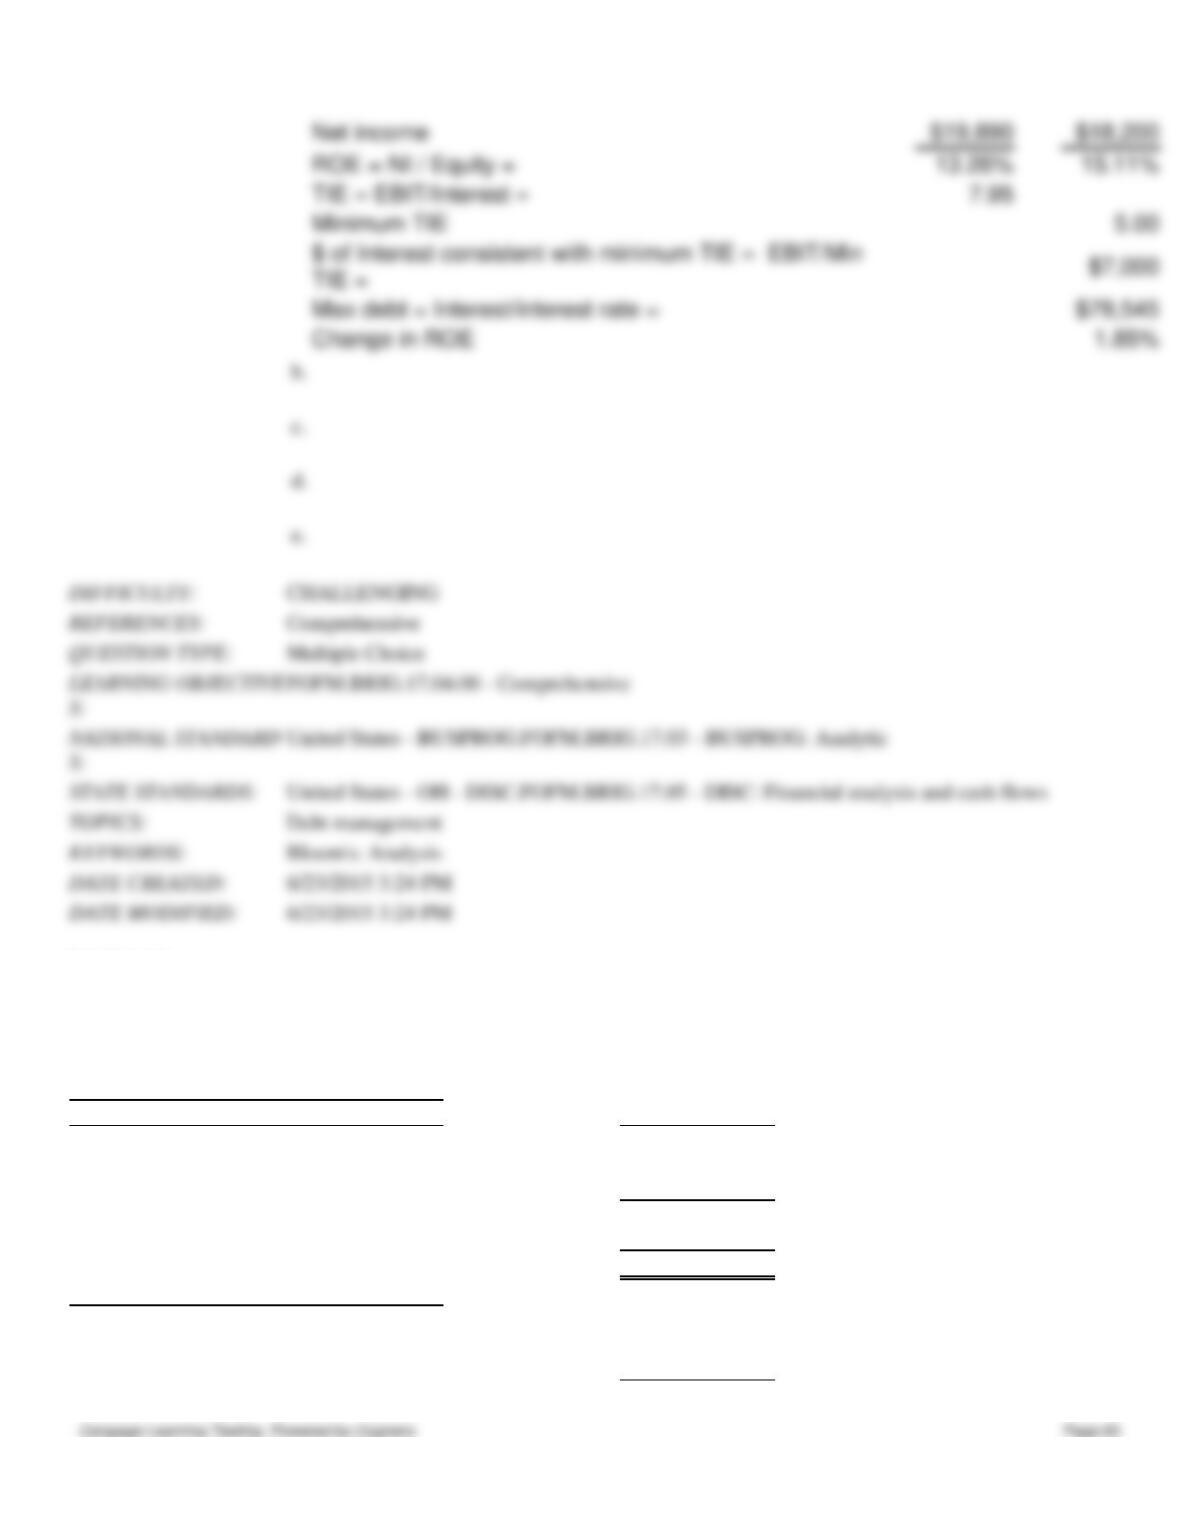
114. Quigley Inc. is considering two financial plans for the coming year. Management expects sales to be $300,000,
operating costs to be $265,000, assets (which is equal to its total invested capital) to be $200,000, and its tax rate to be
35%. Under Plan A it would finance the firm using 25% debt and 75% common equity. The interest rate on the debt
would be 8.8%, but under a contract with existing bondholders the TIE ratio would have to be maintained at or above 5.0.
Under Plan B, the maximum debt that met the TIE constraint would be employed. Assuming that sales, operating costs,
assets, total invested capital, the interest rate, and the tax rate would all remain constant, by how much would the ROE
change in response to the change in the capital structure? Do not round your intermediate calculations.
a.
2.31%
b.
1.85%
c.
1.68%
d.
1.52%
e.
2.03%
Chapter 04: Analysis of Financial Statements
Exhibit 4.1
The balance sheet and income statement shown below are for Koski Inc. Note that the firm has no amortization charges, it
does not lease any assets, none of its debt must be retired during the next 5 years, and the notes payable will be rolled
over.
Balance Sheet (Millions of $)
Assets
2016
Cash and securities
$2,145
Accounts receivable
8,970
Inventories
12,480
Total current assets
$23,595
Net plant and equipment
$15,405
Total assets
$39,000
Liabilities and Equity
Accounts payable
$7,410
Accruals
4,290
Notes payable
5,460
Total current liabilities
$17,160
CHALLENGING
Comprehensive
Multiple Choice
United States – OH – DISC.FOFM.BRIG.17.05 – DISC: Financial analysis and cash flows
Debt management
Bloom’s: Analysis
6/23/2015 3:24 PM
6/23/2015 3:24 PM
Chapter 04: Analysis of Financial Statements
Long-term bonds
$7,800
Total liabilities
$24,960
Common stock
$5,460
Retained earnings
8,580
Total common equity
$14,040
Total liabilities and equity
$39,000
Income Statement (Millions of $)
2016
Net sales
$58,500
Operating costs except depreciation
54,698
Depreciation
1,024
Earnings before interest and taxes (EBIT)
$2,779
Less interest
829
Earnings before taxes (EBT)
$1,950
Taxes
683
Net income
$1,268
Other data:
Shares outstanding (millions)
500.00
Common dividends (millions of $)
$443.63
Int rate on notes payable & L-T bonds
6.25%
Federal plus state income tax rate
35%
Year-end stock price
$30.42
115. Refer to Exhibit 4.1. What is the firm’s current ratio? Do not round your intermediate calculations.
a.
1.46
b.
1.65
c.
1.58
d.
1.38
e.
1.72
a.
Current ratio = Current assets/Current liabilities = 1.38
b.
c.
d.
e.
EASY
4-2 Liquidity Ratios
Multiple Choice
Balance sheet
FOFM.BRIG.17.04.02 – Liquidity Ratios
United States – BUSPROG.FOFM.BRIG.17.03 – BUSPROG: Analytic
United States – OH – DISC.FOFM.BRIG.17.05 – DISC: Financial analysis and cash flows
Bloom’s: Analysis
6/23/2015 3:24 PM
Chapter 04: Analysis of Financial Statements
116. Refer to Exhibit 4.1. What is the firm’s quick ratio? Do not round your intermediate calculations.
a.
0.58
b.
0.65
c.
0.56
d.
0.81
e.
0.73
a.
b.
c.
d.
e.
EASY
117. Refer to Exhibit 4.1. What is the firm’s days sales outstanding? Assume a 365-day year for this calculation. Do not
round your intermediate calculations.
a.
47.57
b.
68.84
c.
69.96
d.
50.93
e.
55.97
e
a.
b.
c.
d.
e.
MODERATE
Chapter 04: Analysis of Financial Statements
118. Refer to Exhibit 4.1. What is the firm’s total assets turnover? Do not round your intermediate calculations.
a.
1.77
b.
1.29
c.
1.50
d.
1.43
e.
1.19
c
a.
b.
c.
d.
e.
EASY
119. Refer to Exhibit 4.1. What is the firm’s inventory turnover ratio? Do not round your intermediate calculations.
a.
4.69
b.
5.30
c.
5.58
d.
5.77
e.
5.53
a
a.
b.
c.
d.
DSO
Chapter 04: Analysis of Financial Statements
e.
EASY
120. Refer to Exhibit 4.1. What is the firm’s TIE? Do not round your intermediate calculations.
a.
3.99
b.
3.19
c.
3.76
d.
3.35
e.
3.82
a.
b.
c.
d.
e.
EASY
121. Refer to Exhibit 4.1. What is the firm’s total debt to total capital ratio? Do not round your intermediate calculations.
a.
61.44%
b.
65.28%
c.
49.92%
d.
48.00%
e.
64.00%
Chapter 04: Analysis of Financial Statements
a.
b.
c.
d.
e.
EASY
122. Refer to Exhibit 4.1. What is the firm’s ROA? Do not round your intermediate calculations.
a.
3.25%
b.
2.80%
c.
3.38%
d.
4.03%
e.
3.97%
a
a.
b.
c.
d.
e.
EASY
123. Refer to Exhibit 4.1. What is the firm’s ROE? Do not round your intermediate calculations.
Chapter 04: Analysis of Financial Statements
a.
7.49%
b.
9.03%
c.
7.76%
d.
10.02%
e.
7.58%
a.
b.
c.
d.
e.
EASY
124. Refer to Exhibit 4.1. What is the firm’s BEP? Do not round your intermediate calculations.
a.
5.77%
b.
6.70%
c.
7.13%
d.
6.48%
e.
5.63%
c
a.
b.
c.
d.
e.
EASY
Chapter 04: Analysis of Financial Statements
125. Refer to Exhibit 4.1. What is the firm’s profit margin? Do not round your intermediate calculations.
a.
2.41%
b.
1.99%
c.
1.76%
d.
2.17%
e.
2.56%
a.
b.
c.
d.
e.
EASY
126. Refer to Exhibit 4.1. What is the firm’s return on invested capital?
a.
4.63%
b.
4.17%
c.
4.35%
d.
5.05%
e.
4.12%
a
a.
b.
c.
d.
e.
Chapter 04: Analysis of Financial Statements
127. Refer to Exhibit 4.1. What is the firm’s operating margin? Do not round your intermediate calculations.
a.
4.23%
b.
4.32%
c.
5.80%
d.
3.80%
e.
4.75%
e
a.
b.
c.
d.
e.
EASY
128. Refer to Exhibit 4.1. What is the firm’s dividends per share? Do not round your intermediate calculations.
a.
$0.99
b.
$0.89
c.
$0.98
d.
$0.91
e.
$0.78
a.
b.
c.
Chapter 04: Analysis of Financial Statements
129. Refer to Exhibit 4.1. What is the firm’s EPS? Do not round your intermediate calculations.
a.
$3.09
b.
$2.69
c.
$2.54
d.
$1.93
e.
$2.41
c
a.
b.
c.
d.
e.
EASY
130. Refer to Exhibit 4.1. What is the firm’s P/E ratio? Do not round your intermediate calculations.
a.
12.0
b.
12.6
c.
13.2
d.
13.9
d.
e.
EASY
DPS
Chapter 04: Analysis of Financial Statements
e.
14.6
a
b.
c.
d.
e.
EASY
131. Refer to Exhibit 4.1. What is the firm’s book value per share? Do not round your intermediate calculations.
a.
$24.43
b.
$28.64
c.
$32.85
d.
$28.08
e.
$27.24
a.
b.
c.
d.
e.
MODERATE
Chapter 04: Analysis of Financial Statements
132. Refer to Exhibit 4.1. What is the firm’s market-to-book ratio? Do not round your intermediate calculations.
a.
1.01
b.
1.35
c.
1.09
d.
1.18
e.
1.08
e
a.
b.
c.
d.
e.
EASY
133. Refer to Exhibit 4.1. What is the firm’s equity multiplier? Do not round your intermediate calculations.
a.
2.78
b.
2.08
c.
2.64
d.
3.03
e.
3.47
a
a.
b.
c.
d.
e.
MODERATE
Chapter 04: Analysis of Financial Statements