Page 1
1.
Trade takes the form of _____ when people directly exchange goods they have for
goods they want.
A)
exploitation
B)
benevolence
C)
barter
D)
a zero-sum game
2.
The simplest circular-flow model shows the interaction between households and firms.
In this model:
A)
only barter transactions take place.
B)
households and firms interact in the market for goods and services, but firms are
the only participants in the factor markets.
C)
firms supply goods and services to households, which in turn supply factors of
production to firms.
D)
attention is focused on real flows of goods, services, and factors of production, but
money flows between households and firms are ignored for simplicity.
3.
A high-school graduate who gets a college degree is adding to the economy’s stock of:
A)
labor.
B)
capital.
C)
human capital.
D)
financial capital.
Use the following to answer questions 4-7:
\\
Page 2
4.
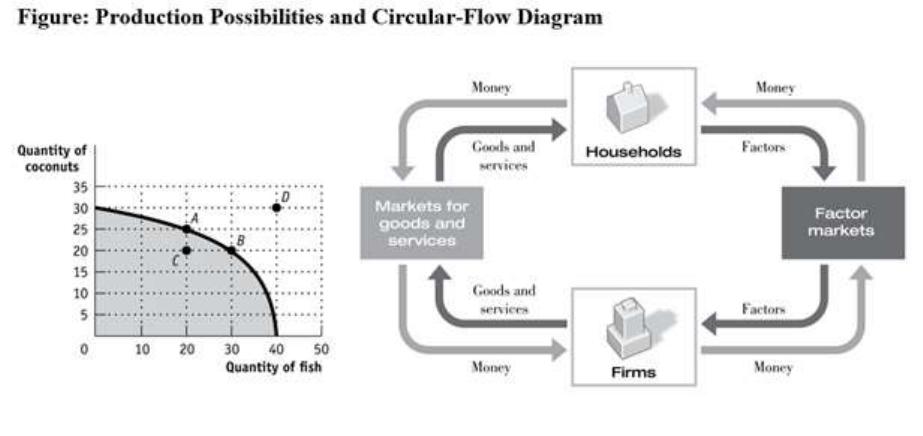
(Ref 4-1 Figure: Production Possibilities and Circular-Flow Diagram) Use Figure:
Production Possibilities and Circular-Flow Diagram. Assume the two figures represent
the same economy. Suppose that in the circular-flow diagram there is a significant
decrease in the amount of labor flowing to the firms that produce coconuts. If all other
variables remain unchanged, this adjustment in the economy would be best represented
in the production possibilities figure by a move from point A toward:
A)
point A (no movement).
B)
point B (a decrease in coconut production and an increase in fish production).
C)
point C (a decrease in coconut production).
D)
point D (an outward shift of the entire curve).
5.
(Ref 4-1 Figure: Production Possibilities and Circular-Flow Diagram) Use Figure:
Production Possibilities and Circular-Flow Diagram. Assume the two figures represent
the same economy. Suppose that in the circular-flow diagram capital that used to flow to
firms producing coconuts now flows to firms producing fish. This adjustment in the
economy would be best represented in the production possibilities figure by a move
from point A toward:
A)
point A (no movement).
B)
point B (a decrease in coconut production and an increase in fish production).
C)
point C (a decrease in coconut production).
D)
point D (an outward shift of the entire curve).
6.
(Ref 4-1 Figure: Production Possibilities and Circular-Flow Diagram) Use Figure:
Production Possibilities and Circular-Flow Diagram. Assume the two figures represent
the same economy. Suppose that in the circular-flow diagram there is a significant
increase in the amount of human capital flowing to both coconut producers and fish
producers. If all other variables remain unchanged, then the adjustment in this economy
would be BEST represented in the production possibilities figure by a movement from
point A toward:
A)
point A (no movement).
B)
point B (a decrease in coconut production and an increase in fish production).
C)
point C (a decrease in coconut production).
D)
point D (an outward shift of the entire curve).
Page 3
7.
(Ref 4-1 Figure: Production Possibilities and Circular-Flow Diagram) Use Figure:
Production Possibilities and Circular-Flow Diagram. Assume the two figures represent
the same economy. Suppose that in the circular-flow diagram most firms undergo a
significant increase in productivity. This results in a significant increase in the output of
both coconuts and fish. If all other variables remain unchanged, then the adjustment in
this economy would be BEST represented in the production possibilities figure by a
movement from point A toward:
A)
point A (no movement).
B)
point B (a decrease in coconut production and an increase in fish production).
C)
point C (a decrease in coconut production).
D)
point D (an outward shift of the entire curve).
8.
If LeRoyce trades two cookies for one of Amir’s brownies, we say that they are
engaging in:
A)
exploitation.
B)
benevolence.
C)
barter.
D)
a zero-sum game.
9.
Which statement is false about the circular-flow diagram?
A)
Households are the primary demanders of goods and services.
B)
Firms are the primary suppliers of goods and services.
C)
Money flows from households to firms as households offer factors of production
for sale.
D)
Money flows in the direction opposite to goods and services and factors of
production.
10.
Which item is not a factor of production?
A)
labor
B)
machines and buildings
C)
land
D)
money
11.
The circular-flow diagram illustrates how households _____ goods and services and
_____ factors of production.
A)
buy; sell
B)
buy; buy
C)
own; buy
D)
own; sell
Page 4
12.
The circular-flow diagram illustrates how firms _____ goods and services and _____
factors of production.
A)
buy; sell
B)
buy; buy
C)
sell; buy
D)
sell; sell
13.
In the simplest circular-flow model, households supply _____ and demand _____.
A)
capital; barter
B)
wages and income; capital markets
C)
factors of production; goods and services
D)
firms; markets
14.
The circular-flow diagram represents the market for _____ and the market for _____.
A)
goods and services; factors of production
B)
households; firms
C)
money; goods and services
D)
factors of production; money
15.
The circular-flow diagram shows the flow of _____, the flow of _____, and the flow
of_______.
A)
goods and services; factors of production; and markets
B)
households; firms; money
C)
money; goods and services; factors of production.
D)
factors of production; money; households.
16.
The circular-flow diagram shows how:
A)
banks receive deposits and create money.
B)
money, goods and services, and factors of production flow through the economy.
C)
the various levels of government allocate tax revenues to meet the needs of society.
D)
the work force is educated and trained to increase labor productivity.
17.
The basis of the circular-flow diagram is that:
A)
the best models avoid making assumptions.
B)
goods and services flow in a circle in the factor market.
C)
resources are sold along with goods and services in the resource market.
D)
the flow of money into each market or sector is equal to the flow of money coming
out of that market or sector.
Page 5
18.
In the circular-flow diagram, the flow of money going into each sector or market is
_____ the flow of money coming out of that market or sector.
A)
equal to
B)
greater than
C)
less than
D)
unrelated to
19.
In the circular-flow diagram, an individual or a group of people (usually a family) who
share their income is a(n):
A)
market.
B)
factor.
C)
household.
D)
business.
20.
In the circular-flow diagram, a household is a(n):
A)
entity that sells goods and services.
B)
individual or group of people who share their income.
C)
entity that purchases factors of production.
D)
member of a group that is prohibited from buying imported goods and services.
21.
In the circular-flow diagram, an organization that produces goods or services for sale is
a:
A)
market.
B)
household.
C)
factor.
D)
firm.
22.
In the circular-flow diagram, a firm is an:
A)
organization that produces goods or services for sale.
B)
individual or a group of people who share their income.
C)
organization that sells factors of production.
D)
organization that purchases goods and services.
23.
In the circular-flow diagram, the product market is where:
A)
firms buy goods and services.
B)
firms buy resources used to produce goods and services.
C)
households buy goods and services.
D)
households buy resources used to produce goods and services.
Page 6
24.
Households buy goods and services in the _____ markets.
A)
factor
B)
product
C)
resource
D)
financial
25.
In the circular-flow diagram, the factor market is where:
A)
households buy factors of production.
B)
households buy goods and services.
C)
businesses buy goods and services.
D)
businesses buy factors of production.
26.
Businesses buy resources used to produce goods and services in the:
A)
factor market.
B)
product market.
C)
market for goods and services.
D)
foreign exchange market.
27.
Jim is being paid $7.25 an hour to work at a restaurant. In the circular flow, this is an
example of a:
A)
business selling goods and services in the product market.
B)
household buying goods and services in the product market.
C)
household buying goods and services in the factor market.
D)
household selling a resource in the factor market.
28.
Jim is being paid $7.25 an hour to work at a restaurant. In the circular flow, this is an
example of a:
A)
business selling goods and services in the product market.
B)
household buying goods and services in the product market.
C)
business buying a resource in the factor market.
D)
household buying a resource in the factor market.
29.
Mary spends $5 on food for her cat. This is an example of a:
A)
business buying goods and services in the product market.
B)
household buying goods and services in the product market.
C)
household buying goods and services in the factor market.
D)
household selling a resource in the factor market.
Page 7
30.
Which of the following is sold in the factor market?
A)
hamburgers
B)
video games
C)
haircuts
D)
labor
31.
Which of the following is sold in the factor market?
A)
hot dogs
B)
bulldozers
C)
nail polish
D)
appendectomies
32.
Which of the following is sold in the product market?
A)
land
B)
labor
C)
cell phones
D)
human capital
33.
Which of the following is sold in the product market?
A)
footballs
B)
labor
C)
physical capital
D)
human capital
34.
In the circular-flow diagram, households buy _____ in the _____ market.
A)
goods and services; product
B)
goods and services; factor
C)
resources; factor
D)
resources; product
35.
In the circular-flow diagram, households receive money for _____ in the _____ market.
A)
producing and selling goods and services; product
B)
selling resources; product
C)
selling resources; factor
D)
selling goods and services; factor
Page 8
36.
In the circular-flow diagram, firms buy _____ in the _____ market.
A)
goods and services; product
B)
goods and services; factor
C)
resources; product
D)
resources; factor
37.
In the circular-flow diagram, firms receive money for _____ in the _____ market.
A)
selling goods and services; product
B)
selling resources; product
C)
selling resources; factor
D)
selling goods and services; factor
38.
Which statement is positive? Which statement is normative?
I. The federal minimum wage in 2016 was $7.25 an hour.
II. The minimum wage should be high enough that families will not live in poverty.
A)
I is positive; II is normative.
B)
I is positive; II is positive.
C)
I is normative; II is positive.
D)
I is normative; II is normative.
39.
Which statement is normative?
A)
Women’s labor force participation rate has increased during the past 100 years.
B)
The federal minimum wage is higher today than it was in 1990.
C)
Children in the United States are required to go to school until they reach a certain
age.
D)
The best way to encourage growth in the economy is through government
spending.
40.
Which statement is normative?
A)
The minimum wage has not kept pace with inflation.
B)
The minimum wage is an important tool in fighting poverty and should be
increased.
C)
The minimum wage can cause higher unemployment for teens and unskilled
workers.
D)
A higher minimum wage is expected to increase the price of a fast-food
cheeseburger.
Page 9
41.
Which statement is normative?
A)
International trade leads to expanded consumption opportunities.
B)
Higher expenditures on health care will reduce infant mortality rates.
C)
To improve our economic security, we should reduce our dependence on oil
imports.
D)
Increased defense spending will lead to higher budget deficits.
42.
Which statement is a positive economic statement?
A)
Government has grown too large and should be reduced.
B)
There has been an increase in the rate of inflation.
C)
Government should be subject to the same rules as all other institutions.
D)
Women should be paid as much as men are for the same work.
43.
Which statement is positive?
A)
The rate of unemployment is 4%.
B)
A high rate of economic growth is the most important economic goal for the
country.
C)
Everyone in the country should be covered by national health insurance.
D)
Baseball players should not be paid higher salaries than is the president of the
United States.
44.
Which statement is positive?
A)
The rate of unemployment should be 4%.
B)
A high rate of economic growth should be a more important economic goal than a
low rate of inflation.
C)
The federal government spends half of its budget on national defense.
D)
Everyone in the country should be covered by national health insurance.
45.
“Unemployment of 5% is too high” is:
A)
a normative statement.
B)
a positive statement.
C)
the circular-flow model.
D)
an example of comparative advantage.
46.
Which statement is normative?
A)
Government has grown too large and should be reduced.
B)
The rate of inflation has increased.
C)
Government is subject to the same rules as all other institutions.
D)
The money supply grew by 3% last year.
Page 10
47.
Which statement is positive?
A)
The poverty rate is 14%.
B)
A high rate of inflation is the most important economic goal for the country.
C)
Everyone in the country should save money for retirement.
D)
Basketball players should not be paid higher salaries than are teachers.
48.
Which statement is positive?
A)
The poverty rate should be 4%.
B)
A high rate of economic growth should be a more important goal for the country
than should a low rate of unemployment.
C)
The federal government pays for 46% of U.S. health care costs.
D)
Everyone in the country should be covered by national health insurance.
49.
Statements that make value judgments are:
A)
pecuniary.
B)
positive.
C)
nominal.
D)
normative.
50.
Which statement is normative?
A)
The rate of unemployment is 9%.
B)
The price of gasoline should be less than $4 per gallon.
C)
The federal government spends half of its budget on national defense.
D)
Millions of Americans lack health insurance.
51.
Which statement is normative?
A)
The rate of unemployment is 9%.
B)
A high rate of economic growth creates jobs.
C)
The federal government spends half of its budget on national defense.
D)
Everyone in the United States deserves to be covered by national health insurance.
52.
“The current unemployment rate of 9% is too high” is a _____ statement.
A)
normative
B)
ceteris paribus
C)
positive
D)
marginal
Page 11
53.
“The rate of unemployment is 9%.” This statement:
A)
is positive.
B)
is normative.
C)
involves a value judgment.
D)
is a personal reflection and has no value in economics.
54.
Unemployment decreased to its lowest level in 10 years last month. This statement is
a(n):
A)
example of an opportunity cost.
B)
positive economic statement.
C)
normative economic statement.
D)
value judgment.
55.
A statement that the minimum wage should be increased is a:
A)
positive statement.
B)
normative statement.
C)
ceteris paribus assumption.
D)
scientific conclusion based on marginal analysis.
56.
A normative statement deals with:
A)
the facts.
B)
what was, is, or will be.
C)
what ought to be.
D)
the scientific method.
57.
The statement “The Bureau of Labor Statistics of the U.S. government is a major
employer of economists” is a
A)
positive statement.
B)
normative statement.
C)
ceteris paribus assumption.
D)
scientific conclusion based on marginal analysis.
58.
A firm is an organization that produces goods and/or services.
A)
True
B)
False
59.
Fertilizer, used to grow pumpkins, is a factor of production.
A)
True
B)
False
Page 12
60.
Labor and capital are the only two factors of production.
A)
True
B)
False
61.
The basis of the circular-flow diagram is that the money flowing into each sector or
market is greater than the money that flows out.
A)
True
B)
False
62.
The basis of the circular-flow diagram is that the money flowing into each sector or
market is equal to the money that flows out.
A)
True
B)
False
63.
In the product market, households buy goods and services.
A)
True
B)
False
64.
In the factor market, households buy goods and services.
A)
True
B)
False
65.
In the factor market, firms buy goods and services.
A)
True
B)
False
66.
In the factor market, firms buy resources.
A)
True
B)
False
67.
If Mary accepts a job as a nurse, she has sold a factor of production in the factor market.
A)
True
B)
False
Page 13
68.
If Jim buys a lunch at a restaurant, he has bought a factor of production in the factor
market.
A)
True
B)
False
69.
An apple is a resource sold in the factor market.
A)
True
B)
False
70.
“Teachers in northern New Hampshire should earn more money” is a normative
statement.
A)
True
B)
False
71.
Positive economics is the branch of economics that makes prescriptions about the way
the economy should work.
A)
True
B)
False
72.
“Steel tariffs will prevent job losses in the steel industry” is a positive statement.
A)
True
B)
False
73.
“The unemployment rate should be higher” is a normative statement.
A)
True
B)
False
74.
“Many economists agree that income taxes should be increased for rich people” is a
positive statement.
A)
True
B)
False
75.
Economists disagree more over normative economics than positive economics.
A)
True
B)
False
Page 14
76.
You are reading an editorial in your local newspaper. The editorial says: “The United
States had a trade deficit of $18.4 billion in February 2008. This is a clear indication to
our leaders that we must renegotiate our trade agreements with China to make them
fairer for the American worker.” What part of this editorial is positive and what part is
normative?
77.
Positive economics:
A)
describes opinions and perspectives on how the world should work.
B)
is based on opinion polls.
C)
describes how the world does work.
D)
is the same as normative economics.
78.
Which statement(s) reflect(s) a normative view?
I. The United States should increase the minimum wage to $10 per hour.
II. There is a federal minimum wage in the United States.
III. The federal minimum wage in the United States is less than $10 per hour.
A)
I, II, and III
B)
None is normative.
C)
I and II
D)
I


Page 16