15) A business cycle is the pattern of short-run upward and downward movements in production
and jobs.
16) Phases and turning points of the business cycle are expansion, peak, recession and trough.
17) The business cycle progresses from an expansion to a peak to a recession and then to a
trough.
18) A recession occurs when real GDP decreases for at least 6 months.
19) An expansion ends when the economy hits a trough and then enters a recession.
20) To measure economic welfare, one needs only to measure real GDP.
21) The omission of household production causes actual economic production to be
underestimated.
22) Household production is not measured in the GDP.
23) All economic activity in the underground economy represents the production of illegal goods
and services.
24) The underground economy means that GDP will overstate the actual level of economic
welfare.
25) If a measure of real GDP could include the value of leisure time, measured real GDP would
increase.
26) The fact that prices for similar goods differ across nations complicates comparisons of real
GDP across countries.
100
8 Extended Problems
Item
Amount
(millions of dollars)
Wages paid
100
Consumption expenditure
120
Taxes
40
Transfer payments
15
Profits
35
Investment
30
Government expenditure
50
Exports
30
Imports
40
1) The table above shows the transaction in Pinkland last year:
a) Calculate Pinkland’s GDP.
Year
Real GDP
(trillions of yen)
1991
478
1992
483
1993
484
1994
489
1995
499
1996
516
1997
525
1998
519
1999
520
2000
534
2001
536
2) The table above shows Japan’s real GDP between 1991 to 2001.
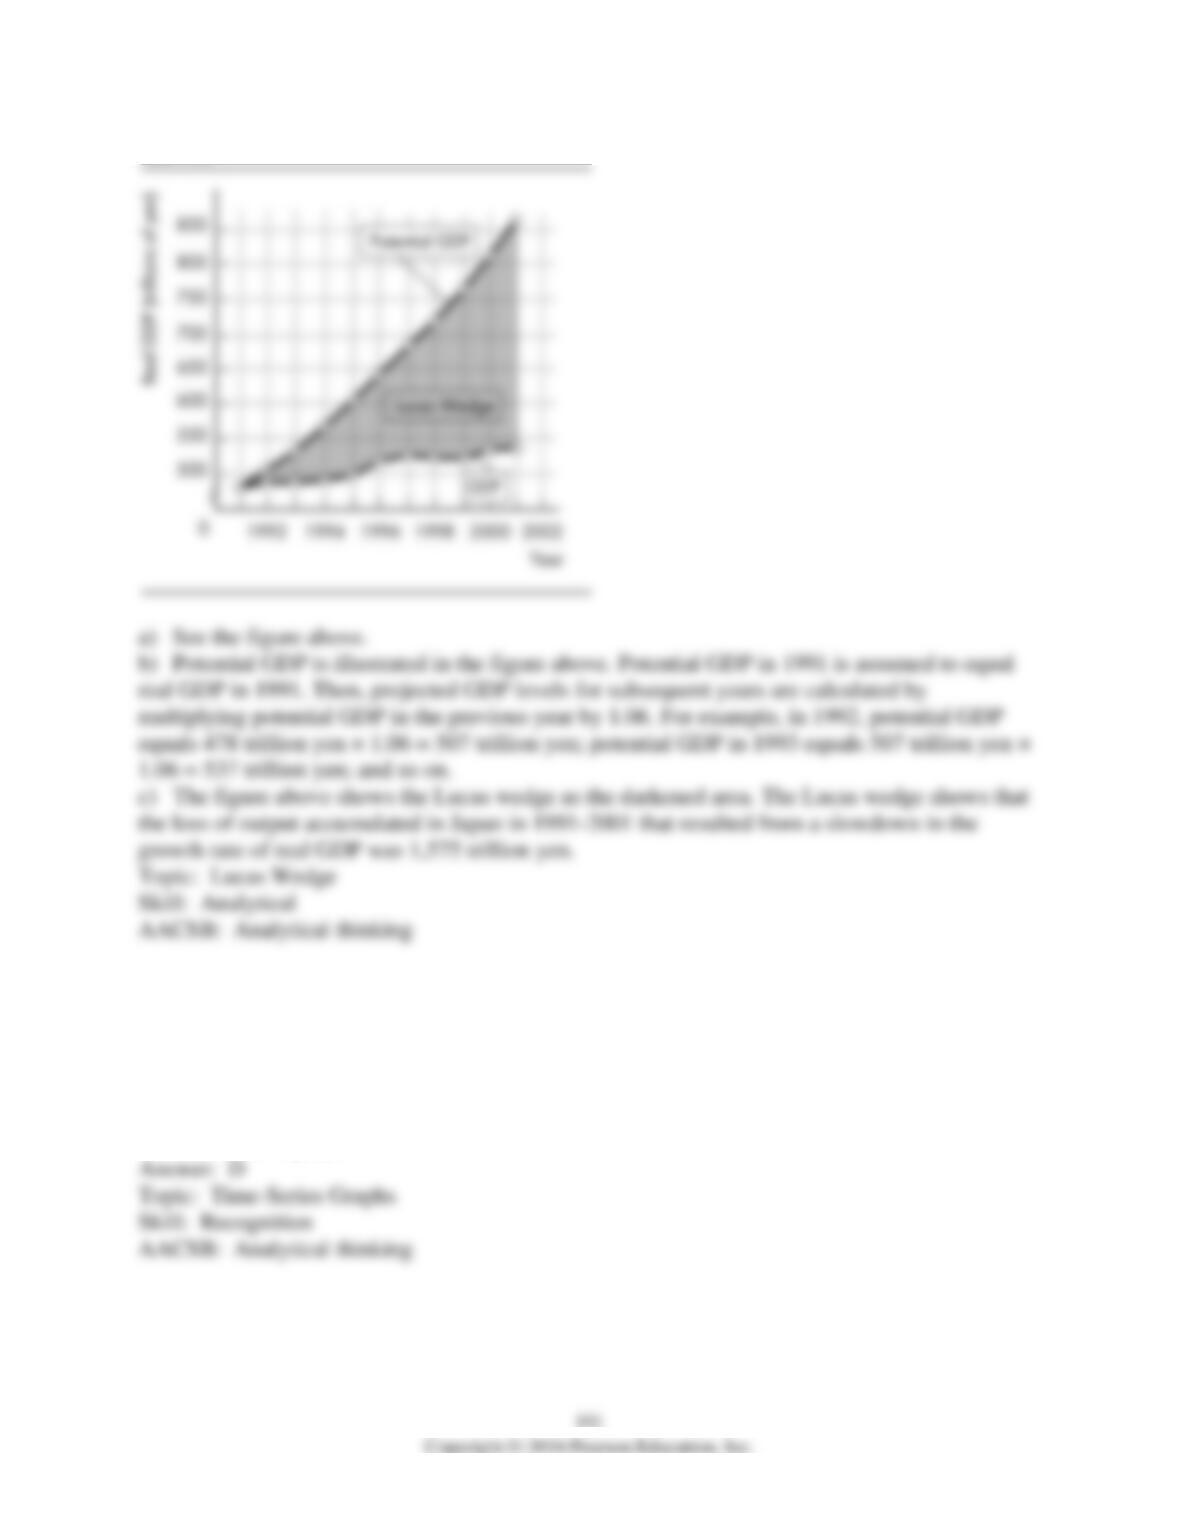
a) Draw a figure with Japan’s real GDP from 1991 to 2001.
b) In the previous 30 years, the growth rate of Japan’s potential GDP was 6 percent a year. On
your graph, show the path that potential GDP would have followed if its GDP in 1991 was equal
to potential GDP and the growth rate of potential GDP had been maintained in 1991-2001.
c) Show the Lucas wedge on your figure.
Answer:
9 Appendix: Graphs in Macroeconomics
1) To see how variables evolve over time we use
A) a scatter graph.
B) an evolution plot.
C) a cross-section plot.
D) a time-series graph.
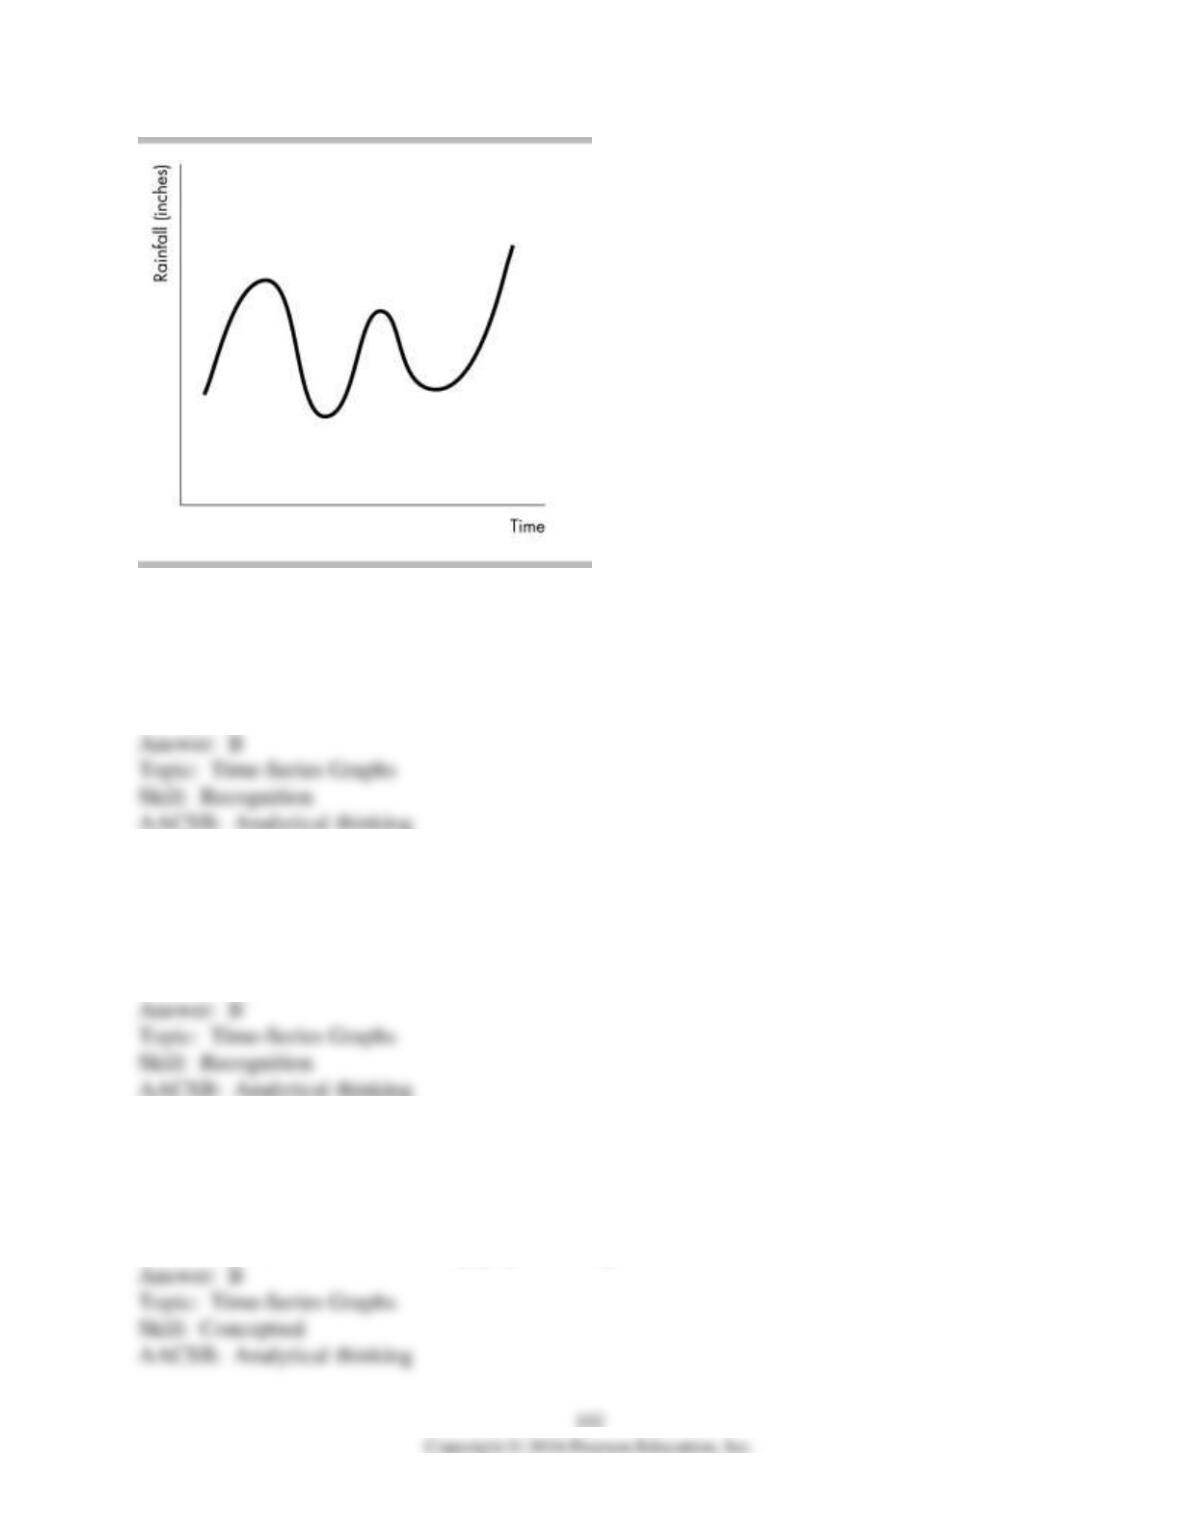
2) The figure above shows a
A) two-variable time-series graph.
B) time-series graph.
C) scatter diagram.
D) regression.
3) On a time-series graph, time is typically shown
A) as an area.
B) along the x-axis.
C) along the y-axis.
D) as an implicit variable held constant.
4) The horizontal axis on a time-series graph
A) measures the variable being graphed.
B) measures units of time such as years.
C) runs parallel to the y-axis.
D) measures how the variable being graphed changes.
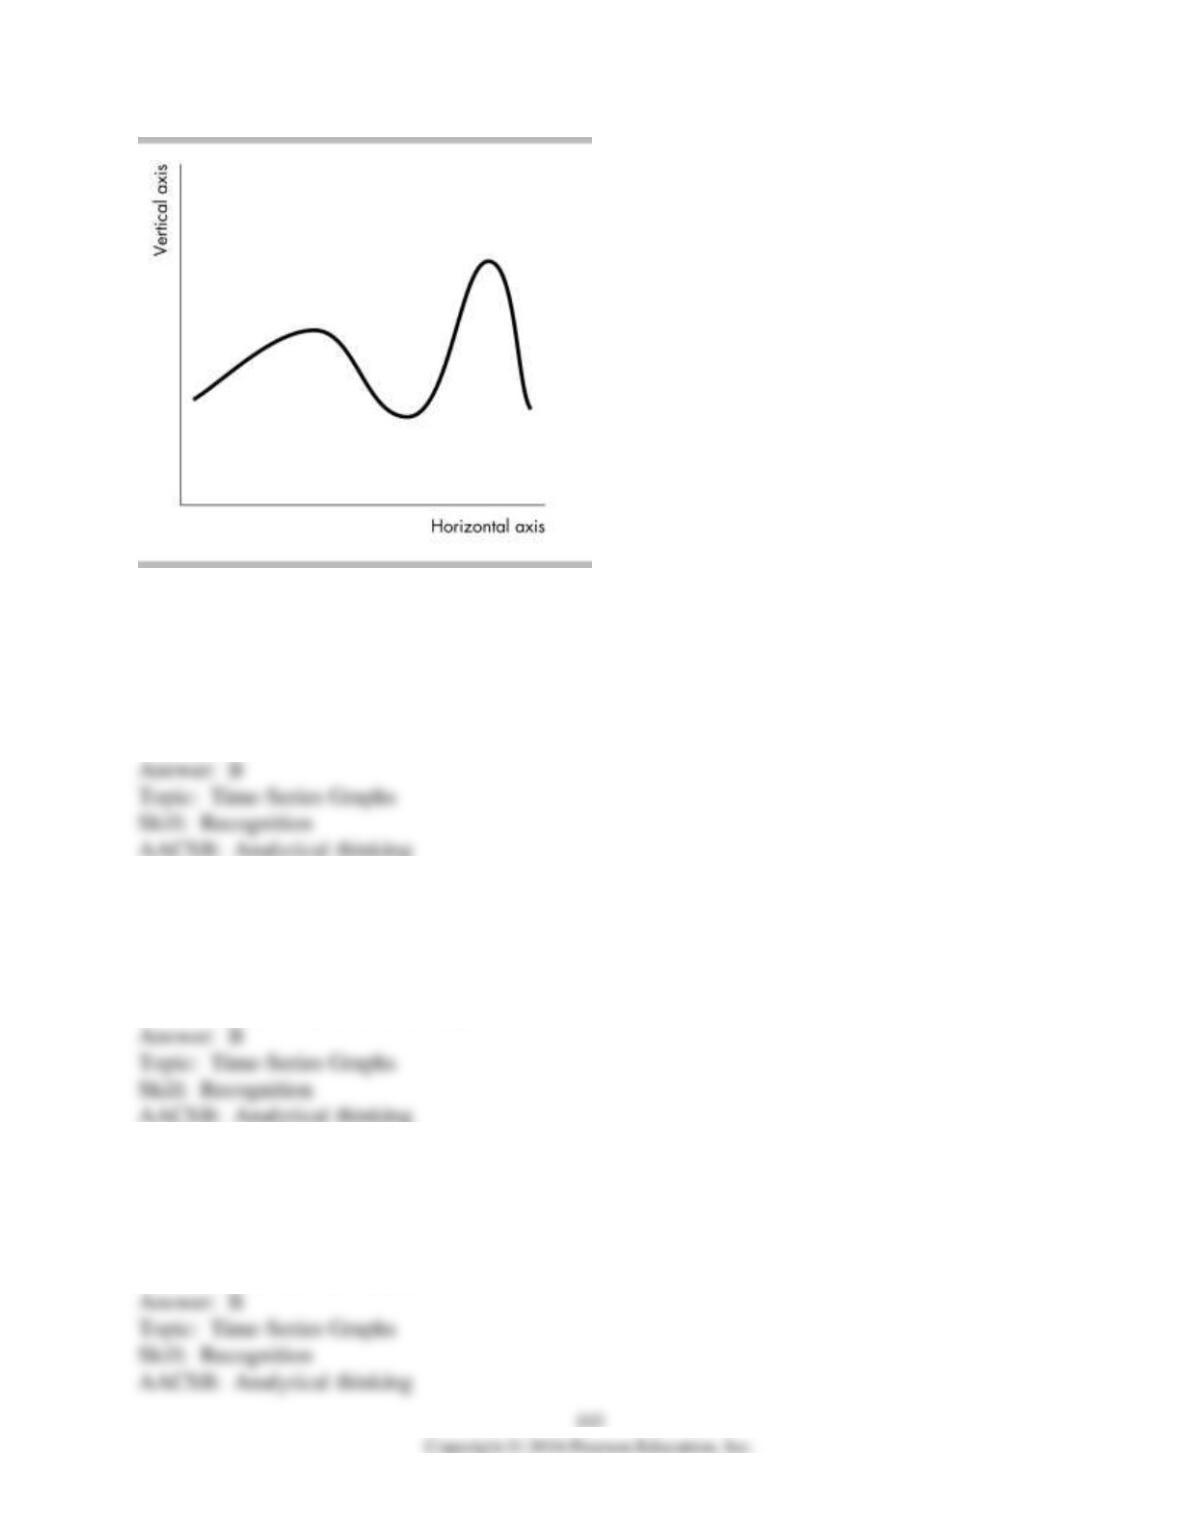
5) The figure above shows a time-series graph. The horizontal axis measures ________ and the
vertical axis measures ________.
A) time; x-values
B) time; the variable of interest
C) the variable of interest; time
D) y-values; the variable of interest
6) A trend is
A) a measure of closeness on a scatter diagram.
B) a general tendency for a variable to rise or fall.
C) the maximum value of a variable.
D) the minimum value of a variable.
7) A trend shows
A) the degree of correlation between two variables.
B) the general tendency for a variable to rise or fall.
C) the scale used to measure to variables.
D) the increases in one variable.
8) Trend refers to
A) the scale used on the x– and y-coordinates.
B) increases but not decreases of a variable.
C) decreases but not increases of a variable.
D) a general tendency for a variable to rise or fall.
9) Which of the following is TRUE regarding a trend?
I. A cross section graph shows trends.
II. A time-series graph shows trends.
III. A scatter plot shows trends over time.
A) I
B) II
C) I and II
D) II and III
10) Which type of graph is used to identify trends?
A) time-series
B) scatter diagram
C) cross-section
D) None of the above answers is correct.
11) Which of the following is CORRECT about a time-series graph?
I. The x-axis measures time.
II. A time-series graph can reveal if there is a trend in the variable.
A) only I
B) only II
C) both I and II
D) neither I nor II
12) A time-series graph reveals whether there is a ________ which represents ________.
A) trend in a variable; a general tendency for the variable to rise or fall
B) relationship between two variables; a cross-section graph
C) trend in a variable; unrelated variables
D) relationship between two variables; a trend in a variable
13) A time-series graph showing total production in Japan from 1960 to 2010 shows a positive
trend. It is the case that total production
A) fell every year between 1960 and 2010.
B) rose every year between 1960 and 2010.
C) was lower in 2010 than in 1960.
D) was higher in 2010 than in 1960.
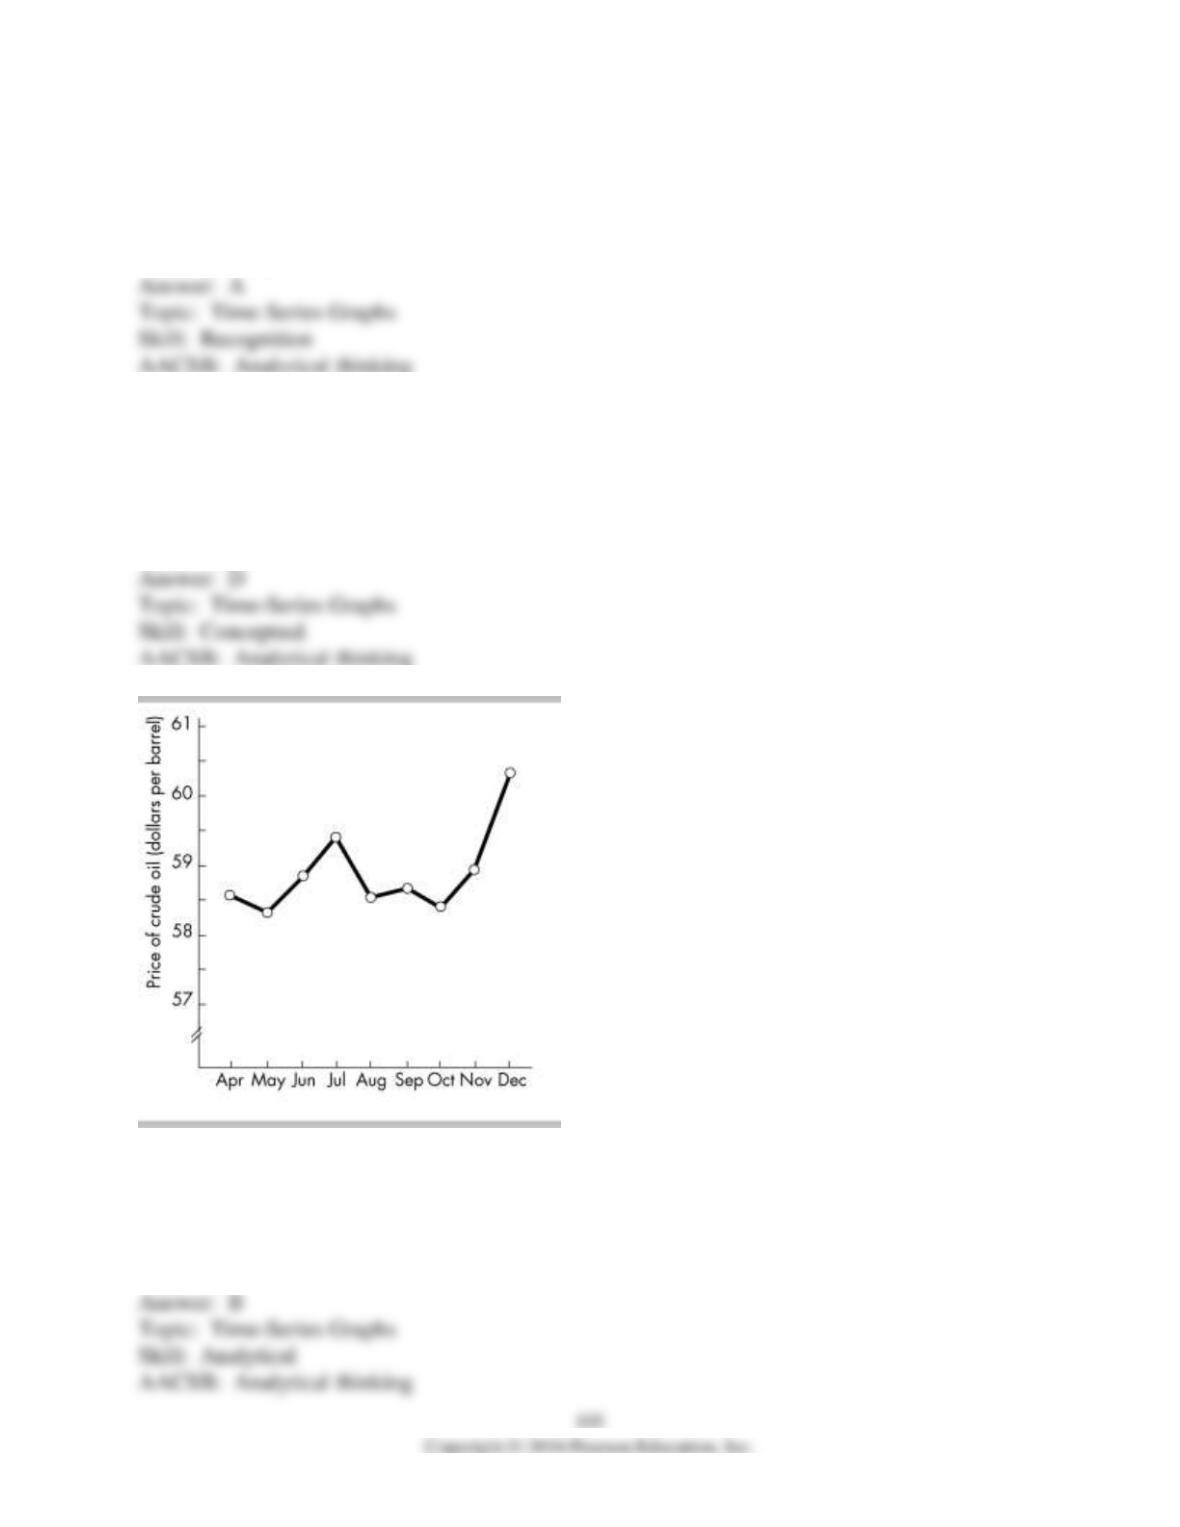
14) Using the above figure, during which month was the price for crude oil the highest?
A) July
B) December
C) May
D) October
106
15) Using the above figure, during which of the following periods does the price of crude oil
have a downward trend?
A) May to July
B) May to November
C) July to October
D) October to December
16) Using the above figure, during which of the following periods does the price of crude oil
shows an upward trend?
A) May to November
B) May to July and October to December
C) July to October
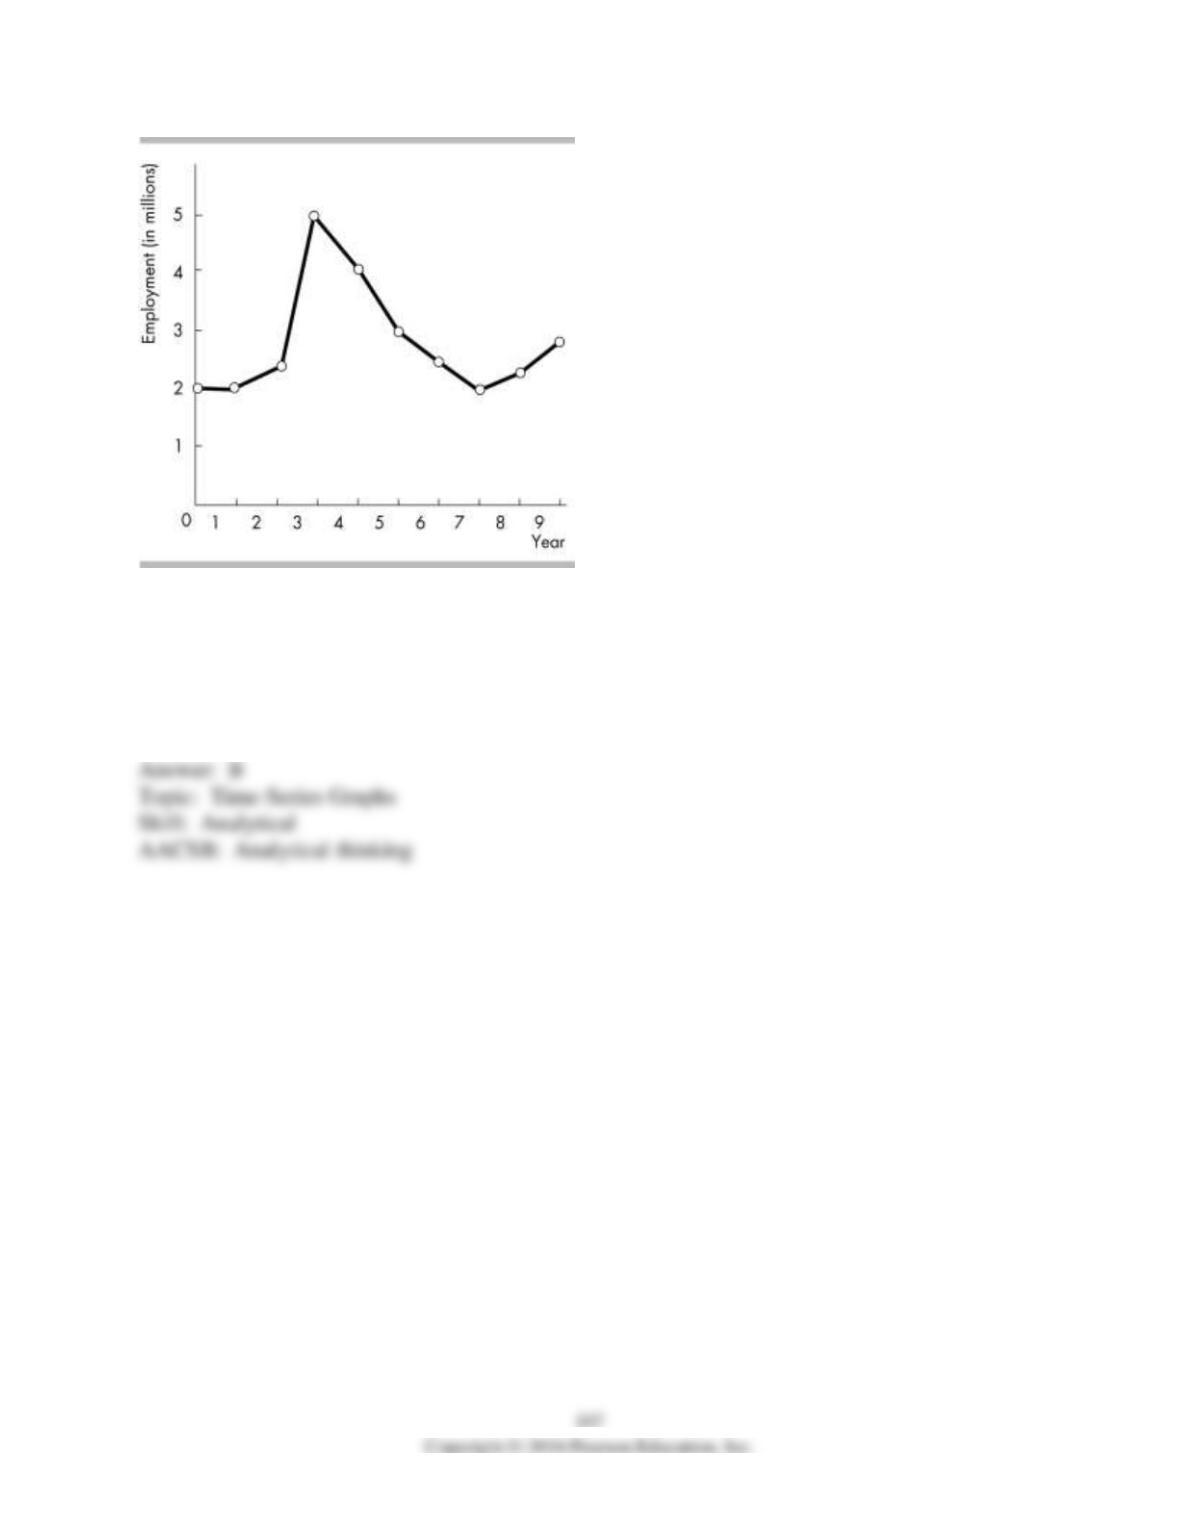
17) According to the graph in the figure above, which year experienced the most rapid change in
employment?
A) Year 2
B) Year 3
C) Year 4
D) Year 5
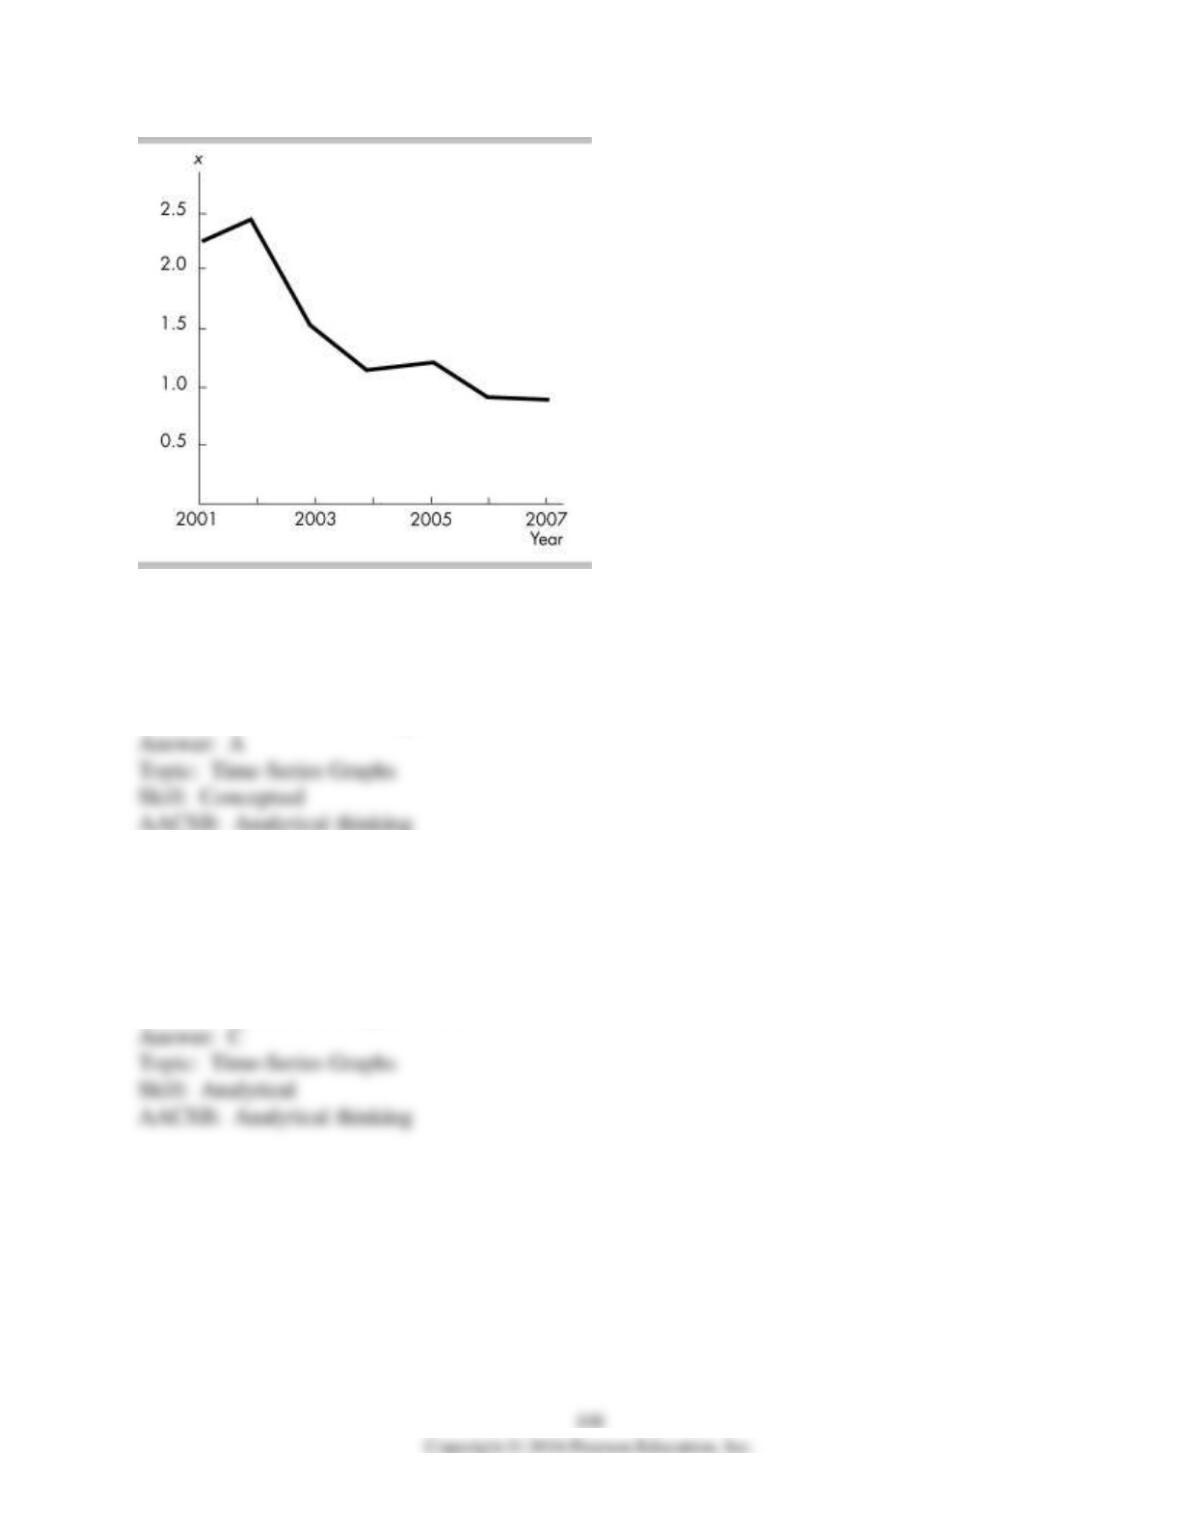
18) In the above figure, the diagram shows
A) a downward trend in x.
B) an upward trend in x.
C) a scatter diagram.
D) a two-variable scatter diagram.
19) Inflation climbed steadily from 1952 to 1972. A time-series graph with inflation on the
vertical axis and time (in years) on the horizontal axis would show
A) the rate of inflation as a horizontal line.
B) that inflation was following a decreasing trend line.
C) that inflation had a positive trend.
D) that inflation had a negative trend.
20) A time-series graph displays the price of copper. The slope of the line is negative for periods
when the
A) price of copper is falling.
B) price of copper is rising.
C) quantity of copper is falling.
D) price of copper is low and not changing.
21) A graph shows the wages of factory workers. The slope of the line is positive for periods
when the wage rate is
A) falling.
B) rising.
C) high but not rising any higher.
D) low.
22) On a time-series graph with a ratio scale
A) the slope of the line is negative when the level of the variable is rising.
B) the same distance along the vertical axis measures different amounts of the variable.
C) time is plotted on the vertical axis rather than the horizontal axis.
D) it is impossible to determine a trend.
23) You believe that the total amount of goods produced in the United States has generally
increased over the years. In a time-series graph illustrating the total amount produced, you expect
to find
A) an upward trend.
B) no relationship between time and the amount of goods produced.
C) an inverse relationship between time and the amount of goods produced.
D) a linear relationship.
10 Appendix: Essay Questions
1) What kind of information is conveyed in a time-series graph?
11 Appendix: Numeric and Graphing Questions
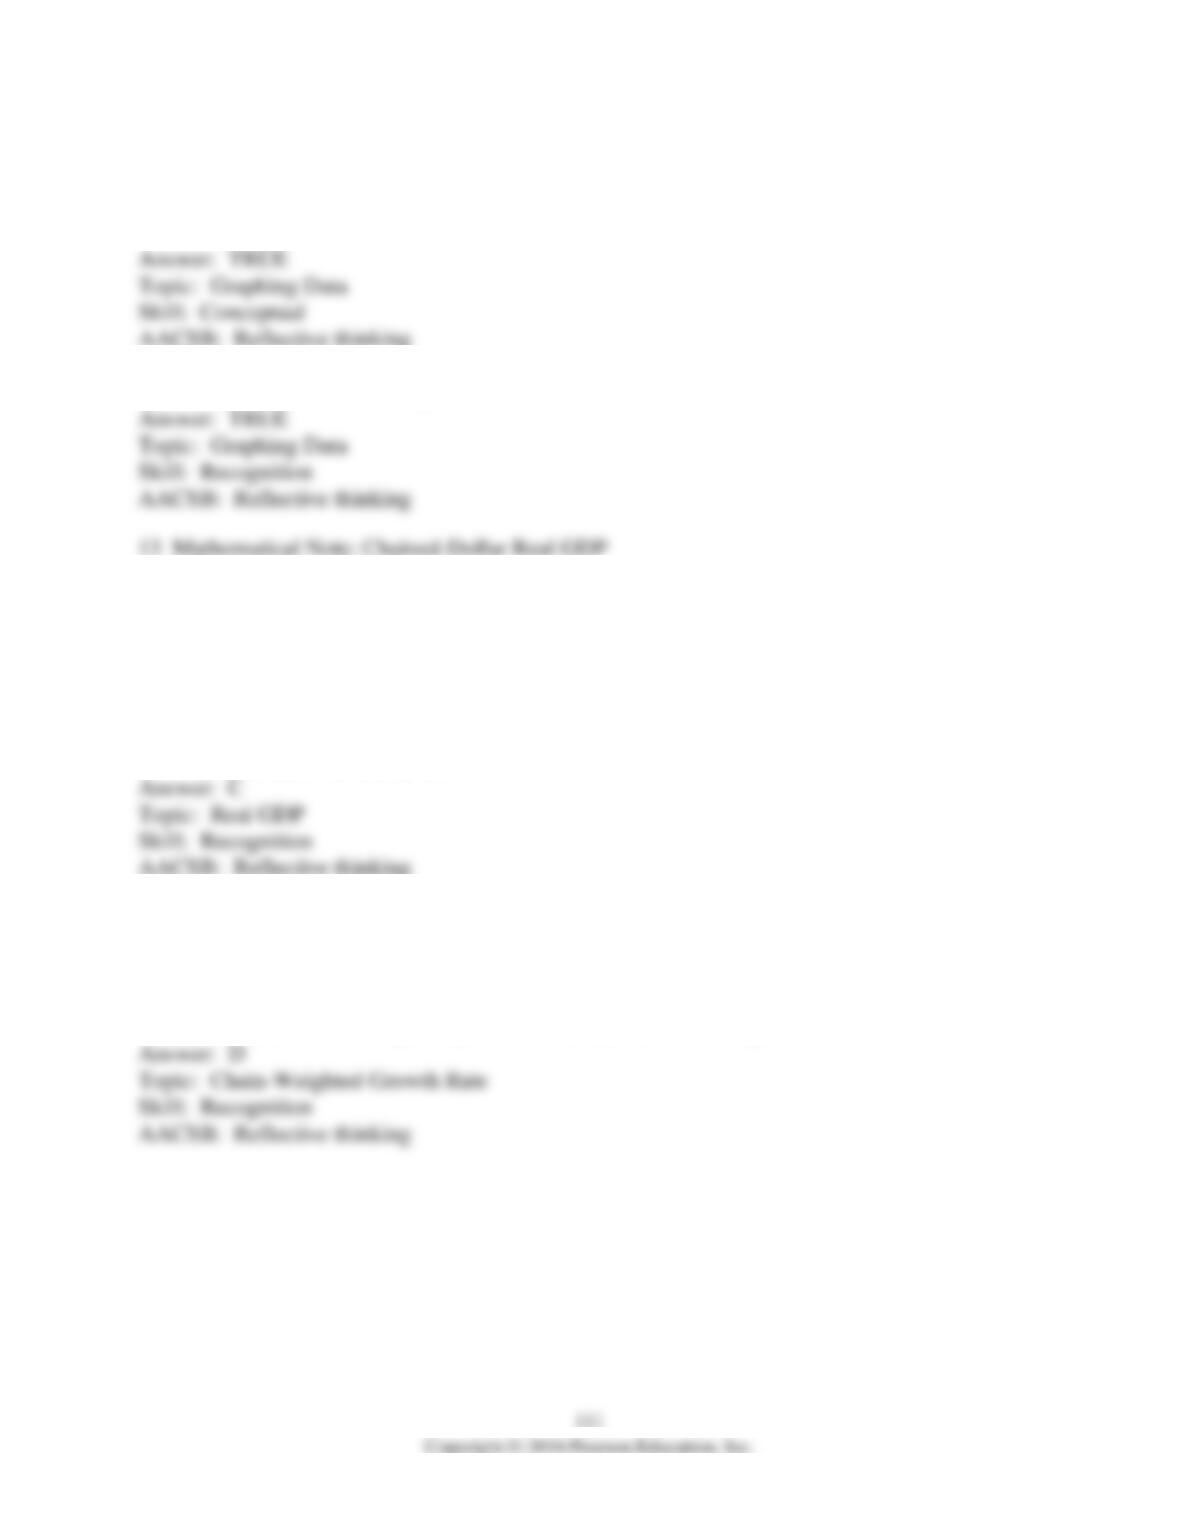
1) The figure above shows the price of a DVD player from 2003 to 2007.
a) What type of graph is illustrated above?
b) What is the trend in the price of a DVD player?
12 Appendix: True or False
1) A time series graph can show both the level of a variable and the speed with which the
variable changes over time.
2) A trend is a general tendency for a variable to increase or decrease over time.
1) Valuing the quantities of goods produced in consecutive years using prices in both years and
then averaging the percentage changes in the value of output is part of the ________ method of
calculating real GDP.
A) base-year
B) moving-base-year
C) chain-weighted output index
D) fixed quantities/variable prices
2) The chain-weighted output index method ________.
A) is used to calculate the value of nominal GDP
B) values the quantities produced in a year at the prices of the base year
C) shows that real GDP increases every year
D) uses the prices of two adjacent years to calculate the real GDP growth rate
3) Which of the following is TRUE regarding the chain-weighted output index method?
I. It is the method used to measure the growth rate of nominal GDP.
II. It uses data from the current year and from the previous year.
III. It is a method of measuring the growth rate of real GDP.
A) I and II
B) II and III
C) I and III
D) I, II and III
4) The chain-weighted output index
A) uses only the current year’s prices to calculate growth in real GDP.
B) uses prices for the current year and the previous year to calculate growth in real GDP.
C) must be calculated only every other year.
D) is an inaccurate way to measure growth in real GDP and so has been replaced by the
“nominal-to-real” index.
5) The chain-weighted output index method of calculating real GDP compares
A) compares the quantities of goods produced in consecutive years using prices in both years and
averaging the percentage changes in the value of output.
B) quantities produced in different years using prices from a year chosen as a reference period.
C) quantities produced in different years with the prices that prevailed during the year in which
the output was produced.
D) prices at different points in time using a sample of goods that is representative of goods
purchased by households.
6) The chain-weighted output index method of measuring real GDP is based on
A) using current prices rather than base year prices.
B) averaging the market value of the expenditures over a two year period and then comparing
with a base period.
C) using the prices of two adjacent years to calculate the growth rate of real GDP.
D) averaging the nominal and real measures of GDP to come up with a more accurate figure.
113
7) At 2015 prices, the value of production in 2016 was 6 percentage points higher than in 2015.
At 2016 prices, the value of production in 2016 was 4 percentage points higher than in 2015.
Using the chain-weighted output index, real GDP is ________ in 2016 than in 2015.
A) 10 percent greater
B) 5 percent greater
C) 7.5 percent greater
D) 4 percent smaller
8) Real GDP in 2015 is $10 trillion. Between 2015 and 2016, using 2015 prices, GDP grew 3
percent and using 2016 prices real GDP grew 7 percent. Using the chain-weighted output index
method, real GDP in 2016 is ________ trillion.
A) $10.5
B) $11
C) $10.1
D) $12.72