Chapter 4/The Market Forces of Supply and Demand ❖ 41
7. Holding the nonprice determinants of supply constant, a change in price would
a.
result in either a decrease in supply or an increase in supply.
b.
result in a movement along a stationary supply curve.
c.
result in a shift of demand.
d.
have no effect on the quantity supplied.
8. An increase in the price of a good would
a.
increase the supply of the good.
b.
increase the amount purchased by buyers.
c.
give producers an incentive to produce more.
d.
decrease both the quantity demanded of the good and the quantity supplied of the good.
9. An increase in the price of oranges would lead to
a.
an increased supply of oranges.
b.
a reduction in the prices of inputs used in orange production.
c.
an increased demand for oranges.
d.
a movement up and to the right along the supply curve for oranges.
10. An increase in quantity supplied
a.
results in a movement downward and to the left along a fixed supply curve.
b.
results in a movement upward and to the right along a fixed supply curve.
c.
shifts the supply curve to the left.
d.
shifts the supply curve to the right.
11. A decrease in quantity supplied
a.
results in a movement downward and to the left along a fixed supply curve.
b.
results in a movement upward and to the right along a fixed supply curve.
c.
shifts the supply curve to the left.
d.
shifts the supply curve to the right.
42 ❖ Chapter 4/The Market Forces of Supply and Demand
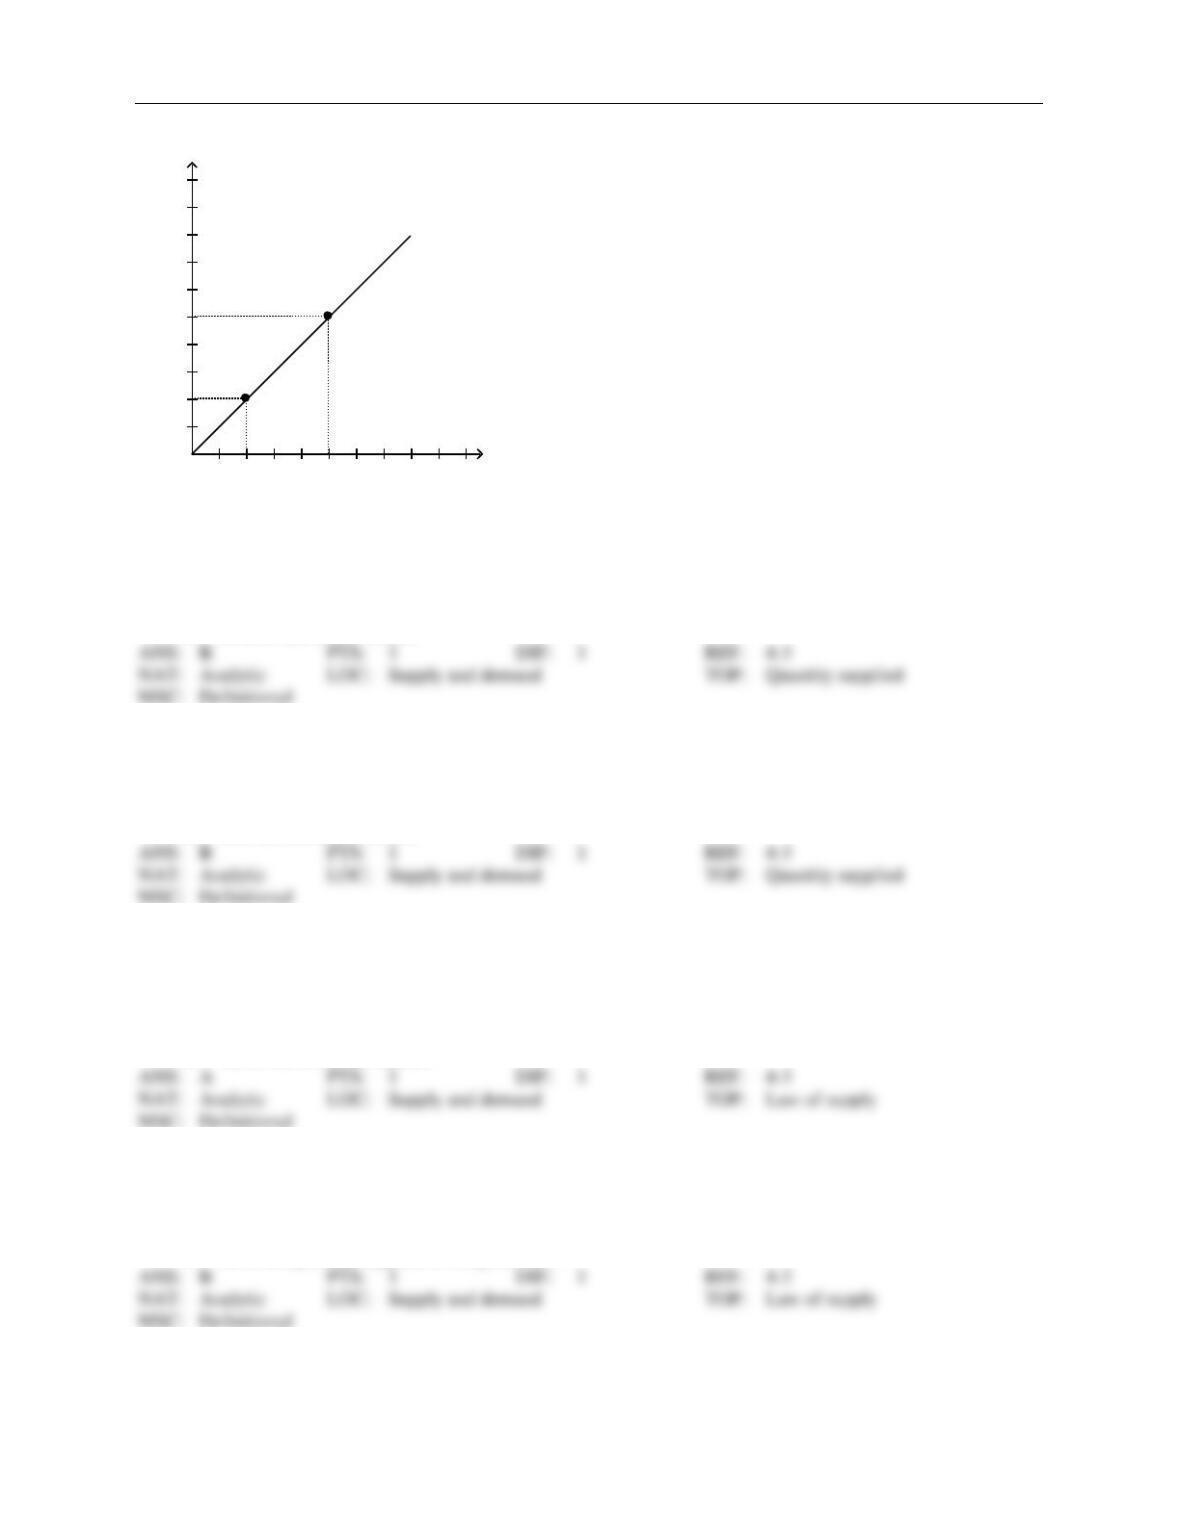
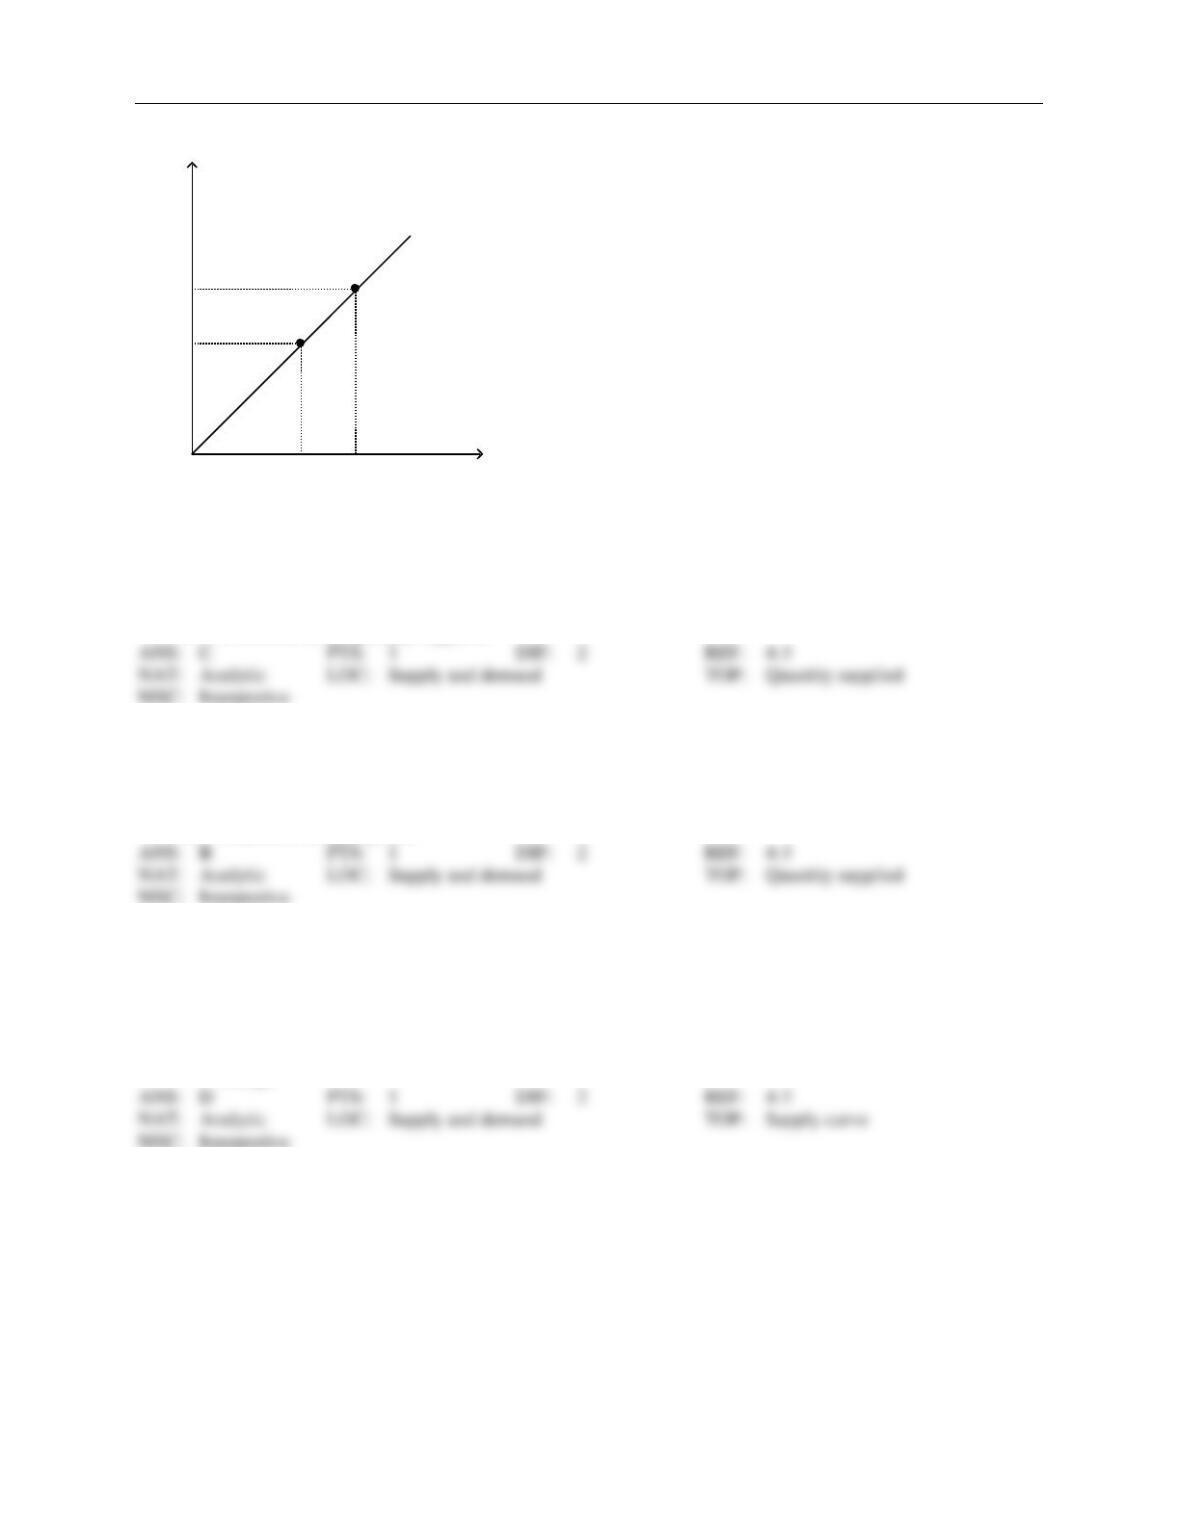
Figure 4-8
Supply
B
A
1 2 3 4 5 6 7 8 Quantity
1
2
3
4
5
6
7
8
9
10 Price
12. Refer to Figure 4-8. The movement from Point A to Point B represents a(n)
a.
shift in the supply curve.
b.
decrease in the quantity supplied.
c.
increase in the quantity supplied.
d.
Both a) and b) are correct.
13. Refer to Figure 4-8. The movement from Point A to Point B represents a(n)
a.
increase in the price.
b.
decrease in the quantity supplied.
c.
shift in the supply curve.
d.
Both a) and b) are correct.
14. “Other things equal, when the price of a good rises, the quantity supplied of the good also rises, and when the
price falls, the quantity supplied falls as well.” This relationship between price and quantity supplied
a.
is referred to as the law of supply.
b.
applies only to a few goods in the economy.
c.
is represented by a downward-sloping supply curve.
d.
All of the above are correct.
15. The law of supply states that, other things equal, when the price of a good
a.
falls, the supply of the good rises.
b.
rises, the quantity supplied of the good rises.
c.
rises, the supply of the good falls.
d.
falls, the quantity supplied of the good rises.
Chapter 4/The Market Forces of Supply and Demand ❖ 43
16. The law of supply states that, other things equal, an increase in
a.
price causes quantity supplied to increase.
b.
price causes quantity supplied to decrease.
c.
quantity supplied causes price to increase.
d.
quantity supplied causes price to decrease.
17. Other things equal, when the price of a good falls, the
a.
quantity supplied of the good increases.
b.
supply decreases.
c.
quantity supplied of the good decreases.
d.
demand increases.
18. Which of these statements best represents the law of supply?
a.
When input prices increase, sellers produce less of the good.
b.
When production technology improves, sellers produce less of the good.
c.
When the price of a good decreases, sellers produce less of the good.
d.
When sellers’ supplies of a good increase, the price of the good increases.
19. A supply curve slopes upward because
a.
as more is produced, total cost of production falls.
b.
an increase in input prices increases supply.
c.
the quantity supplied of most goods and services increases over time.
d.
an increase in price gives producers an incentive to supply a larger quantity.
20. Which of the following demonstrates the law of supply?
a.
When leather became more expensive, belt producers decreased their supply of belts.
b.
When car production technology improved, car producers increased their supply of cars.
c.
When sweater producers expected sweater prices to rise in the near future, they decreased their
current supply of sweaters.
d.
When ketchup prices rose, ketchup sellers increased their quantity supplied of ketchup.
44 ❖ Chapter 4/The Market Forces of Supply and Demand
21. The following table contains a supply schedule for a good.
Price
Quantity Supplied
$10
100
$20
Q1
If the law of supply applies to this good, then Q1 could be
a.
0.
b.
50.
c.
100.
d.
150.
22. A supply schedule is a table that shows the relationship between
a.
price and quantity supplied.
b.
input costs and quantity supplied.
c.
quantity demanded and quantity supplied.
d.
profit and quantity supplied.
23. Which of the following is not held constant in a supply schedule?
a.
production technology
b.
the price of the good
c.
the prices of inputs
d.
expectations
24. The difference between a supply schedule and a supply curve is that a supply schedule
a.
incorporates demand and a supply curve does not.
b.
incorporates profit and a supply curve does not.
c.
can shift, but a supply curve cannot shift.
d.
is a table, and a supply curve is drawn on a graph.
Chapter 4/The Market Forces of Supply and Demand ❖ 45
Figure 4-9
S
P
Q
A
P’
Q’
B
quantity
price
25. Refer to Figure 4-9. The movement from point A to point B on the graph is called
a.
a decrease in supply.
b.
an increase in supply.
c.
an increase in the quantity supplied.
d.
a decrease in the quantity supplied.
26. Refer to Figure 4-9. The movement from point A to point B on the graph is caused by
a.
a decrease in the price of the good.
b.
an increase in the price of the good.
c.
an advance in production technology.
d.
a decrease in input prices.
27. Refer to Figure 4-9. The movement from point A to point B on the graph represents
a.
an increased willingness and ability on the part of suppliers to supply the good at each possible
price.
b.
an increase in the number of suppliers.
c.
a decrease in the price of a relevant input.
d.
an increase in the price of the good that is being supplied and the suppliers’ responses to that price
change.
46 ❖ Chapter 4/The Market Forces of Supply and Demand
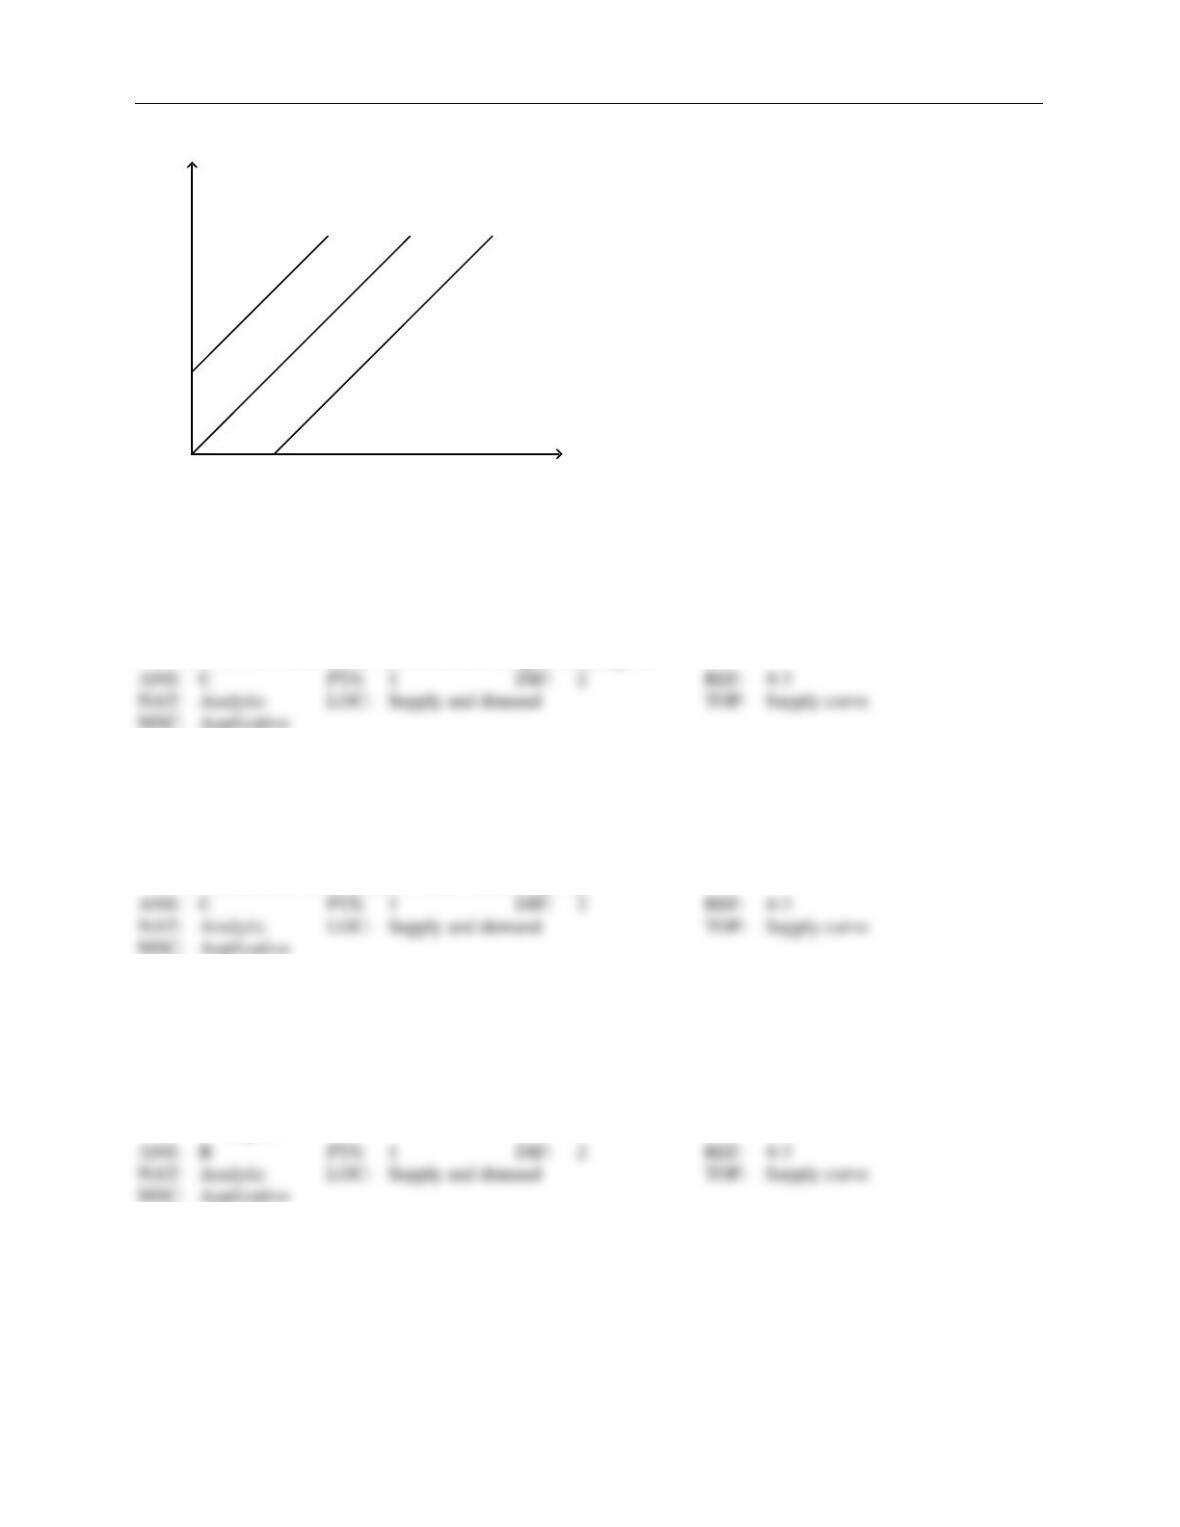
Figure 4-10
Supply A Supply B Supply C
Quantity
Price
28. Refer to Figure 4-10. Which of the following would cause the supply curve to shift from Supply A to Supply
C in the market for tennis racquets?
a.
an increase in the price of tennis balls
b.
an expectation by firms that the price of tennis racquets will increase in the very near future
c.
a decrease in the price of tennis racquet strings
d.
a decrease in the number of firms selling tennis racquets
29. Refer to Figure 4-10. Which of the following would cause the supply curve to shift from Supply A to Supply
C in the market for winter coats?
a.
an increase in the price of winter coats
b.
a decrease in the number of firms selling winter coats
c.
a decrease in the price of zippers and snaps
d.
a decrease in the price of winter hats and gloves
30. Refer to Figure 4-10. Which of the following would cause the supply curve to shift from Supply B to Supply
A in the market for tennis racquets?
a.
a decrease in the price of tennis balls
b.
an expectation by firms that the price of tennis racquets will increase in the very near future
c.
a decrease in the price of tennis racquet strings
d.
an improvement in technology that allows firms to use less labor in the production of tennis
racquets
Chapter 4/The Market Forces of Supply and Demand ❖ 47
31. Refer to Figure 4-10. Which of the following would cause the supply curve to shift from Supply B to Supply
A in the market for disposable ballpoint pens?
a.
a decrease in the price of disposable ballpoint pens
b.
an increase in the price of fountain pens
c.
an increase in the price of ink
d.
an improvement in technology that allows firms to use less labor in the production of disposable
ballpoint pens
32. The supply curve for a good is a line that relates
a.
profit and quantity supplied.
b.
quantity supplied and quantity demanded.
c.
price and quantity supplied.
d.
price and profit.
33. The line that relates the price of a good and the quantity supplied of that good is called the supply
a.
schedule, and it usually slopes upward.
b.
schedule, and it usually slopes downward.
c.
curve, and it usually slopes upward.
d.
curve, and it usually slopes downward.
34. When we move along a given supply curve,
a.
only price is held constant.
b.
technology and price are held constant.
c.
all nonprice determinants of supply are held constant.
d.
all determinants of quantity supplied are held constant.
35. Once the supply curve for a product or service is drawn, it
a.
remains stable over time.
b.
can shift either rightward or leftward.
c.
is possible to move along the curve, but the curve will not shift.
d.
tends to become steeper over time.
36. If something happens to alter the quantity supplied at any given price, then
a.
we move along the supply curve.
b.
the supply curve shifts.
c.
the supply curve becomes steeper.
d.
the supply curve becomes flatter.

48 ❖ Chapter 4/The Market Forces of Supply and Demand
37. An increase in supply is represented by a
a.
movement downward and to the left along a supply curve.
b.
movement upward and to the right along a supply curve.
c.
rightward shift of a supply curve.
d.
leftward shift of a supply curve.
38. A decrease in supply is represented by a
a.
movement downward and to the left along a supply curve.
b.
movement upward and to the right along a supply curve.
c.
rightward shift of a supply curve.
d.
leftward shift of a supply curve.
39. A leftward shift of a supply curve is called a(n)
a.
increase in supply.
b.
decrease in supply.
c.
decrease in quantity supplied.
d.
increase in quantity supplied.
40. A rightward shift of a supply curve is called a(n)
a.
increase in supply.
b.
decrease in supply.
c.
decrease in quantity supplied.
d.
increase in quantity supplied.
41. A movement upward and to the right along a supply curve is called a(n)
a.
increase in supply.
b.
decrease in supply.
c.
decrease in quantity supplied.
d.
increase in quantity supplied.
42. A movement downward and to the left along a supply curve is called a(n)
a.
increase in supply.
b.
decrease in supply.
c.
decrease in quantity supplied.
d.
increase in quantity supplied.
Chapter 4/The Market Forces of Supply and Demand ❖ 49
43. When quantity supplied decreases at every possible price, we know that the supply curve has
a.
shifted to the left.
b.
shifted to the right.
c.
not shifted; rather, we have moved along the supply curve to a new point on the same curve.
d.
not shifted; rather, the supply curve has become flatter.
44. When quantity supplied increases at every possible price, we know that the supply curve has
a.
shifted to the left.
b.
shifted to the right.
c.
not shifted; rather, we have moved along the supply curve to a new point on the same curve.
d.
not shifted; rather, the supply curve has become flatter.
45. The supply curve for milk
a.
shifts when the price of milk changes because the price of milk is measured on the vertical axis of
the graph.
b.
shifts when the price of milk changes because the quantity supplied of milk is measured on the
horizontal axis of the graph.
c.
does not shift when the price of milk changes because the price of milk is measured on the vertical
axis of the graph.
d.
does not shift when the price of milk changes because the price of milk is measured on the
horizontal axis of the graph.
46. Which of the following changes would not shift the supply curve for a good or service?
a.
a change in production technology
b.
a change in the price of the good or service
c.
a change in expectations about the future price of the good or service
d.
a change in input prices
47. Which of the following would not shift the supply curve for mp3 players?
a.
an increase in the price of mp3 players
b.
a decrease in the number of sellers of mp3 players
c.
an increase in the price of plastic, an input into the production of mp3 players
d.
an improvement in the technology used to produce mp3 players
50 ❖ Chapter 4/The Market Forces of Supply and Demand
48. Which of the following events would cause a movement upward and to the right along the supply curve for
mangos?
a.
The number of sellers of mangos increases.
b.
There is an advance in technology that reduces the cost of producing mangos.
c.
The price of fertilizer decreases, and fertilizer is an input in the production of mangos.
d.
The price of mangos rises.
49. The sum of all the individual supply curves for a product is called
a.
total supply.
b.
market supply.
c.
aggregate supply.
d.
total output.
50. The market supply curve
a.
is found by vertically adding the individual supply curves.
b.
slopes downward.
c.
represents the sum of the prices that all the sellers are willing to accept for a given quantity of the
good.
d.
represents the sum of the quantities supplied by all the sellers at each price of the good.
51. In a market, to find the total amount supplied at a particular price, we must
a.
sum the quantities that individual firms are willing and able to supply at that price.
b.
calculate the average of the quantities that individual firms are willing and able to supply at that
price.
c.
sum the costs that individual firms incur to supply the product at that price.
d.
account for all determinants of demand.
52. A market supply curve is determined by
a.
vertically summing individual supply curves.
b.
horizontally summing individual supply curves.
c.
finding the average quantity supplied by sellers at each possible price.
d.
finding the average price at which sellers are willing and able to sell a particular quantity of the
good.
Chapter 4/The Market Forces of Supply and Demand ❖ 51
53. A market supply curve shows
a.
the total quantity supplied at all possible prices.
b.
the average quantity supplied by producers at all possible prices.
c.
how quantity supplied changes when consumer income changes.
d.
suppliers’ responses, in terms of the amounts they will supply, to the demands of buyers.
54. A market supply curve shows how the total quantity supplied of a good varies as
a.
production technology varies.
b.
price varies.
c.
input prices vary.
d.
demand varies.
55. Suppose there are five suppliers of ice cream in the town of Summerville. If we add the respective quantities
that each firm would produce at each of the five ice cream parlors when the price of ice cream is $2 per scoop,
$2.50 per scoop, and $3 per scoop, and so forth, we have found the
a.
market demand curve.
b.
market supply curve.
c.
equilibrium curve.
d.
surplus or shortage depending on market conditions.
Table 4-4
Price
Firm A’s
Quantity
Supplied
Firm B’s
Quantity
Supplied
Firm C’s
Quantity
Supplied
Firm D’s
Quantity
Supplied
$0
10
0
0
0
$2
8
3
4
5
$4
6
6
8
10
$6
4
9
12
15
$8
2
12
8
20
$10
0
15
4
25
56. Refer to Table 4-4. Which supply schedules obey the law of supply?
a.
Firm A’s only
b.
Firm B’s, Firm C’s, and Firm D’s only
c.
Firm A’s and Firm C’s only
d.
Firm B’s and Firm D’s only

52 ❖ Chapter 4/The Market Forces of Supply and Demand
57. Refer to Table 4-4. If these are the only four sellers in the market, then the market quantity supplied at a
price of $4 is
a.
4 units.
b.
7.5 units.
c.
10 units.
d.
30 units.
58. Refer to Table 4-4. If these are the only four sellers in the market, then the market quantity supplied at a
price of $10 is
a.
3 units.
b.
11 units.
c.
25 units.
d.
44 units.
59. Refer to Table 4-4. If these are the only four sellers in the market, then when the price increases from $6 to
$8, the market quantity supplied
a.
increases by 0.5 units.
b.
increases by 2 units.
c.
decreases by 4 units.
d.
increases by 42 units.
60. Refer to Table 4-4. If these are the only four sellers in the market, then when the price decreases from $4 to
$2, the market quantity supplied
a.
increases by 10 units.
b.
decreases by 10 units.
c.
decreases by 20 units.
d.
decreases by 30 units.
Chapter 4/The Market Forces of Supply and Demand ❖ 53
Table 4-5
Price
Firm A’s
Quantity
Supplied
Firm B’s
Quantity
Supplied
Firm C’s
Quantity
Supplied
Firm D’s
Quantity
Supplied
$0
0
0
0
0
$2
3
4
2
1
$4
6
8
4
2
$6
9
12
6
3
$8
12
16
8
4
$10
15
20
10
5
61. Refer to Table 4-5. If these are the only four sellers in the market, then the market quantity supplied at a
price of $4 is
a.
4 units.
b.
5 units.
c.
20 units.
d.
80 units.
62. Refer to Table 4-5. If these are the only four sellers in the market, then the market quantity supplied at a
price of $8 is
a.
10 units.
b.
20 units.
c.
32 units.
d.
40 units.
63. Refer to Table 4-5. If these are the only four sellers in the market, then when the price decreases from $10 to
$8, the market quantity supplied decreases by
a.
2.5 units.
b.
4 units.
c.
10 units.
d.
50 units.
64. Refer to Table 4-5. If these are the only four sellers in the market, then when the price increases from $4 to
$6, the market quantity supplied
a.
decreases by 10 units.
b.
decreases by 20 units.
c.
increases by 10 units.
d.
increases by 20 units.
54 ❖ Chapter 4/The Market Forces of Supply and Demand
Figure 4-11
Firm A
Firm B
S
2 4 6 8 10 12 14 16 18 20 quantity
2
4
6
8
10
12
14
16
18
20 price
S
246810 12 14 16 quantity
2
4
6
8
10
12
14
16
18
20 price
65. Refer to Figure 4-11. If these are the only two sellers in the market, then the market quantity supplied at a
price of $4 is
a.
6 units.
b.
7 units.
c.
8 units.
d.
14 units.
66. Refer to Figure 4-11. If these are the only two sellers in the market, then the market quantity supplied at a
price of $6 is
a.
2 units.
b.
10 units.
c.
12 units.
d.
22 units.
67. Refer to Figure 4-11. If these are the only two sellers in the market, then the market quantity supplied at a
price of $8 is
a.
14 units.
b.
15 units.
c.
16 units.
d.
29 units.
Chapter 4/The Market Forces of Supply and Demand ❖ 55
Figure 4-12
S1
Producer A
246810 12 14 16 Quantity
2
4
6
8
10
12
14
16
18
20 Price
S2
Producer B
246810 12 14 16 Quantity
2
4
6
8
10
12
14
16
18
20 Price
68. Refer to Figure 4-12. If Producer A and Producer B are the only producers in the market, then the market
quantity supplied when the price is $4 is
a.
4 units.
b.
8 units.
c.
12 units.
d.
16 units.
69. The supply curve for portable charcoal grills shifts
a.
only when production technology changes.
b.
when a determinant of the supply of portable charcoal grills other than the price of portable
charcoal grills changes.
c.
when any determinant of the supply of portable charcoal grills changes.
d.
only when the number of sellers of portable charcoal grills changes.
70. Lead is an important input in the production of crystal. If the price of lead decreases, then we would expect
the supply of
a.
crystal to be unaffected.
b.
crystal to decrease.
c.
crystal to increase.
d.
lead to increase.
71. Suppose you make jewelry. If the price of gold falls, then we would expect you to
a.
be willing and able to produce less jewelry than before at each possible price.
b.
be willing and able to produce more jewelry than before at each possible price.
c.
face a greater demand for your jewelry.
d.
face a weaker demand for your jewelry.

56 ❖ Chapter 4/The Market Forces of Supply and Demand
72. Workers at a bicycle assembly plant currently earn the mandatory minimum wage. If the federal government
increases the minimum wage by $1.00 per hour, then it is likely that the
a.
demand for bicycle assembly workers will increase.
b.
supply of bicycles will shift to the right.
c.
supply of bicycles will shift to the left.
d.
firm must increase output to maintain profit levels.
73. Suppose there is an increase in the price of steel. We would expect the supply curve for steel beams to
a.
shift rightward.
b.
shift leftward.
c.
become flatter.
d.
remain unchanged.
74. Wheat is the main input in the production of flour. If the price of wheat decreases, then we would expect the
a.
demand for flour to increase.
b.
demand for flour to decrease.
c.
supply of flour to increase.
d.
supply of flour to decrease.
75. Matthew bakes apple pies that he sells at the local farmer’s market. If the price of apples increases, the
a.
supply curve for Matthew’s pies will increase.
b.
supply curve for Matthew’s pies will decrease.
c.
demand curve for Matthew’s pies will increase.
d.
demand curve for Matthew’s pies will decrease.
76. Suppose an increase in the price of rubber coincides with an advance in the technology of tire production. As
a result of these two events, the demand for tires
a.
decreases, and the supply of tires increases.
b.
is unaffected, and the supply of tires decreases.
c.
is unaffected, and the supply of tires increases.
d.
None of the above is necessarily correct.
77. A improvement in production technology will shift the
a.
supply curve to the right.
b.
supply curve to the left.
c.
demand curve to the right.
d.
demand curve to the left.
Chapter 4/The Market Forces of Supply and Demand ❖ 57
78. An improvement in production technology will
a.
increase a firm‘s costs and increase its supply.
b.
increase a firm’s costs and decrease its supply.
c.
decrease a firm’s costs and increase its supply.
d.
decrease a firm’s costs and decrease its supply.
79. If car manufacturers begin using new labor-saving technology on their assembly lines, we would not expect
a.
a smaller quantity of labor to be used.
b.
the supply of cars to increase.
c.
the firms’ costs to fall.
d.
individual car manufacturers to move up and to the right along their individual supply curves.
80. Which of the following might cause the supply curve for an inferior good to shift to the right?
a.
an increase in input prices
b.
a decrease in consumer income
c.
an improvement in production technology that makes production of the good more profitable
d.
a decrease in the number of sellers in the market
81. Ashley bakes bread that she sells at the local farmer’s market. If she purchases a new convection oven that
reduces the costs of baking bread, the
a.
supply curve for Ashley’s bread will increase.
b.
supply curve for Ashley’s bread will decrease.
c.
demand curve for Ashley’s bread will increase.
d.
demand curve for Ashley’s bread will decrease.
82. Today, producers changed their expectations about the future. This change
a.
can cause a movement along a supply curve.
b.
can affect future supply, but not today’s supply.
c.
can affect today’s supply.
d.
cannot affect either today’s supply or future supply.
83. If suppliers expect the price of their product to fall in the future, then they will
a.
decrease supply now.
b.
increase supply now.
c.
decrease supply in the future but not now.
d.
increase supply in the future but not now.
58 ❖ Chapter 4/The Market Forces of Supply and Demand
84. If sellers expect higher basket prices in the near future, the current
a.
supply of baskets will increase.
b.
supply of baskets will decrease.
c.
supply of baskets will be unaffected.
d.
demand for baskets will decrease.
85. Today’s supply curve for gasoline could shift in response to a change in
a.
today’s price of gasoline.
b.
the expected future price of gasoline.
c.
the number of buyers of gasoline.
d.
All of the above are correct.
86. A dress manufacturer recently has come to expect higher prices for dresses in the near future. We would ex-
pect
a.
the dress manufacturer to supply more dresses now than it was supplying previously.
b.
the dress manufacturer to supply fewer dresses now than it was supplying previously.
c.
the demand for this manufacturer’s dresses to fall.
d.
no change in the dress manufacturer’s current supply; instead, future supply will be affected.
87. Recent forest fires in the western states are expected to cause the price of lumber to rise in the next six months.
As a result, we can expect the supply of lumber to
a.
fall in six months but not now.
b.
increase in six months when the price goes up.
c.
fall now.
d.
increase now to meet as much demand as possible.
88. Funsters, Inc., the largest toy company in the country, sells its most popular doll for $15. It has just learned
that its leading competitor, Toysorama, is mass-producing an excellent copy and plans to flood the market
with their $5 doll in six weeks. Funsters should
a.
“fight fire with fire” by decreasing supply of its doll for six weeks and then increasing the supply.
b.
increase the supply of its doll now before the other doll hits the market.
c.
increase the price of its doll now.
d.
discontinue its doll.
Chapter 4/The Market Forces of Supply and Demand ❖ 59
89. Which of the following is a determinant of the market supply curve but not a determinant of an individual sell-
er’s supply?
a.
production technology
b.
expectations
c.
input prices
d.
the number of sellers
90. If the number of sellers in a market increases, then the
a.
demand in that market will increase.
b.
supply in that market will increase.
c.
supply in that market will decrease.
d.
demand in that market will decrease.
91. A decrease in the number of sellers in the market causes
a.
the supply curve to shift to the left.
b.
the supply curve to shift to the right.
c.
a movement up and to the right along a stationary supply curve.
d.
a movement downward and to the left along a stationary supply curve.
92. An increase in which of the following would shift the supply curve for gasoline to the right?
a.
demand for gasoline
b.
price of gasoline
c.
number of producers of gasoline
d.
price of oil, an input into the production of gasoline
93. Which of the following events could cause an increase in the supply of ceiling fans?
a.
The number of sellers of ceiling fans increases.
b.
There is an increase in the price of air conditioners, and consumers regard air conditioners and
ceiling fans as substitutes.
c.
There is an increase in the price of the motor that powers ceiling fans.
d.
All of the above are correct.
60 ❖ Chapter 4/The Market Forces of Supply and Demand
Figure 4-13
SS’
quantity
price
94. Refer to Figure 4-13. The shift from S to S’ is called a(n)
a.
decrease in supply.
b.
decrease in quantity supplied.
c.
increase in supply.
d.
increase in quantity supplied.
95. Refer to Figure 4-13. The shift from S to S’ could be caused by an
a.
increase in the price of the good.
b.
improvement in production technology.
c.
increase in income.
d.
increase in input prices.
96. Refer to Figure 4-13. The shift from S to S’ in the market for peaches could be caused by a(n)
a.
increase in the price of peaches.
b.
decrease in the price of pears.
c.
increase in income.
d.
decrease in the labor costs of the workers who pick peaches.
97. Refer to Figure 4-13. The shift from S’ to S in the market for chocolate cake could be caused by a(n)
a.
decrease in the number of commercial bakers.
b.
improvement in oven technology.
c.
decrease in the price of butter.
d.
decrease in the price of chocolate cake.