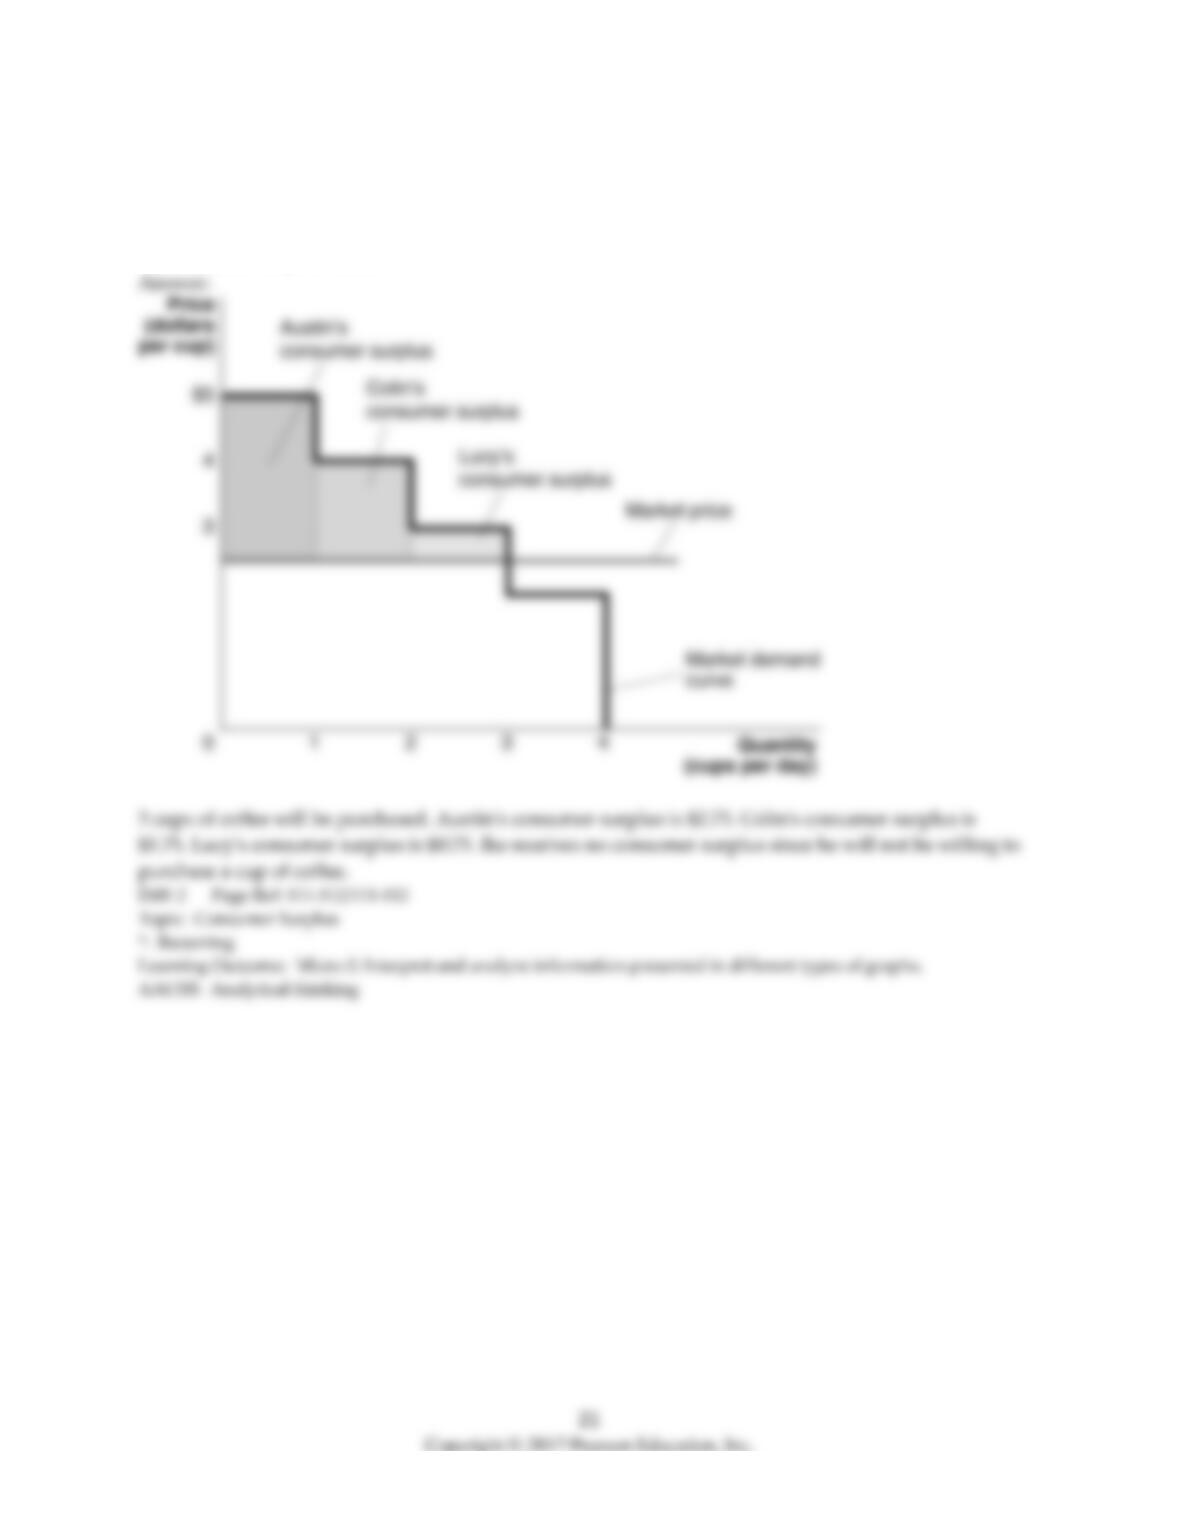
67) The market price for coffee is $2.25 per cup. Austin is willing to pay $5.00 per cup, Colin is willing to
pay $4.00 per cup, Lucy is willing to pay $3.00 per cup, and Ike is willing to pay $2.00 per cup.
Construct a graph showing the consumer surplus for each cup of coffee purchased. How many cups of
coffee will be purchased? What is the value of the consumer surplus each of the four consumers receives
from their coffee purchases?
4.2 The Efficiency of Competitive Markets
1) In a competitive market equilibrium the ________ equals the ________ of the last unit sold.
A) total profit; marginal benefit
B) total cost; marginal cost
C) profit; selling price
D) marginal benefit; marginal cost
2) When the marginal benefit equals the marginal cost of the last unit sold in a competitive market
A) the net benefit of consumers is equal to the net benefit of producers.
B) an economically efficient level of output is produced.
C) producer surplus is equal to consumer surplus.
D) total benefit is equal to total cost.
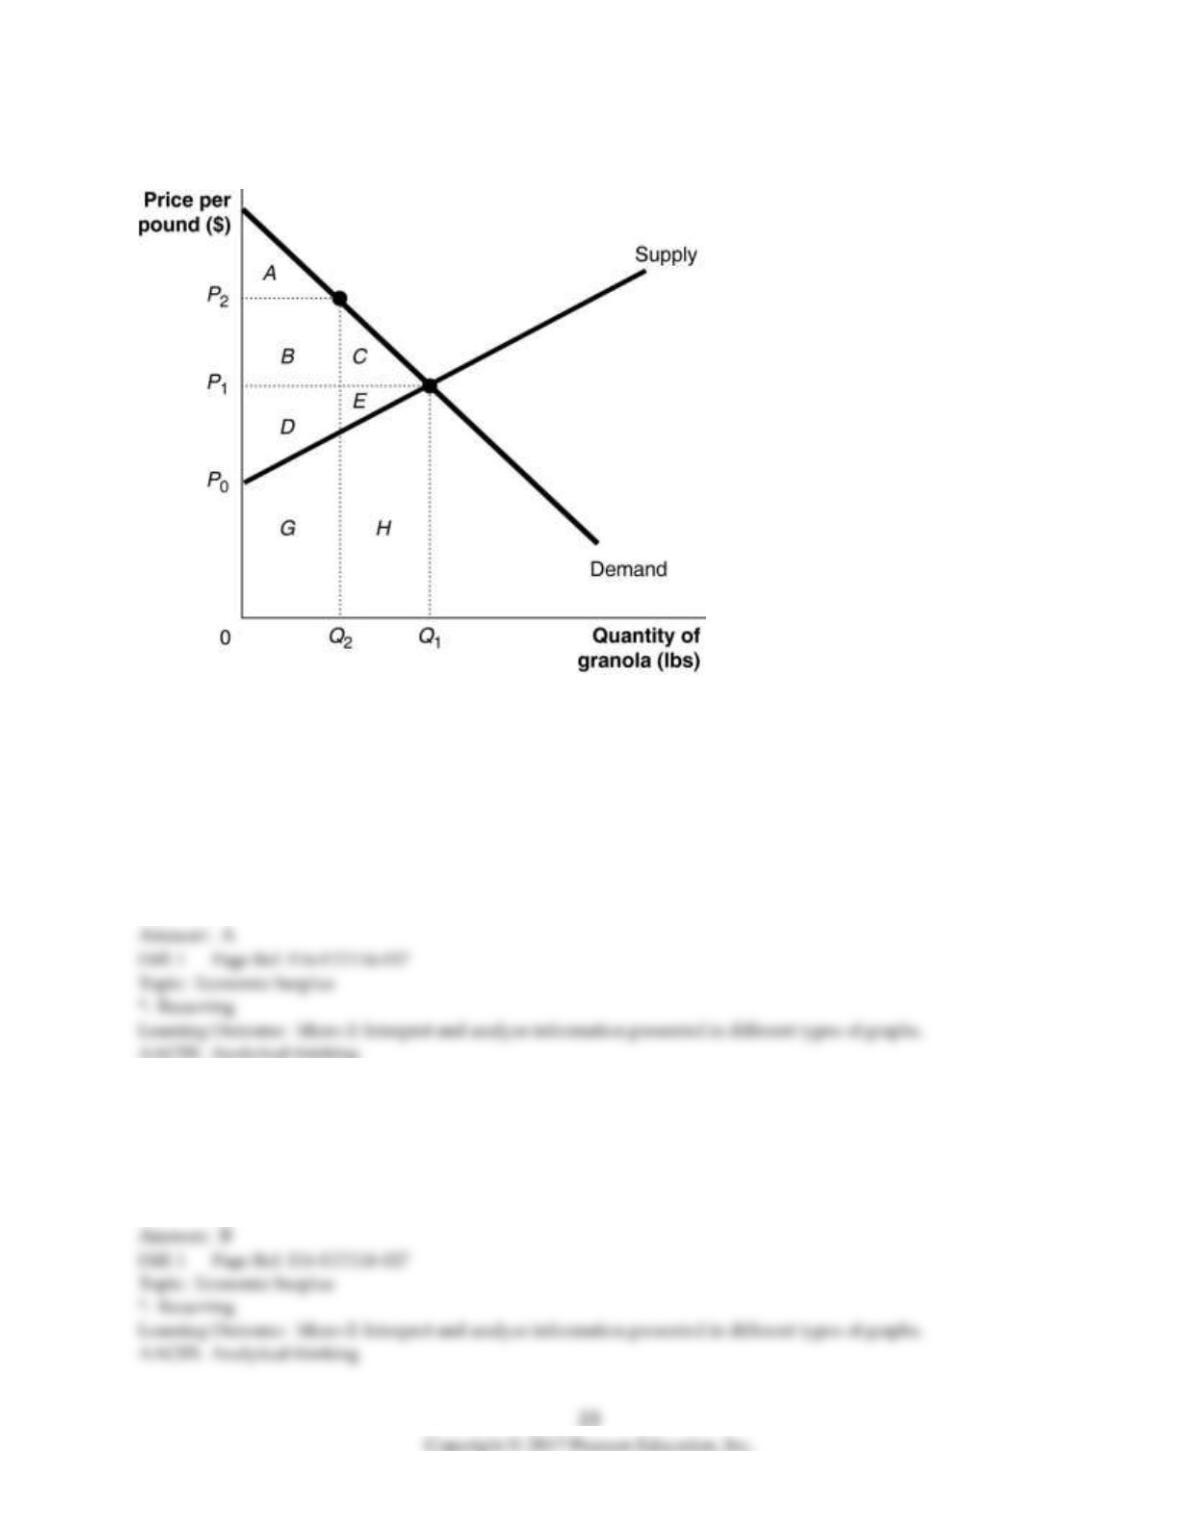
Figure 4-3
Figure 4-3 shows the market for granola. The market is initially in equilibrium at a price of P1 and a
quantity of Q1. Now suppose producers decide to cut output to Q2 in order to raise the price to P2.
3) Refer to Figure 4-3. What area represents consumer surplus at P2?
A) A
B) A + B
C) B + C
D) A + B + D + E
4) Refer to Figure 4-3. What area represents producer surplus at P2?
A) A + B + D
B) B + D
C) B + D + G
D) B + C + D + E
5) Refer to Figure 4-3. What area represents the deadweight loss at P2?
A) C + E + H
B) G + H
C) C + E
D) B + C
6) Refer to Figure 4-3. At the price P2, consumers are willing to buy the Q2 pounds of granola. Is this an
economically efficient quantity?
A) No, the marginal benefit of the last unit (Q2) exceeds the marginal cost of that last unit.
B) Yes, otherwise consumers would not buy Q2 units.
C) Yes, because the price P2 shows what consumers are willing to pay for the product.
D) No, the marginal cost of the last unit (Q2) exceeds the marginal benefit of the last unit.
7) Refer to Figure 4-3. What area represents consumer surplus at the equilibrium price of P1?
A) A
B) A + B + C
C) D + E
D) A + B + C + D + E
8) Refer to Figure 4-3. What area represents producer surplus at the equilibrium price of P1?
A) A + B + D
B) D + E
C) D + E + G + H
D) A + B + C + D + E
9) Refer to Figure 4-3. What area represents the deadweight loss at the equilibrium price of P1?
A) C + E + H
B) G + H
C) C + E
D) There is no deadweight loss at the price of P1.
10) Refer to Figure 4-3. At the equilibrium price of P1, consumers are willing to buy Q1 pounds of
granola. Is this an economically efficient quantity?
A) No, the marginal benefit of the last unit (Q1) exceeds the marginal cost of that last unit.
B) Yes, because marginal cost is zero at the price of P1.
C) Yes, because P1 is the price where marginal benefit equals marginal cost.
D) No, the marginal cost of the last unit (Q1) exceeds the marginal benefit of the last unit.
11) Deadweight loss refers to
A) the opportunity cost to firms from producing the equilibrium quantity in a competitive market.
B) the sum of consumer and producer surplus.
C) the loss of economic surplus when the marginal benefit equals the marginal cost of the last unit
produced.
D) the reduction in economic surplus resulting from not being in competitive equilibrium.
12) The sum of consumer surplus and producer surplus is equal to
A) the deadweight loss.
B) the economic surplus.
C) zero.
D) total profit.
13) Economic surplus is maximized in a competitive market when
A) demand is equal to supply.
B) the deadweight loss equals the sum of consumer surplus and producer surplus.
C) marginal benefit equals marginal cost.
D) producers sell the quantity that consumers are willing to buy.
14) ________ is defined as a market outcome in which the marginal benefit to consumers of the last unit
produced is equal to the marginal cost of production, and in which the sum of consumer surplus and
producer surplus is at a maximum.
A) Economic efficiency
B) Consumer efficiency
C) Producer efficiency
D) Deadweight efficiency
15) If, in a competitive market, marginal benefit is greater than marginal cost
A) the net benefit to consumers from participating in the market is greater than the net benefit to
producers.
B) the government must force producers to lower price in order to achieve economic efficiency.
C) the quantity sold is greater than the equilibrium quantity.
D) the quantity sold is less than the equilibrium quantity.
16) In a competitive market the ________ curve shows the marginal benefit received by consumers and
the ________ curve shows the marginal cost to producers.
A) demand; supply
B) supply; demand
C) demand; market demand
D) supply; market supply
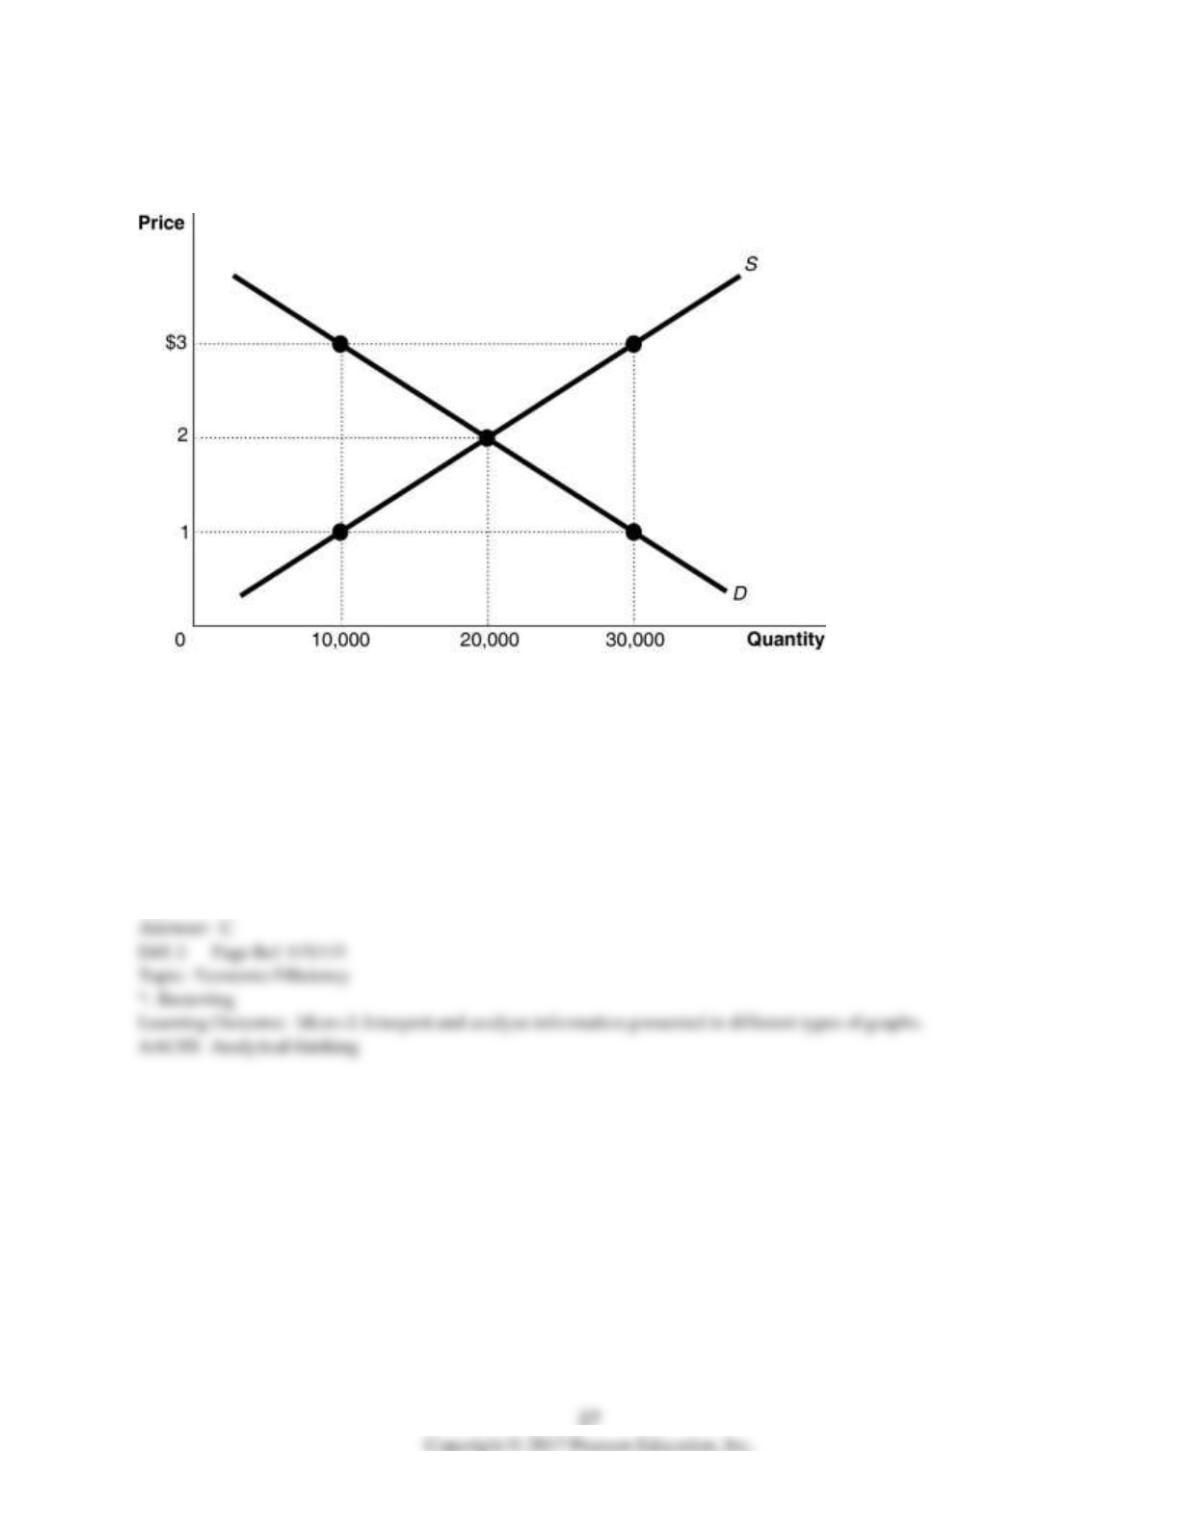
Figure 4-4
17) Refer to Figure 4-4. The figure above represents the market for iced tea. Assume that this is a
competitive market. At an output of 10,000 units
A) the marginal cost of iced tea is greater than the marginal benefit; therefore, output is inefficiently
low.
B) producers should lower the price to $1 in order to sell the quantity demanded of 10,000.
C) the marginal benefit of iced tea is greater than the marginal cost; therefore, output is inefficiently
low.
D) the marginal benefit of iced tea is greater than the marginal cost; therefore, output is inefficiently
high.
18) Refer to Figure 4-4. The figure above represents the market for iced tea. Assume that this is a
competitive market. At an output of 30,000 units
A) the marginal cost of iced tea is greater than the marginal benefit; therefore, output is inefficiently
high.
B) producers should raise the price to $3 in order to sell the quantity demanded of 30,000.
C) the marginal benefit of iced tea is greater than the marginal cost; therefore, output is inefficiently
low.
D) the marginal benefit of iced tea is greater than the marginal cost; therefore, output is inefficiently
high.
19) Refer to Figure 4-4. The figure above represents the market for iced tea. Assume that this is a
competitive market. If the price of iced tea is $1
A) the quantity supplied is less than the economically efficient quantity.
B) the quantity supplied is economically efficient but the quantity demanded is economically inefficient.
C) economic surplus is maximized.
D) not enough consumers want to buy iced tea.
20) Refer to Figure 4-4. The figure above represents the market for iced tea. Assume that this is a
competitive market. If the price of iced tea is $3
A) the quantity supplied is greater than the economically efficient quantity.
B) the quantity demanded is economically efficient but the quantity supplied is economically inefficient.
C) economic surplus is maximized.
D) too many consumers want to buy iced tea.
21) Refer to Figure 4-4. The figure above represents the market for iced tea. Assume that this is a
competitive market. If the price of iced tea is $3, what changes in the market would result in an
economically efficient output?
A) The price would decrease, the quantity supplied would increase, and the quantity demanded would
decrease.
B) The quantity supplied would decrease, the quantity demanded would increase, and the equilibrium
price would decrease.
C) The price would decrease, the demand would increase, and the supply would decrease.
D) The price would decrease, quantity demanded would increase, and quantity supplied would
decrease.
22) Refer to Figure 4-4. The figure above represents the market for iced tea. Assume that this is a
competitive market. If the price of iced tea is $1, what changes in the market would result in an
economically efficient output?
A) The price would increase, the quantity supplied would increase, and the quantity demanded would
decrease.
B) The quantity supplied would increase, the quantity demanded would decrease, and the equilibrium
price would increase.
C) The price would increase, the demand would increase, and the supply would decrease.
D) The price would increase, quantity demanded would increase, and quantity supplied would
decrease.
23) Refer to Figure 4-4. The figure above represents the market for iced tea. Assume that this is a
competitive market. If 20,000 units of iced tea are sold
A) the deadweight loss is equal to economic surplus.
B) producer surplus equals consumer surplus.
C) the marginal benefit of each of the 20,000 units of iced tea equals $3.
D) marginal benefit is equal to marginal cost.
24) Refer to Figure 4-4. The figure above represents the market for iced tea. Assume that this is a
competitive market. If 10,000 units of iced tea are sold
A) the deadweight loss is equal to economic surplus.
B) producer surplus equals consumer surplus.
C) the marginal benefit of each of the 10,000 units of iced tea equals $3.
D) marginal benefit is less than marginal cost.
25) Refer to Figure 4-4. The figure above represents the market for iced tea. Assume that this is a
competitive market. Which of the following is true?
A) If the price of iced tea is $3, the output will be economically efficient but there will be a deadweight
loss.
B) If the price of iced tea is $3, consumers will purchase more than the economically efficient output.
C) Both 10,000 and 30,000 are economically inefficient rates of output.
D) If the price of iced tea is $3, producers will sell 30,000 units of iced tea but this output will be
economically inefficient.
26) In a competitive market when there is no deadweight loss,
A) consumer surplus is minimized.
B) producer surplus is minimized.
C) consumer surplus plus producer surplus is minimized.
D) consumer surplus plus producer surplus is maximized.
27) Economic efficiency is achieved when there is a market outcome in which the marginal benefit to
consumers of the last unit produced is equal to its marginal cost of production and
A) economic surplus plus consumer surplus equals producer surplus.
B) consumer surplus plus producer surplus is maximized.
C) economic surplus is minimized.
D) the difference between consumer surplus and producer surplus is maximized.
28) There will be no deadweight loss if the marginal benefit to consumers is equal to the marginal cost
of production and the sum of consumer surplus and producer surplus is maximized.
29) If marginal benefit is less than marginal cost, output is inefficiently high.
30) The difference between consumer surplus and producer surplus in a market is equal to the
deadweight loss.
31) If the market price is at equilibrium, the deadweight loss is zero.
32) Deadweight loss refers to a loss in revenue resulting from producers having to reduce their selling
price to remain competitive.
33) Equilibrium in a competitive market results in the greatest amount of economic surplus from the
production of a good or service.
34) What is deadweight loss? When is deadweight loss equal to zero?
35) What is meant by the term “economic efficiency”?
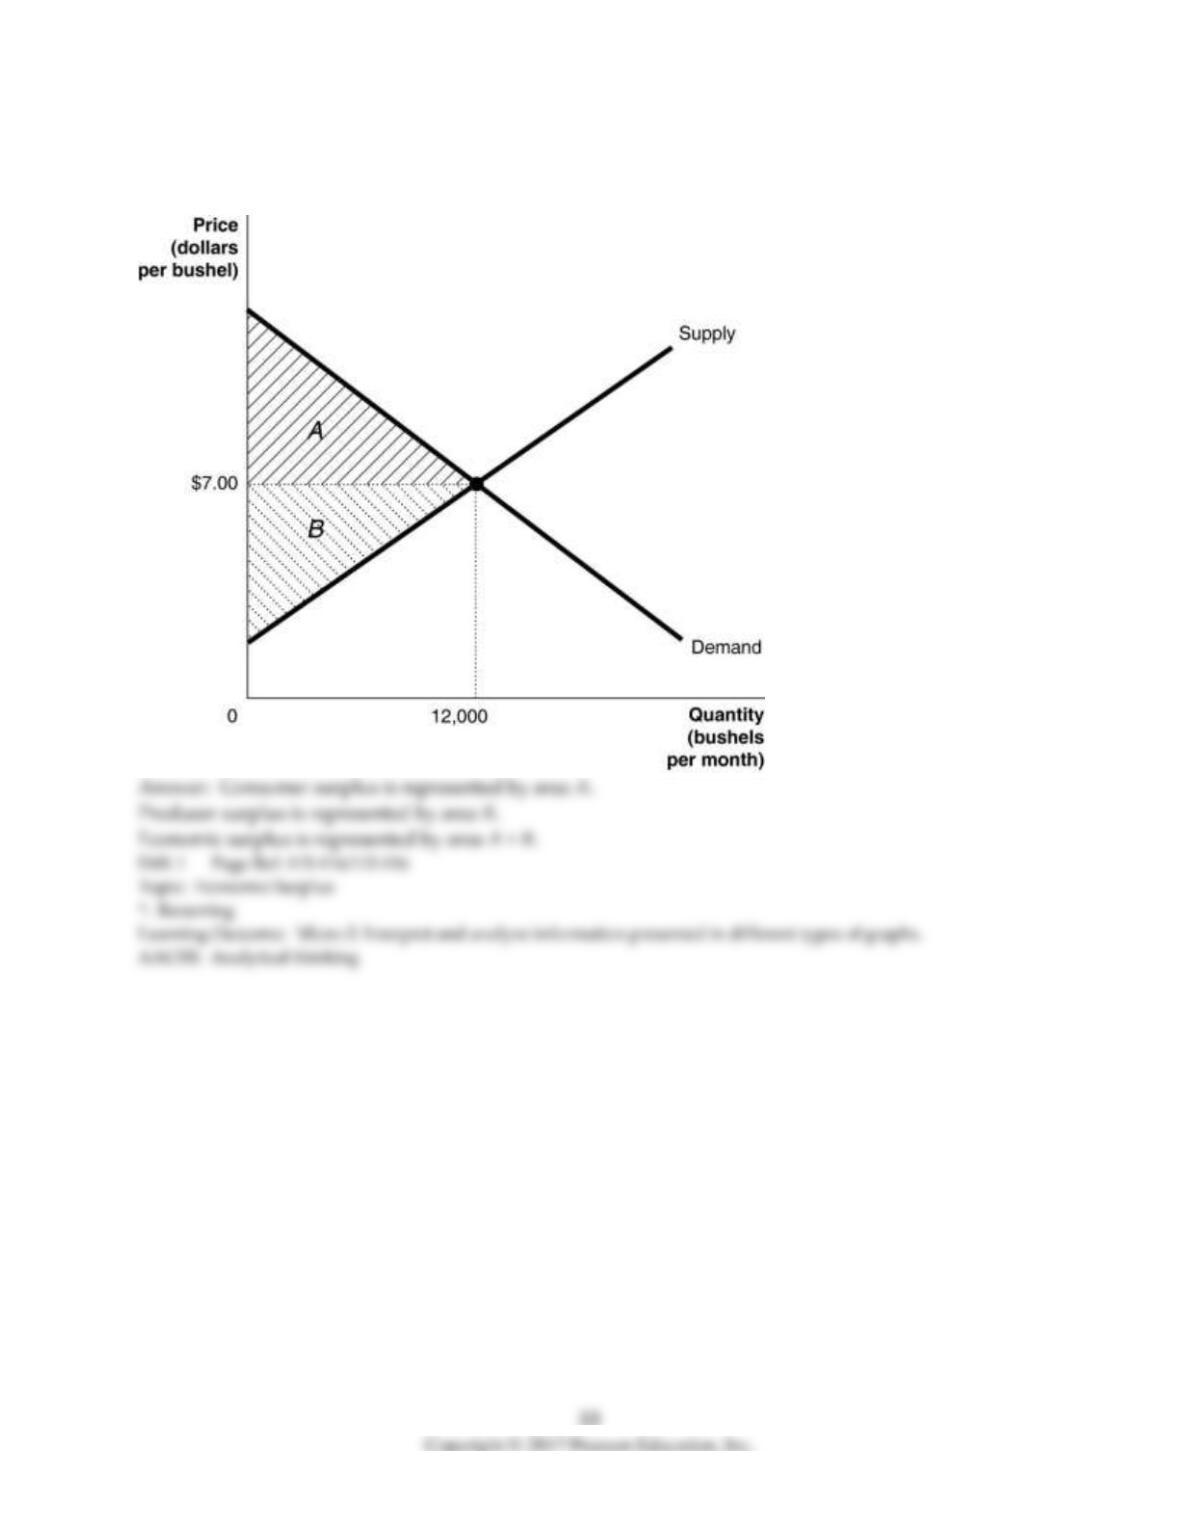
36) The graph below represents the market for alfalfa. The market price is $7.00 per bushel. Identify the
areas representing consumer surplus, producer surplus, and economic surplus.
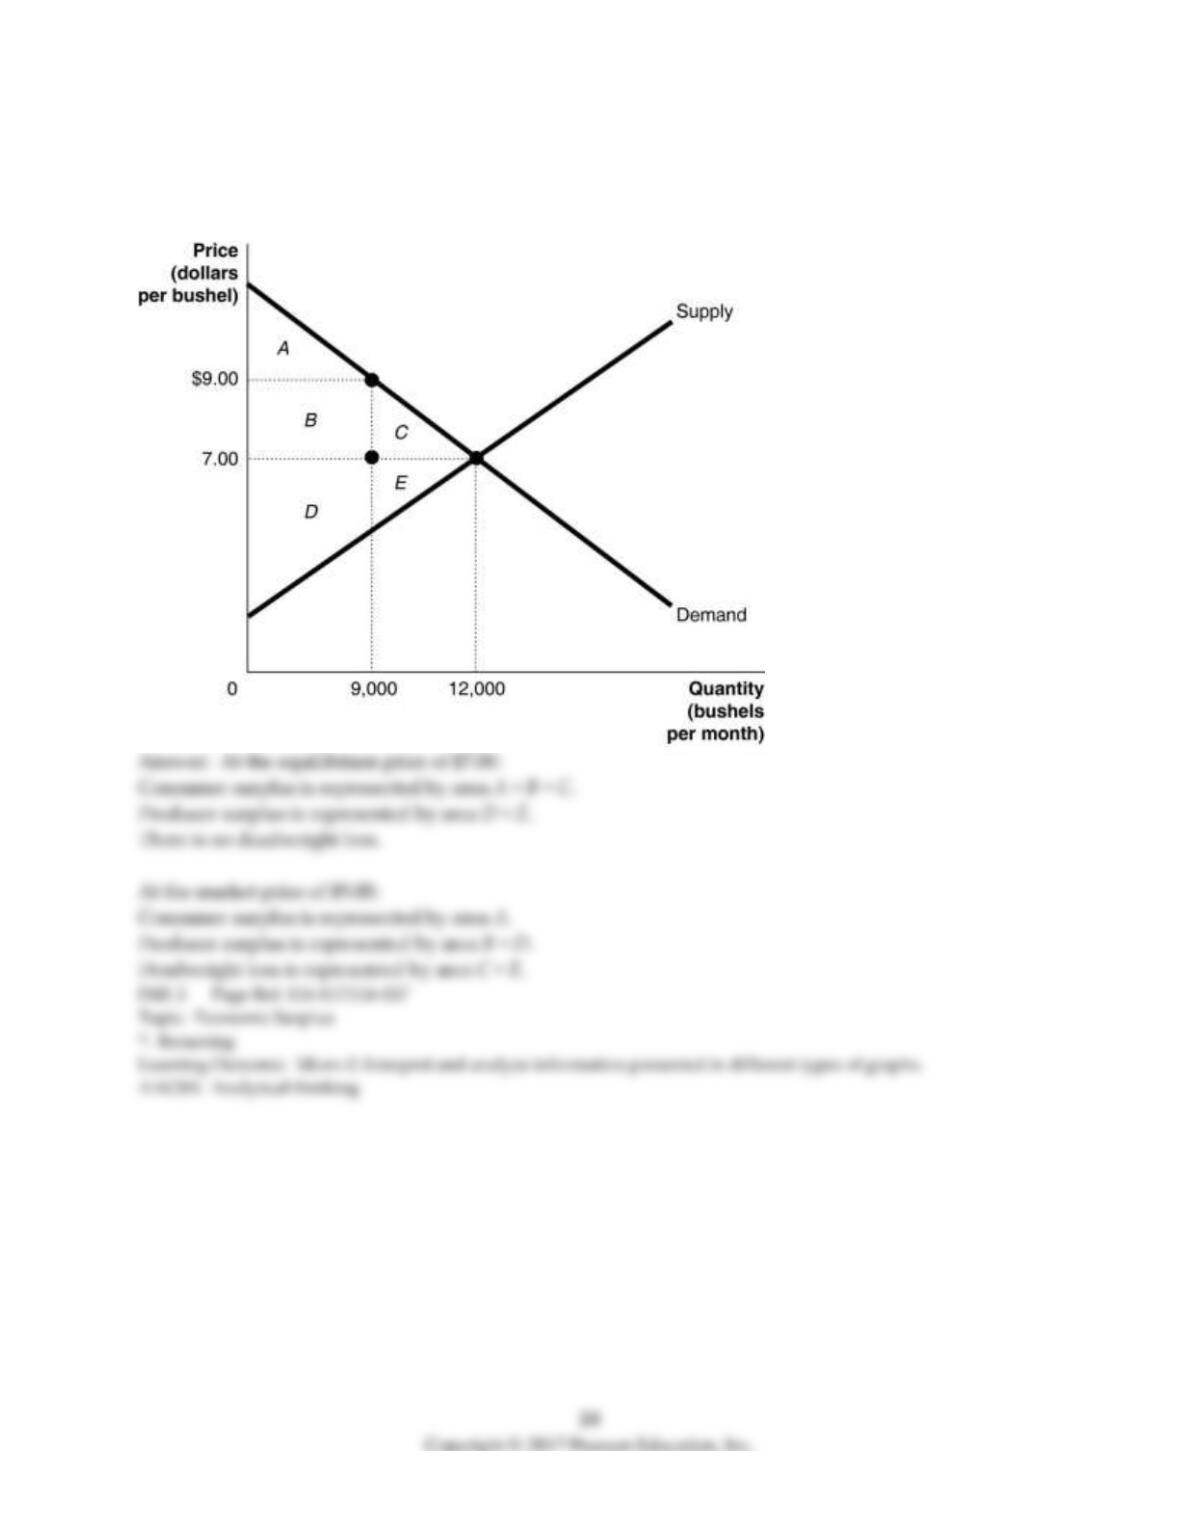
37) The graph below represents the market for alfalfa. The equilibrium price is $7.00 per bushel, but the
market price is $9.00 per bushel. Identify the areas representing consumer surplus, producer surplus,
and deadweight loss at the equilibrium price of $7.00 and at the market price of $9.00.
4.3 Government Intervention in the Market: Price Floors and Price Ceilings
1) When ________ in a market, the total net benefit to society is maximized.
A) deadweight loss is maximized
B) a competitive equilibrium is achieved
C) consumer surplus is minimized
D) producer surplus is minimized
Table 4-4
Hourly Wage
(dollars)
Quantity of
Labor
Supplied
Quantity of
Labor
Demanded
$8.00
350,000
390,000
8.50
360,000
380,000
9.00
370,000
370,000
9.50
380,000
360,000
10.00
390,000
350,000
10.50
400,000
340,000
Table 4-4 shows the demand and supply schedules for the low-skilled labor market in the city of
Westover.
2) Refer to Table 4-4. What is the equilibrium hourly wage (W*) and the equilibrium quantity of labor
(Q*)?
A) W* = $9.00; Q* = 370,000
B) W* = $8.50; Q* = 380,000
C) W* = $8.50; Q* = 360,000
D) W* = $9.00; Q* = 740,000
3) Refer to Table 4-4. If a minimum wage of $9.50 an hour is mandated, what is the quantity of labor
demanded?
A) 380,000
B) 370,000
C) 360,000
D) 10,000
4) Refer to Table 4-4. If a minimum wage of $9.50 an hour is mandated, what is the quantity of labor
supplied?
A) 390,000
B) 380,000
C) 370,000
D) 340,000
5) Refer to Table 4-4. If a minimum wage of $9.50 is mandated there will be a
A) shortage of 10,000 units of labor.
B) surplus of 10,000 units of labor.
C) shortage of 20,000 units of labor.
D) surplus of 20,000 units of labor.
6) Refer to Table 4-4. If a minimum wage of $10.00 an hour is mandated, what is the quantity of labor
demanded?
A) 390,000
B) 370,000
C) 350,000
D) 40,000
7) Refer to Table 4-4. If a minimum wage of $10.00 an hour is mandated, what is the quantity of labor
supplied?
A) 390,000
B) 370,000
C) 350,000
D) 40,000
8) Refer to Table 4-4. If a minimum wage of $10.00 is mandated there will be a
A) shortage of 20,000 units of labor.
B) surplus of 20,000 units of labor.
C) shortage of 40,000 units of labor.
D) surplus of 40,000 units of labor.
9) Refer to Table 4-4. If a minimum wage of $10.50 an hour is mandated, what is the quantity of labor
demanded?
A) 400,000
B) 370,000
C) 340,000
D) 60,000
10) Refer to Table 4-4. If a minimum wage of $10.50 an hour is mandated, what is the quantity of labor
supplied?
A) 400,000
B) 370,000
C) 340,000
D) 60,000
11) Refer to Table 4-4. If a minimum wage of $10.50 is mandated there will be a
A) shortage of 30,000 units of labor.
B) surplus of 30,000 units of labor.
C) shortage of 60,000 units of labor.
D) surplus of 60,000 units of labor.
12) Refer to Table 4-4. Suppose that the quantity of labor demanded increases by 40,000 at each wage
level. What are the new free market equilibrium hourly wage and the new equilibrium quantity of
labor?
A) W = $10.00; Q = 390,000
B) W = $9.50; Q = 380,000
C) W = $8.50; Q = 380,000
D) W = $8.00; Q = 390,000
13) Refer to Table 4-4. Suppose that the quantity of labor demanded decreases by 40,000 at each wage
level. What are the new free market equilibrium hourly wage and the new equilibrium quantity of
labor?
A) W = $10.00; Q = 390,000
B) W = $9.50; Q = 380,000
C) W = $8.50; Q = 340,000
D) W = $8.00; Q = 350,000
14) Refer to Table 4-4. Suppose that the quantity of labor supplied increases by 40,000 at each wage
level. What are the new free market equilibrium hourly wage and the new equilibrium quantity of
labor?
A) W = $9.00; Q = 410,000
B) W = $9.50; Q = 420,000
C) W = $8.50; Q = 400,000
D) W = $8.00; Q = 390,000
15) Refer to Table 4-4. Suppose that the quantity of labor supplied decreases by 40,000 at each wage
level. What are the new free market equilibrium hourly wage and the new equilibrium quantity of
labor?
A) W = $9.00; Q = 330,000
B) W = $9.50; Q = 370,000
C) W = $10.00; Q = 350,000
D) W = $8.00; Q = 390,000
16) Which of the following is a consequence of minimum wage laws?
A) Low-skilled workers benefit because minimum wage increases the number of jobs providing low–
skilled workers with training.
B) Employers will be reluctant to offer low-skilled workers jobs with training.
C) Producers have an incentive to offer workers non-wage benefits such as health care benefits and
convenient working hours rather than a higher wage.
D) All workers benefit when the minimum wage is increased.
17) The minimum wage is an example of
A) a subsidy for low-skilled workers.
B) a price floor.
C) a price ceiling.
D) a black market.