23) Calculate the tax-adjusted user cost of capital of a machine that costs $10,000 and
depreciates at a rate of 10%, when the real interest rate is 3% and the tax rate on revenue is 5%.
A) $1238
B) $1300
C) $1368
D) $1800
24) Cummins, Hubbard, and Hassett studied the effects of taxes on investment by
A) seeing if investment spending is correlated with taxes on investment.
B) examining what happened to investment when major tax reforms took place.
C) raising tax rates on certain businesses and testing their reaction.
D) raising tax rates on equipment and reducing tax rates on structures.
25) Cummins, Hubbard, and Hassett found that investment responded to a tax change that
affected the user cost of capital, with an elasticity of
A) 0.
B) -0.25.
C) -0.66.
D) -1.
26) What is the difference between gross investment and net investment?
A) Net investment = gross investment minus taxes
B) Net investment = gross investment minus net factor payments
C) Net investment = gross investment minus inventory accumulation
D) Net investment = gross investment minus depreciation
27) At the start of the year, your firm’s capital stock equaled $100 million, and at the end of the
year it equaled $105 million. The average depreciation rate on your capital stock is 20%. Gross
investment during the year equaled
A) $1 million.
B) $5 million.
C) $7 million.
D) $25 million.
28) At the start of the year, your firm’s capital stock equaled $10 million, and at the end of the
year it equaled $15 million. The average depreciation rate on your capital stock is 20%. Net
investment during the year equaled
A) $3 million.
B) $4 million.
C) $5 million.
D) $7 million.
29) Your firm has capital stock of $10 million and a depreciation rate of 15%. Gross investment
is $3 million. How much is net investment?
A) $1.5 million
B) $2.0 million
C) $2.5 million
D) $3.5 million
30) You have just purchased a home that cost $250,000. The nominal mortgage interest rate is
8% per annum, mortgage interest payments are tax deductible, and you are in a 30% tax bracket.
The expected inflation rate is 4%. Maintenance and other expenses are 8% of the initial value of
the house. What is the real user cost of your house?
A) $20,000
B) $24,000
C) $27,000
D) $30,000
20
31) How would the desired capital stock be affected by a decline in the user cost of capital?
32) A firm has current and future marginal productivity of capital given by MPK = 10,000 – 2K +
N, and marginal productivity of labor given by MPN = 50 – 2N + K. The price of capital is
$5000, the real interest rate is 10%, and capital depreciates at a 15% rate. The real wage rate is
$15.
(a) Calculate the user cost of capital.
(b) Find the firm’s optimal amount of employment and the size of the capital stock.
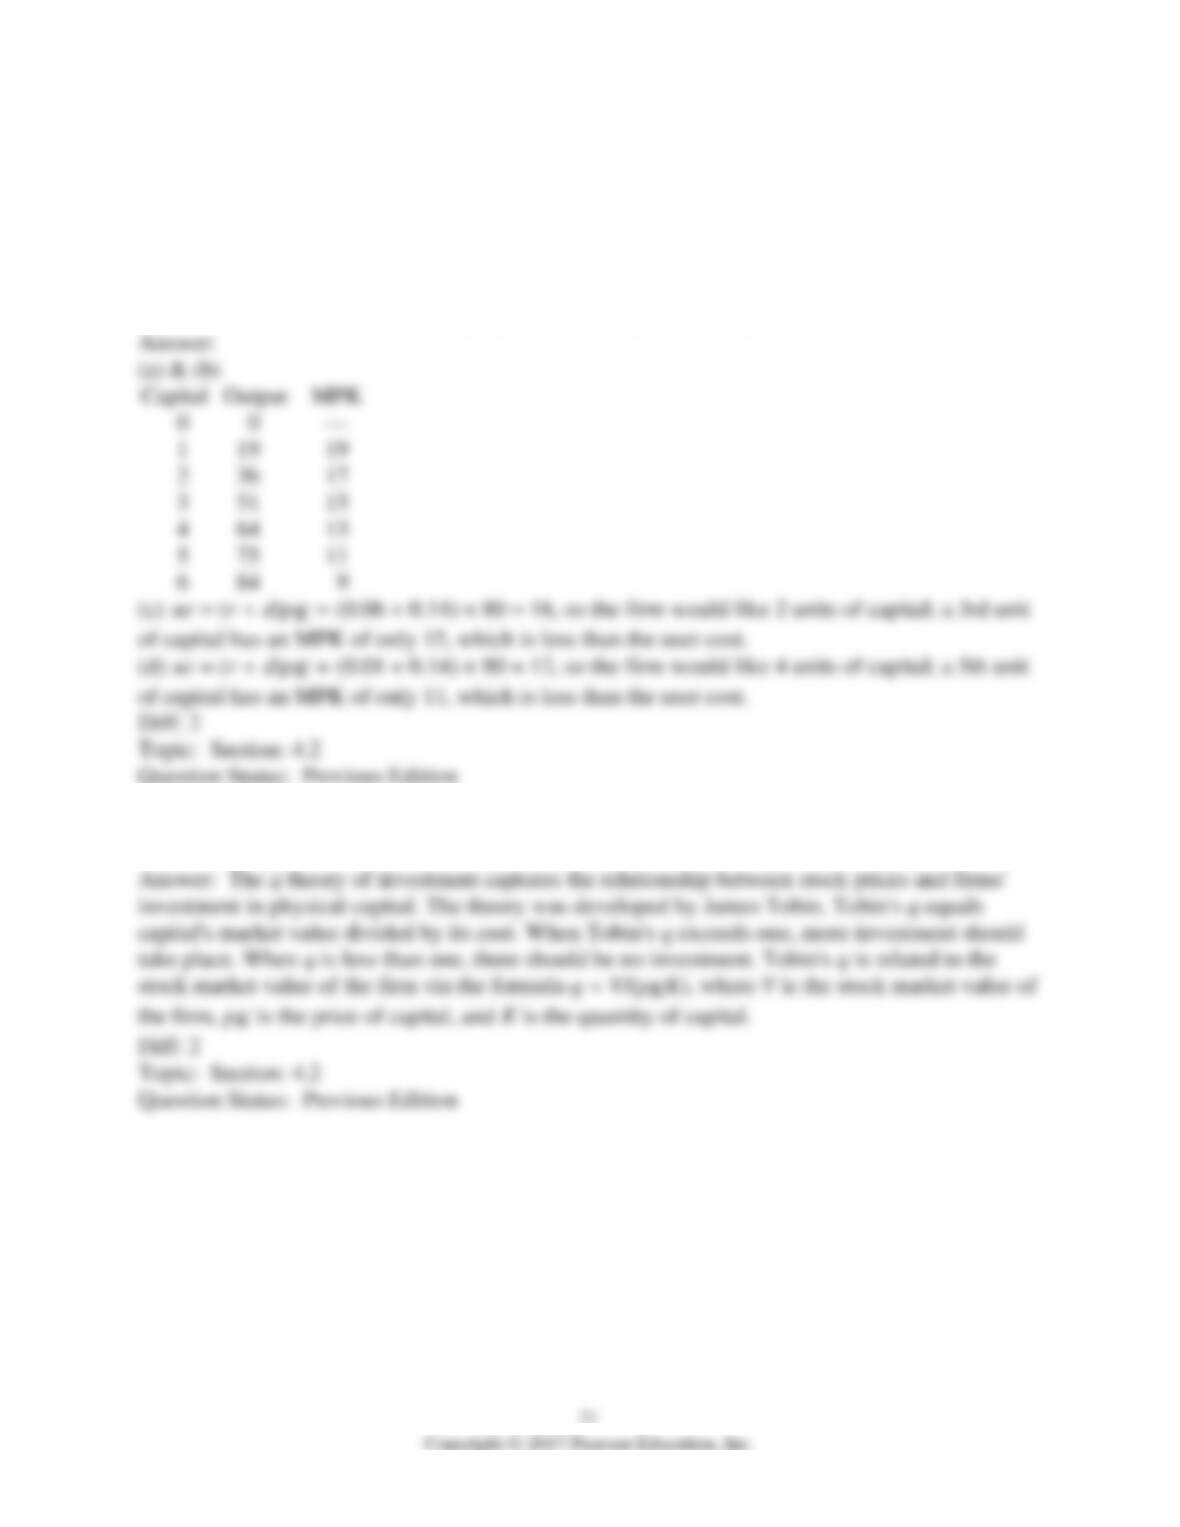
33) A firm’s output (Y) depends on how much capital (K) it has, according to the equation: Y =
20K – K2. The real interest rate is 6% per year, the depreciation rate of capital is 14% per year
and the price of a unit of capital is $80, and each unit of output sells for $1.
(a) For capital levels of 0 to 6, how much is output?
(b) For capital levels from 1 to 6, calculate the marginal product of capital.
(c) How many units of capital does the firm desire?
(d) If the real interest rate was 1% per year, how many units of capital would the firm desire?
34) What is the q theory of investment? Who developed it? What is q, and what do different
values of q imply? How is q related to the stock market value of a firm and its capital stock?
35) Draw a diagram showing the determination of a firm’s optimal capital stock, showing the
relationship between the user cost of capital and the future marginal product of capital. Suppose
the real interest rate declines. Show what happens to the firm’s optimal capital stock. What
happens to the firm’s desired investment?
4.3 Goods Market Equilibrium
1) When desired national saving equals desired national investment (in a closed economy), what
market is in equilibrium?
A) The goods market
B) The money market
C) The foreign exchange market
D) The stock market
2) In the goods market equilibrium condition for a closed economy, the total demand for goods
equals
A) Cd + Id
B) Cd + Id + G
C) Cd + Id – G
D) Cd + G – Id
3) One way of writing the goods—market equilibrium condition for a closed economy is
A) Y = C + G + S
B) Y = Cd + Gd + S
C) Sd = Id
D) Y – Cd – G – Sd = Id
4) An economy has full-employment output of 5000. Government purchases are 1000. Desired
consumption and desired investment are given by
Cd = 3000 – 2000r + 0.10Y
Id = 1000 – 4000r
where Y is output and r is the real interest rate. The real interest rate that clears the goods market
is equal to
A) 1.25%.
B) 2.50%.
C) 8.33%.
D) 25.00%.
5) An economy has government purchases of 1000. Desired national saving and desired
investment are given by
Sd = 200 + 5000r + 0.10Y – 0.20G
Id = 1000 – 4000r
When the full-employment level of output equals 5000, then the real interest rate that clears the
goods market will be
A) 1.11%.
B) 5.56%.
C) 16.67%.
D) 21.11%.
6) An economy has government purchases of 2000. Desired national saving and desired
investment are given by
Sd = 200 + 5000r + 0.10Y – 0.20G
Id = 1000 – 4000r
When the full-employment level of output equals 5000, then the real interest rate when the goods
market is in equilibrium will be
A) 7.78%.
B) 10.00%.
C) 14.44%.
D) 23.33%.
7) An economy has government purchases of 2000. Desired national saving and desired
investment are given by
Sd = 200 + 5000r + 0.10Y – 0.20G
Id = 1000 – 4000r
When the full-employment level of output equals 5000, then the level of investment when the
goods market is in equilibrium will be
A) 66.8.
B) 422.4.
C) 600.0.
D) 688.9.
8) Any change in the economy that raises desired national saving for a given value of the real
interest rate will shift the desired national saving curve to
A) the right and increase the real interest rate.
B) the right and decrease the real interest rate.
C) the left and increase the real interest rate.
D) the left and decrease the real interest rate.
9) An increase in the expected real interest rate tends to
A) raise desired saving only.
B) raise desired investment only.
C) raise both desired saving and desired investment.
D) raise desired saving, but lower desired investment.
10) In the saving—investment diagram, an increase in current output would
A) shift the saving curve to the left.
B) shift the investment demand curve to the left.
C) not shift the curves.
D) shift the saving curve to the right.
11) The saving—investment diagram shows that a higher real interest rate due to a leftward shift
of the saving curve
A) raises the profitability of investment for firms.
B) causes the amount of firms’ investment to increase.
C) increases the total amount of saving because of the increase in the real interest rate.
D) causes the total amounts of saving and investment to fall.
12) A temporary decrease in government purchases would cause
A) a rightward shift in the saving curve and a leftward shift in the investment curve.
B) a rightward shift in the saving curve and a rightward shift in the investment curve.
C) a rightward shift in the saving curve, but no shift in the investment curve.
D) no shift in the saving curve, but a leftward shift in the investment curve.
13) Any change in the economy that reduces desired national saving for a given value of the real
interest rate will shift the desired national saving curve to
A) the right and increase the real interest rate.
B) the right and decrease the real interest rate.
C) the left and increase the real interest rate.
D) the left and decrease the real interest rate.
14) A temporary supply shock, such as a one month decrease in oil prices, would
A) increase the marginal product of capital and increase desired investment, increasing the real
interest rate in equilibrium.
B) decrease the marginal product of capital and decrease desired investment, decreasing the real
interest rate in equilibrium.
C) have little or no effect on desired investment, thus not changing the real interest rate by much
in equilibrium.
D) increase both the marginal product of capital and the marginal product of labor in the long-
term future, thus raising the real interest rate in equilibrium.
15) If consumers foresee future taxes completely, a reduction in taxes this year that is
accompanied by an offsetting increase in future taxes would cause
A) a rightward shift in the saving curve and a rightward shift in the investment curve.
B) a shift in neither the saving nor the investment curve.
C) a leftward shift in the saving curve, but no shift in the investment curve.
D) no shift in the saving curve, but a rightward shift in the investment curve.
16) An invention that raises the future marginal product of capital (in a closed economy) would
cause an increase in desired investment, which would cause the investment curve to shift to the
________ and would cause the real interest rate to ________.
A) right; increase
B) right; decrease
C) left; increase
D) left; decrease
17) A temporary supply shock, such as a drought, would
A) increase the marginal product of capital and increase desired investment.
B) decrease the marginal product of capital and decrease desired investment.
C) have little or no effect on desired investment.
D) decrease both the marginal product of capital and the marginal product of labor in the long-
term future.
18) If the government reduces the effective tax rate on capital (in a closed economy), then the
real interest rate ________ and saving ________.
A) falls; declines
B) falls; increases
C) rises; increases
D) rises; declines
19) If the stock market booms and people feel wealthier (in a closed economy), then the real
interest rate ________ and investment ________.
A) falls; declines
B) falls; increases
C) rises; increases
D) rises; declines
20) Onerous regulations on businesses that take effect next year (in a closed economy)reduce
businesses’ expected future marginal product of capital. As a result, the real interest rate
________ and saving ________.
A) falls; declines
B) falls; increases
C) rises; increases
D) rises; declines
21) If consumers believe that next year a recession will occur (in a closed economy), then the
real interest rate ________ and investment ________.
A) falls; declines
B) falls; increases
C) rises; increases
D) rises; declines
22) Identify two variables that shift the desired investment curve. Is desired investment
negatively related or positively related to each of these variables?
23) What are the economic consequences of reductions in defense spending by the government?
What happens to national saving, the interest rate, and investment?
24) Use a saving—investment diagram to explain what happens to saving, investment, and the
real interest rate in each of the following scenarios in a closed economy.
(a) Current output rises due to a temporary productivity increase.
(b) The tax code changes so that business firms face higher tax rates on their revenue (offset by
other lump-sum tax changes so there’s no overall change in tax revenue).
(c) The government increases spending temporarily for a one-year project to turn mercury into
gold.
(d) The average educational level rises, inducing an increase in the future marginal productivity
of capital.
25) Use a saving—investment diagram to explain what happens to saving, investment, and the
real interest rate in each of the following scenarios in a closed economy.
(a) In an agricultural economy, great weather this year promises a bumper crop next year,
leading citizens to expect higher income next year.
(b) Government regulations going into effect next year will reduce the marginal product of
capital.
(c) The government increases lump-sum taxes on citizens.
26) An economy has full-employment output of 5000. Government purchases are 1000. Desired
consumption and desired investment are given by
Cd = 3000 – 2000r + 0.10Y
Id = 1000 – 4000r
where Y is output and r is the expected real interest rate.
(a) Find the real interest rate that clears the goods market. Assume that output equals full-
employment output.
(b) Calculate the amount of saving, investment, and consumption in equilibrium.
(c) If a shock to wealth causes desired consumption to decline by 200 (so that the new equation
for desired consumption is Cd = 2800 – 2000r + 0.10Y), find the equilibrium real interest rate,
saving, investment, and consumption.
4.4 A Formal Model of Consumption and Saving (Appendix 4.A)
1) David consumes 200 in the current period and 330 in the future period. The real interest rate is
10% per period. David’s present value of lifetime consumption is
A) 500.
B) 530.
C) 550.
D) 563.
2) David consumes 140 in the current period and 220 in the future period. David’s present value
of lifetime consumption is 340. The real interest rate is
A) 0%.
B) 5%.
C) 10%.
D) 20%.
3) David consumes 140 in the current period and 210 in the future period. The real interest rate is
5% per period. David’s present value of lifetime consumption is
A) 210.
B) 340.
C) 350.
D) 400.
4) Rachel earns nothing during her learning period, 1100 during her working period, and nothing
during her retirement period. She has initial assets of 300. The real interest rate is zero. Rachel is
not allowed to borrow by the banks. Whenever possible, Rachel wants to smooth consumption
between periods. How much will she save during her working period?
A) 400
B) 550
C) 700
D) 950
5) A curve that connects all the consumption combinations that yield the same level of utility is
known as
A) an isoquant.
B) a yield curve.
C) a budget line.
D) an indifference curve.
6) If Claudette gets a permanent increase in her income of $1000 per year, she saves an extra
$200 this year and consumes an extra $800 this year. If the increase in income had been
temporary instead of permanent, she would have saved ________ of the extra income.
A) More than $200
B) Less than $200
C) Exactly $200
D) None
7) Suppose the government provides a tax cut today that is matched by a tax increase in the
future that’s equal in present value to the tax cut. This causes a consumer’s saving to
A) decrease.
B) increase.
C) remain unchanged.
D) increase if the person was a lender and decrease if the person was a borrower.
8) The substitution effect of a decrease in real interest rates is to cause a consumer to
A) increase future consumption and decrease current consumption.
B) decrease future consumption and increase current consumption.
C) increase current consumption and increase saving.
D) decrease current consumption and increase saving.
9) For a borrower, an increase in the real interest rate will lead to
A) higher current consumption and less borrowing.
B) higher current consumption and less saving.
C) lower current consumption and less borrowing.
D) lower current consumption and less saving.
10) How would each of the following affect Cheryl Shirker’s current consumption and saving?
Cheryl is a forward-looking consumer with no borrowing constraints.
(a) Cheryl’s firm announces a reorganization plan, increasing Cheryl’s future income
dramatically.
(b) Cheryl’s father, who had planned to leave her a large bequest, must spend all his wealth on
medical bills after a prolonged illness.
(c) The real interest rate rises from its original level. Cheryl originally planned to have no assets
for the future; that is, she planned to spend all her original assets and all her income when she
was young, and planned to consume an amount equal to her future income when she was old.
11) Suppose you divide your life into two periods: working age and retirement age. When you
work, you earn labor income Y; when retired, you earn no labor income, but must live off your
savings and the interest it earns. You have no initial assets. You save the amount S while
working, earning interest at rate r, so you have (1 + r)S to live on when retired. Because you
don’t need to consume as much when retired, you want to set consumption when working twice
as high as consumption when retired.
(a) Suppose you earn $1 million over your working life, and the real interest rate for retirement
saving is 50%. How much will you save, and how much will you consume in each part of your
life?
(b) Suppose your current income went up to $2 million when working. Now what will you save
and how much will you consume each period?
(c) Suppose a social security system will pay you 25% of your working income when you are
retired. Now (with Y = $1 million as in part (a) how much will you save and how much will you
consume each period?
(d) Suppose the interest rate rises. Will you save more or less?