
123. In Operation Desert Storm, oil facilities in Iraq were attacked amid strong demand for oil.
In response, political pressure motivated OPEC to increase the daily quota by 2 million barrels a
day. Assuming demand did not change, which of the following series of prices most likely
matches how the price of a barrel of oil changed from (1) before the attack, to (2) just after the
attack, to (3) after OPEC increased the quota?
A. $42, $38, $40
B. $38, $40, $42
C. $42, $40, $38
D. $40, $42, $38
124. The model of supply and demand leads to the prediction that high interest rates cause:
A. an increase in the price of housing and a decrease in the number of homes purchased.
B. a decrease in the price of housing and an increase in the number of homes purchased.
C. an increase in both housing prices and the number of homes purchased.
D. a decrease in both housing prices and the number of homes purchased.
125. When the drug Vioxx was pulled from the market by pharmaceutical company Merck due
to its association with heart problems, the demand for other pain medications:
A. increased, putting upward pressure on their price.
B. increased, putting downward pressure on their price.
C. decreased, putting upward pressure on their price.
D. decreased, putting downward pressure on their price.
Bloom’s: Learning Objective: Bloom’s: Learning Objective: 126. The price of a ticket to the
Maroon 5 concert is set at $35. All the tickets for the concert sell out one hour after they go on
sale and there are still 1,000 fans who want to buy tickets. It follows that:
A. the equilibrium price of tickets to the concert is $35.
B. the equilibrium price of tickets to the concert is more than $35.
C. the equilibrium price of tickets to the concert is less than $35.
D. the quantity of tickets demanded is equal to the quantity supplied at the $35 price.
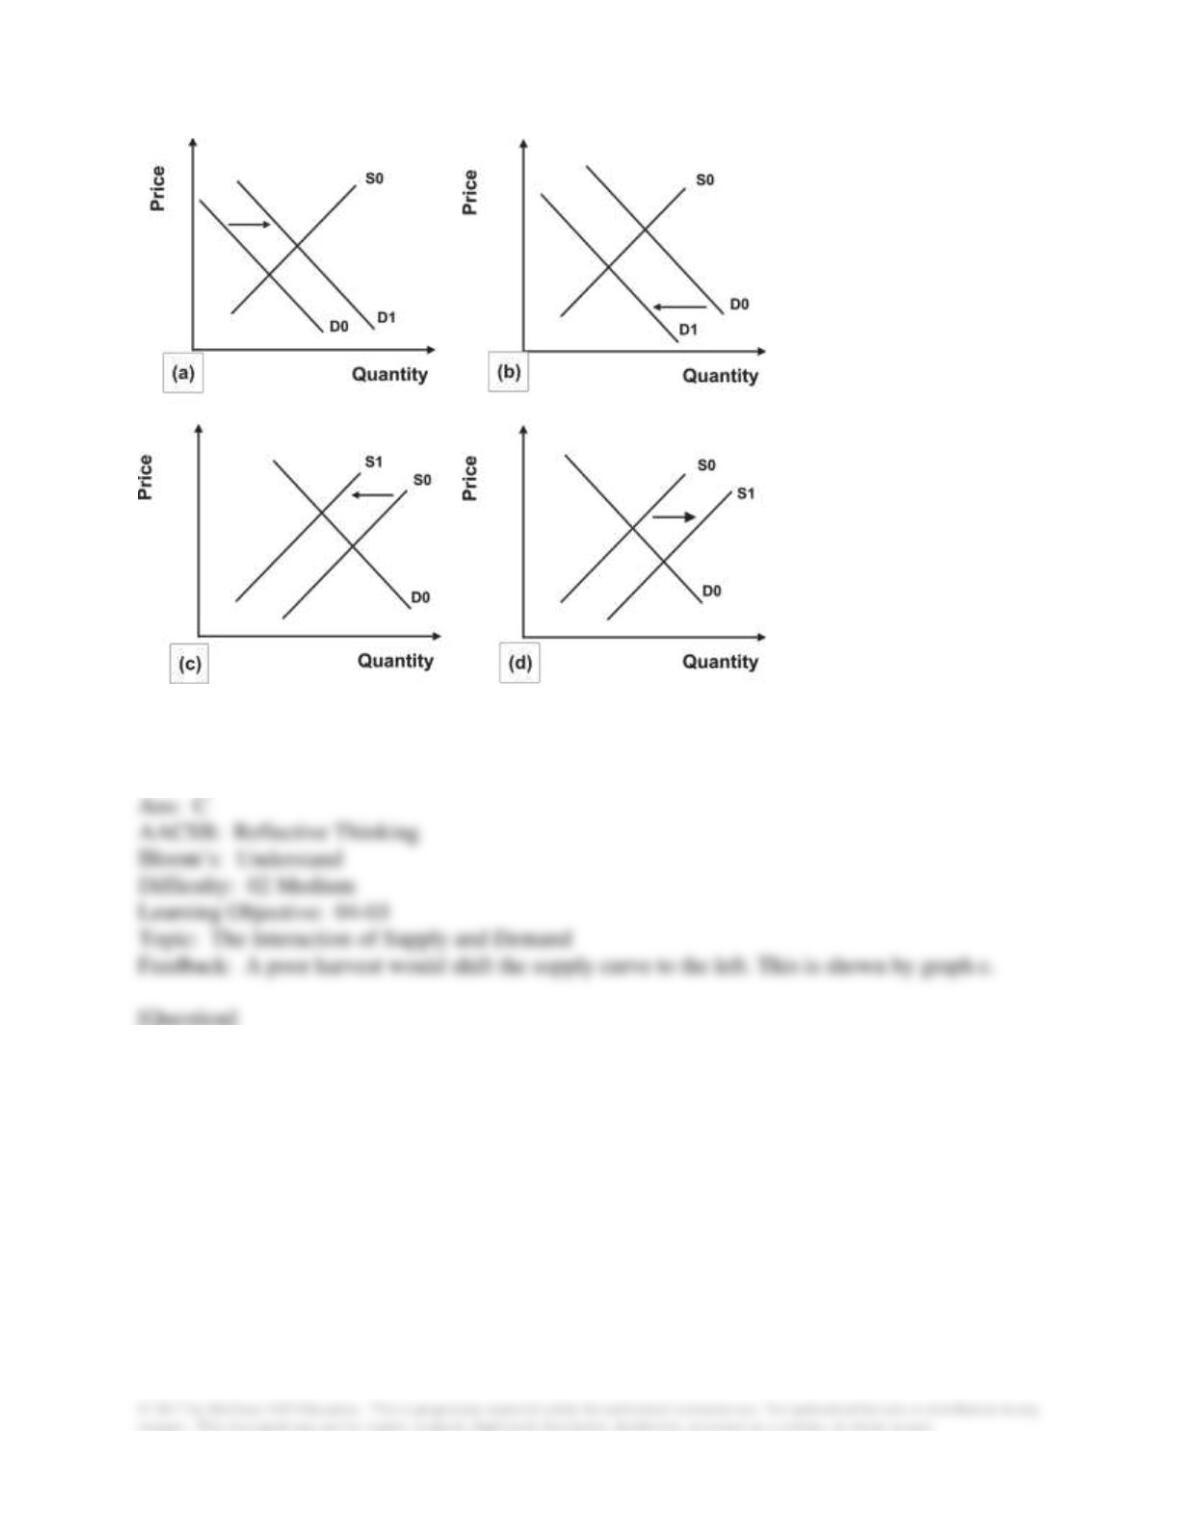
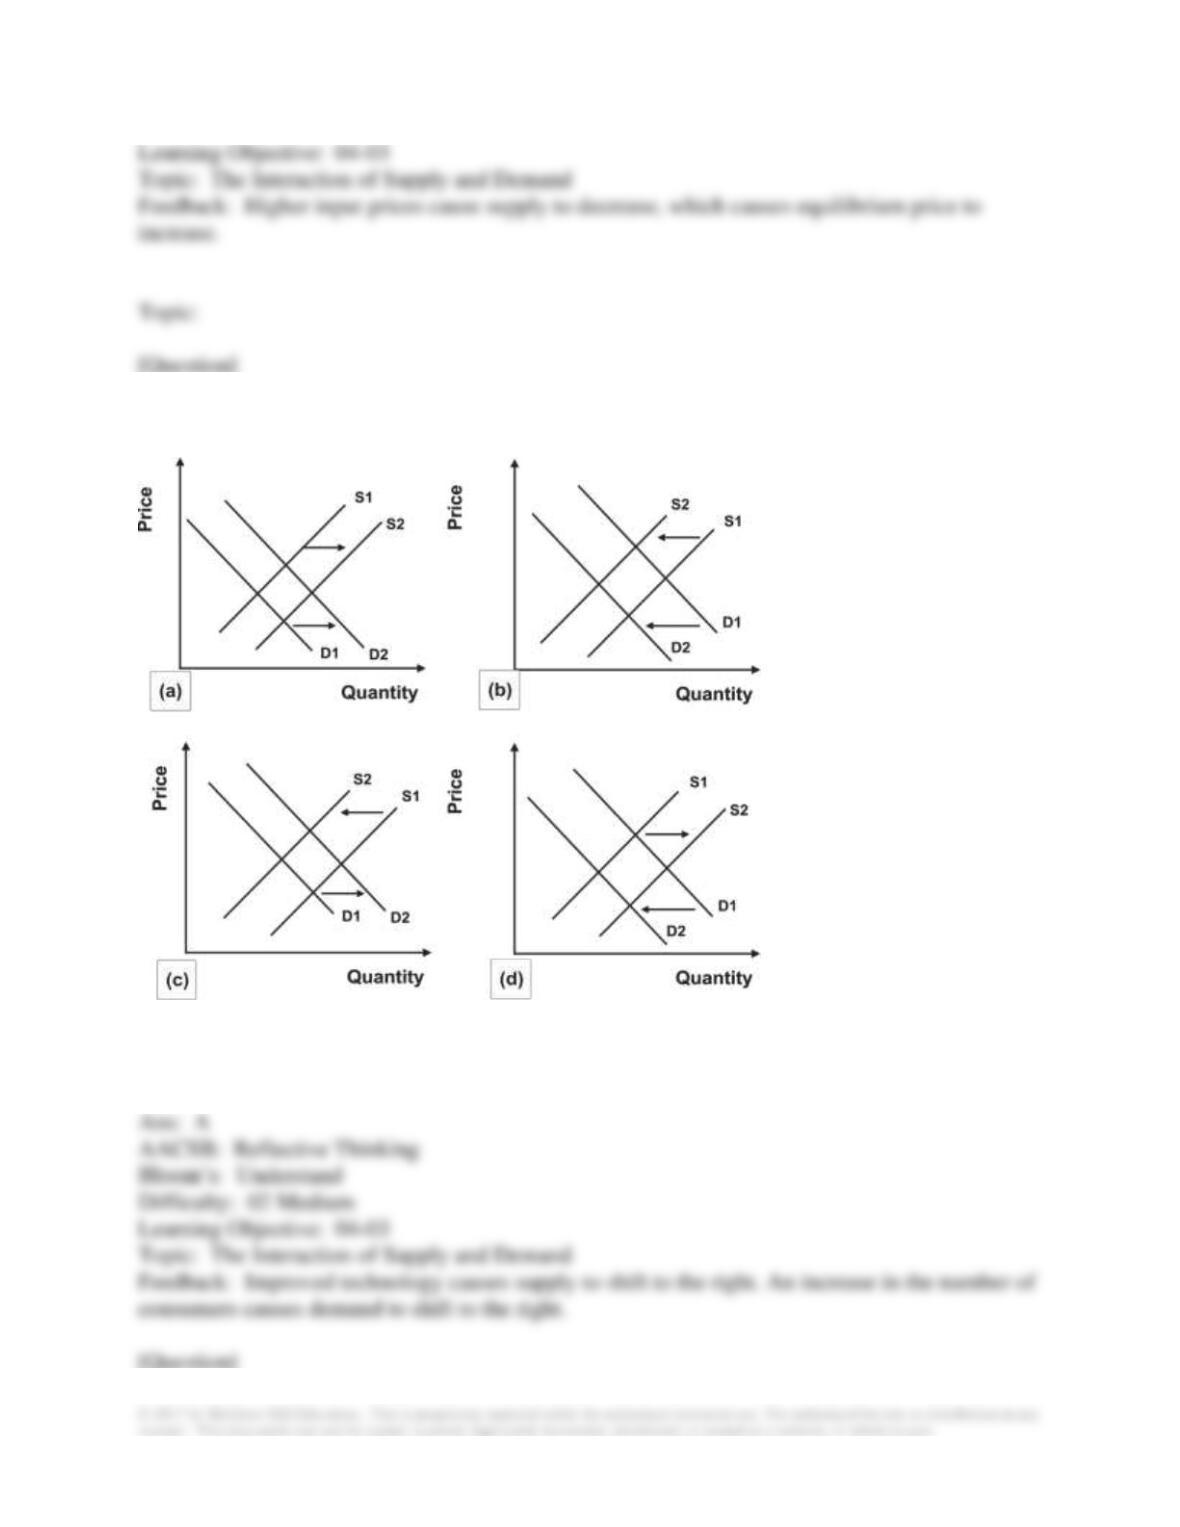
127. Refer to the graphs shown. The relevant market is corn. The impact of a poor corn harvest
on the market for corn would most likely be demonstrated by which graph?
A. a
B. b
C. c
D. d
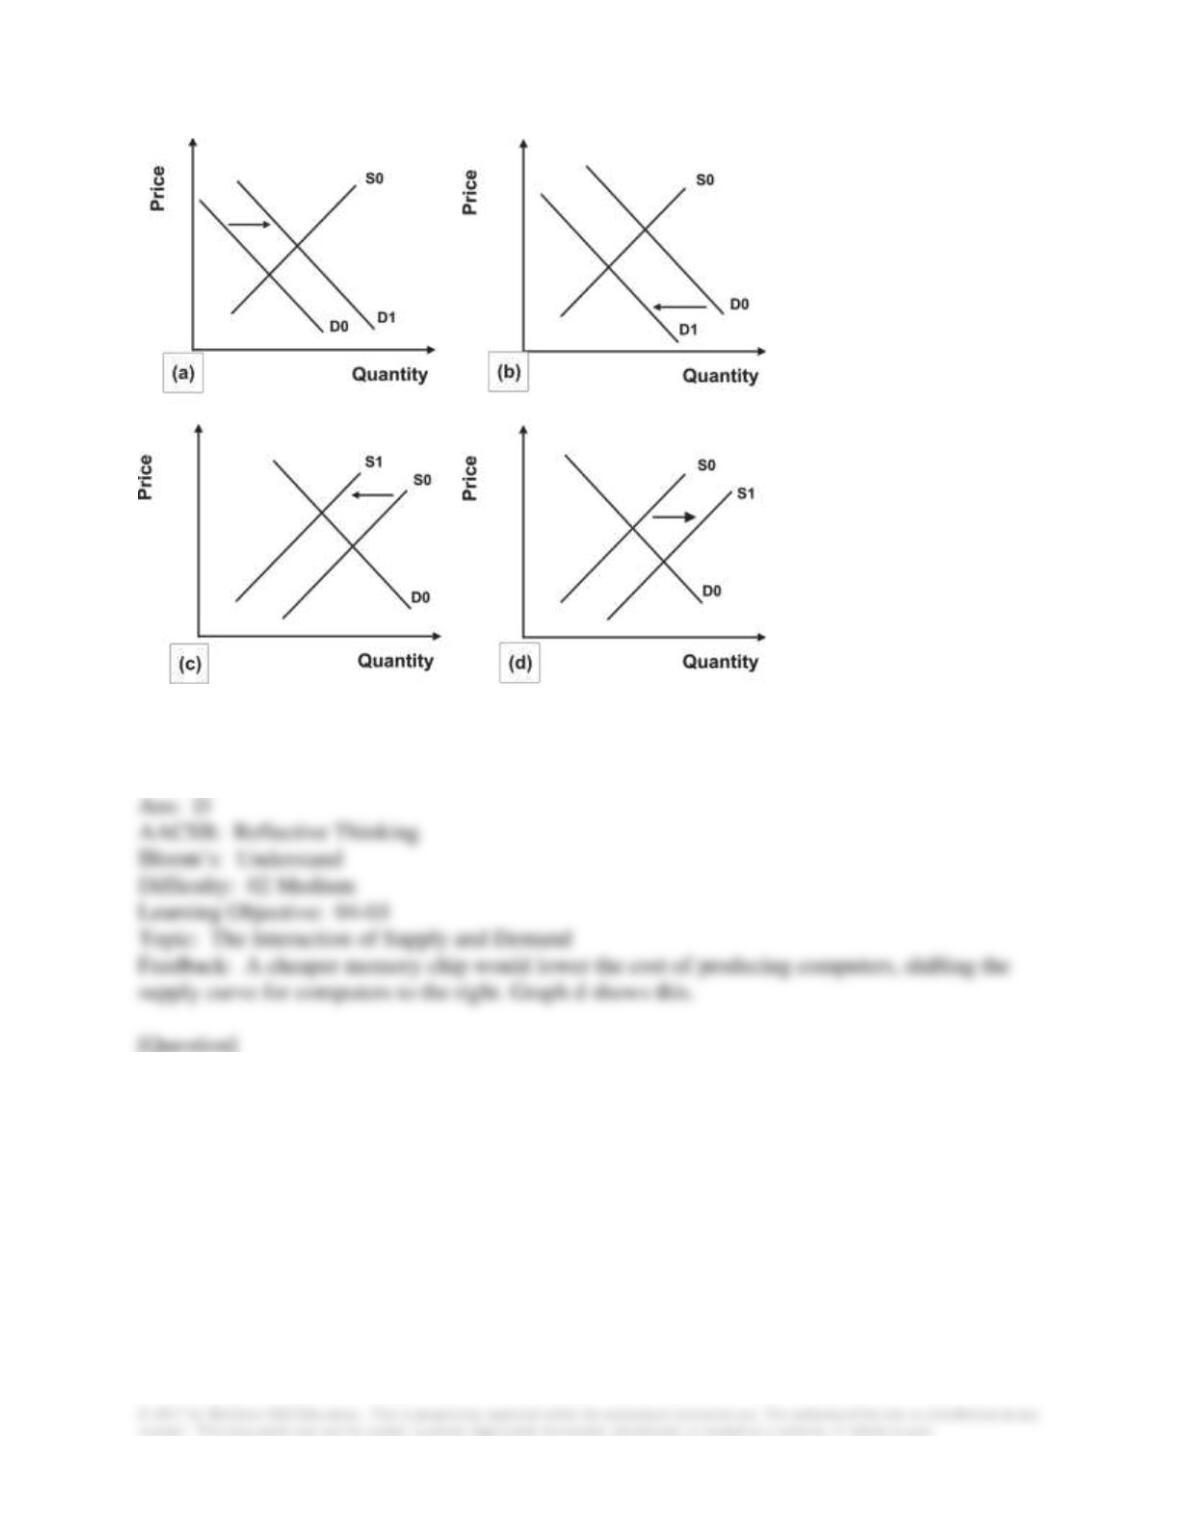
128. Refer to the graphs shown. The market is computers. Which graph best represents the
impact of cheaper memory chips on the computer market?
A. a
B. b
C. c
D. d
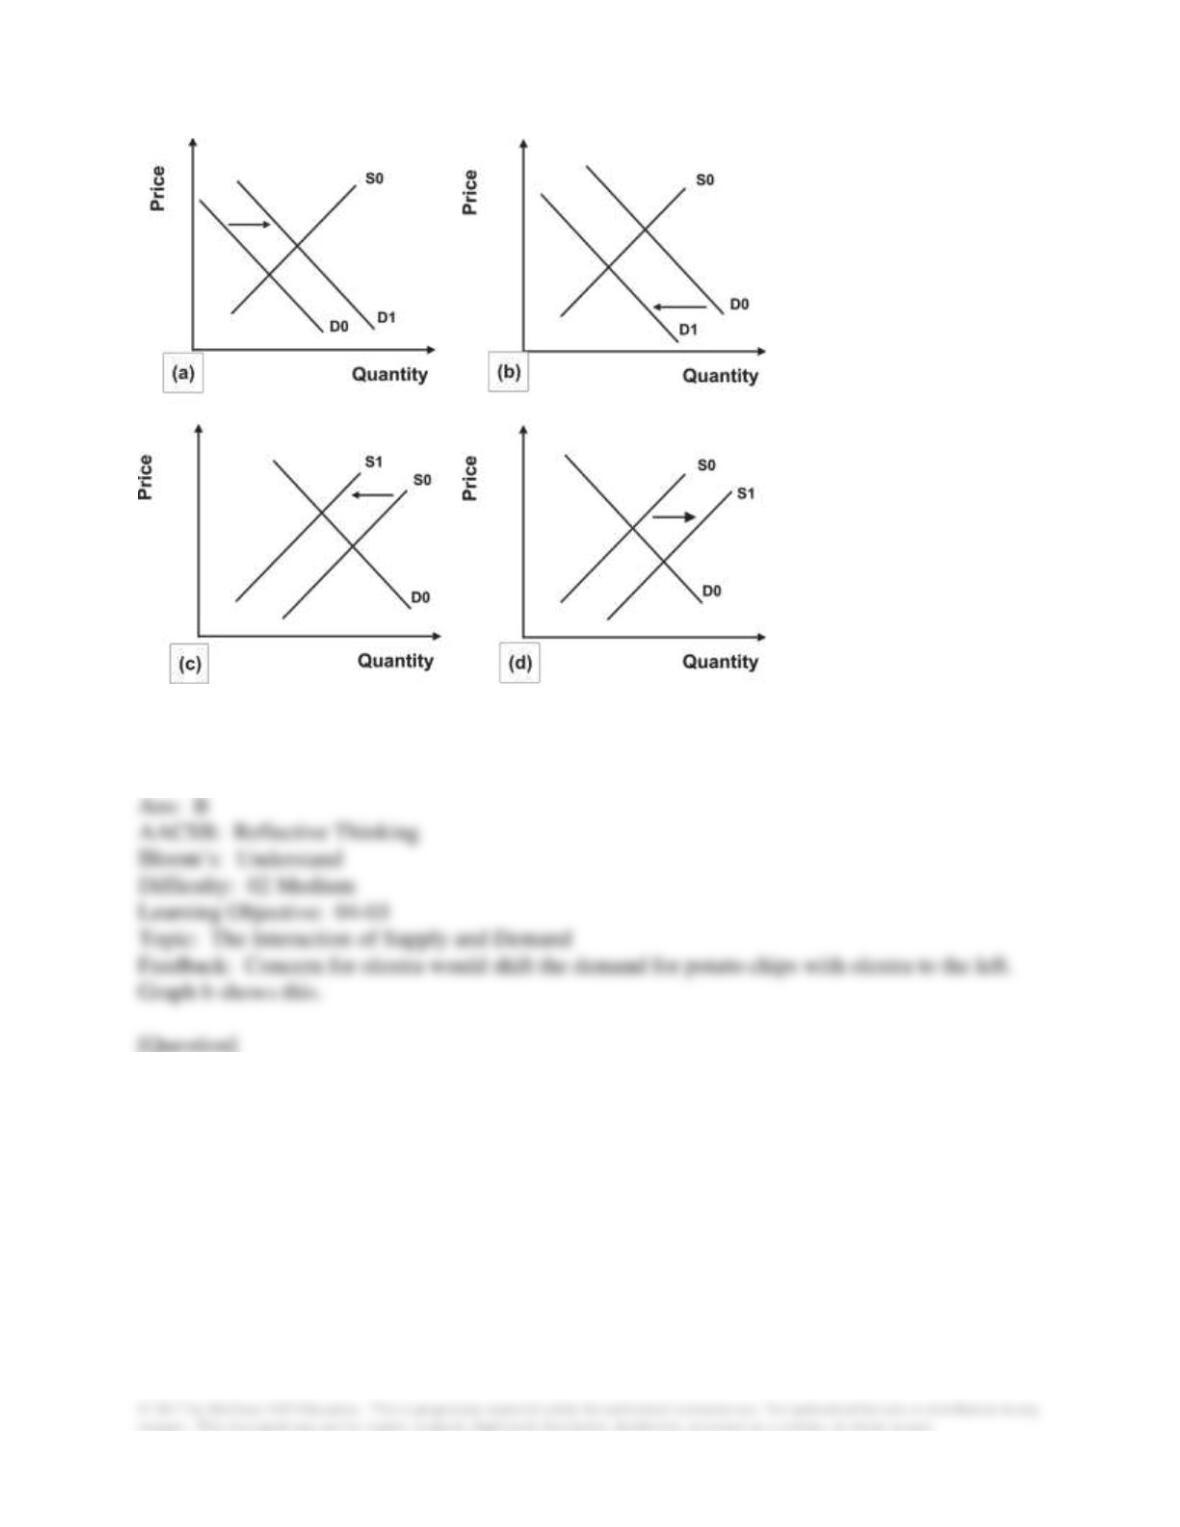
129. Refer to the graphs shown. The market is fat-free potato chips that contain olestra. Which
graph best represents the impact of increased consumer concern about the effects of olestra on
long-term health?
A. a
B. b
C. c
D. d
130. Refer to the graphs shown. The market is caviar. Which graph best represents the impact of
an increase in consumer incomes on the market for caviar?
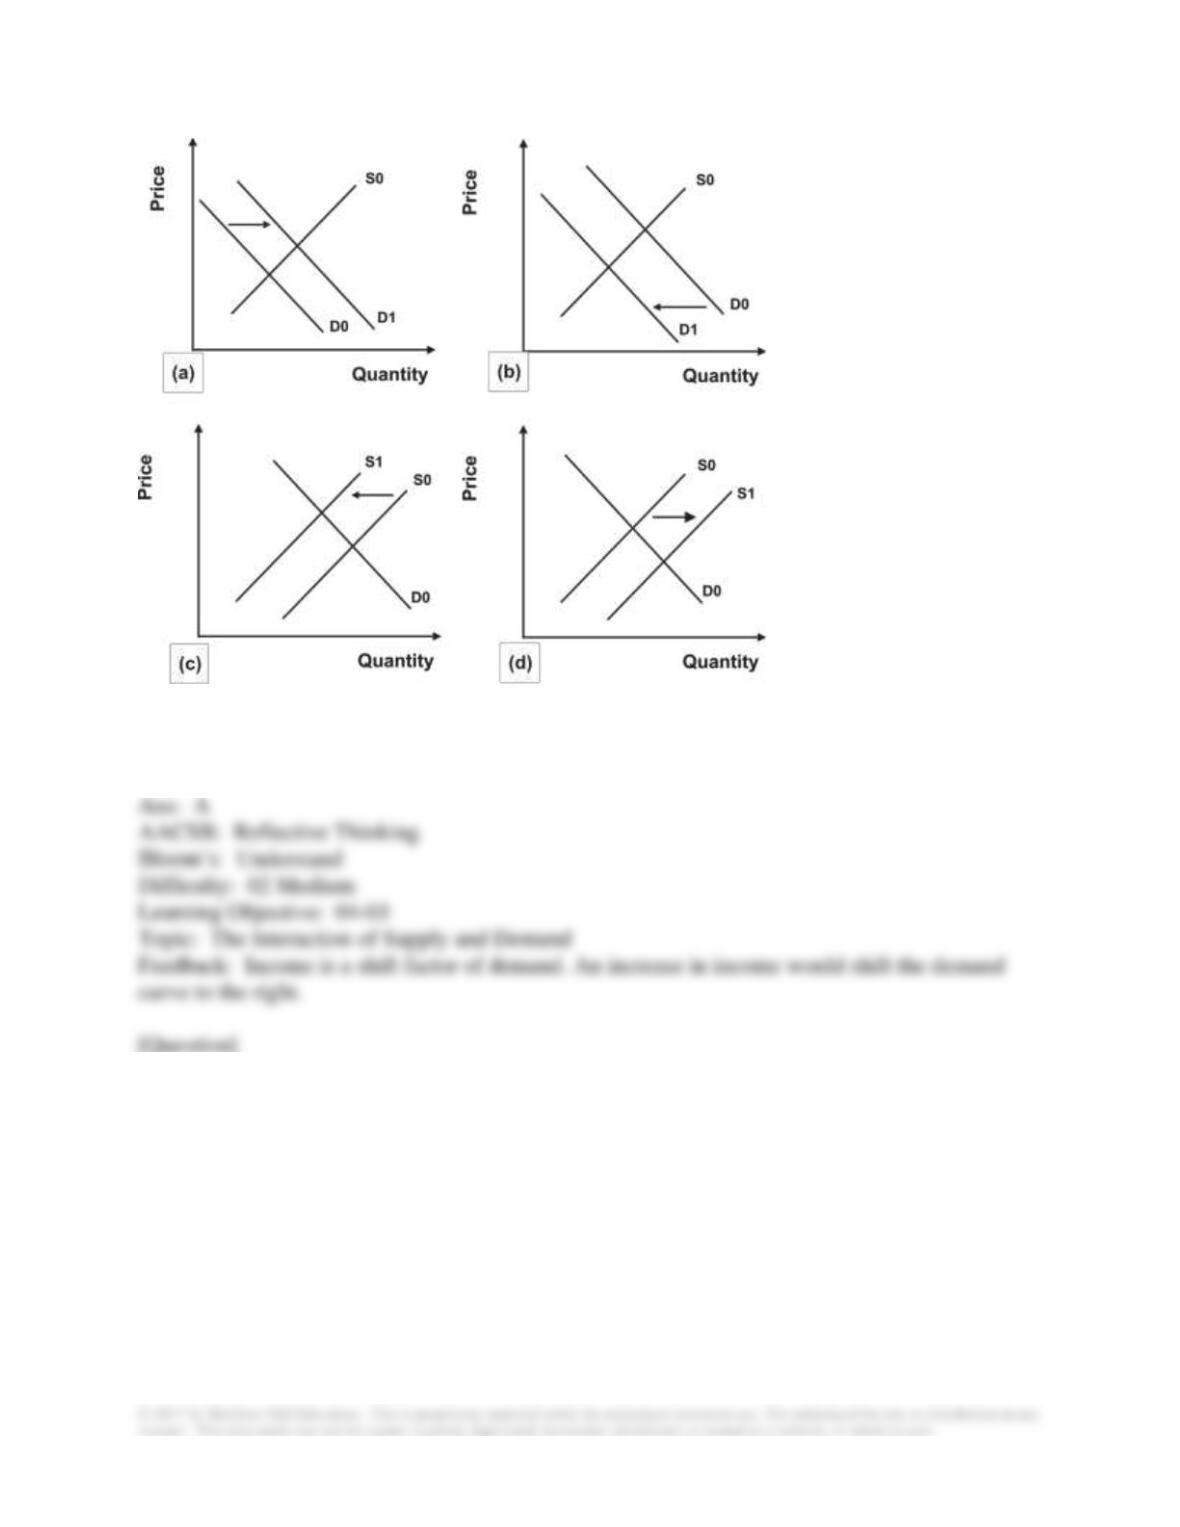
A. a
B. b
C. c
D. d
131. Refer to the graphs shown. The market is salmon steaks. Which graph best represents the
impact of increased concern that salmon is becoming endangered?
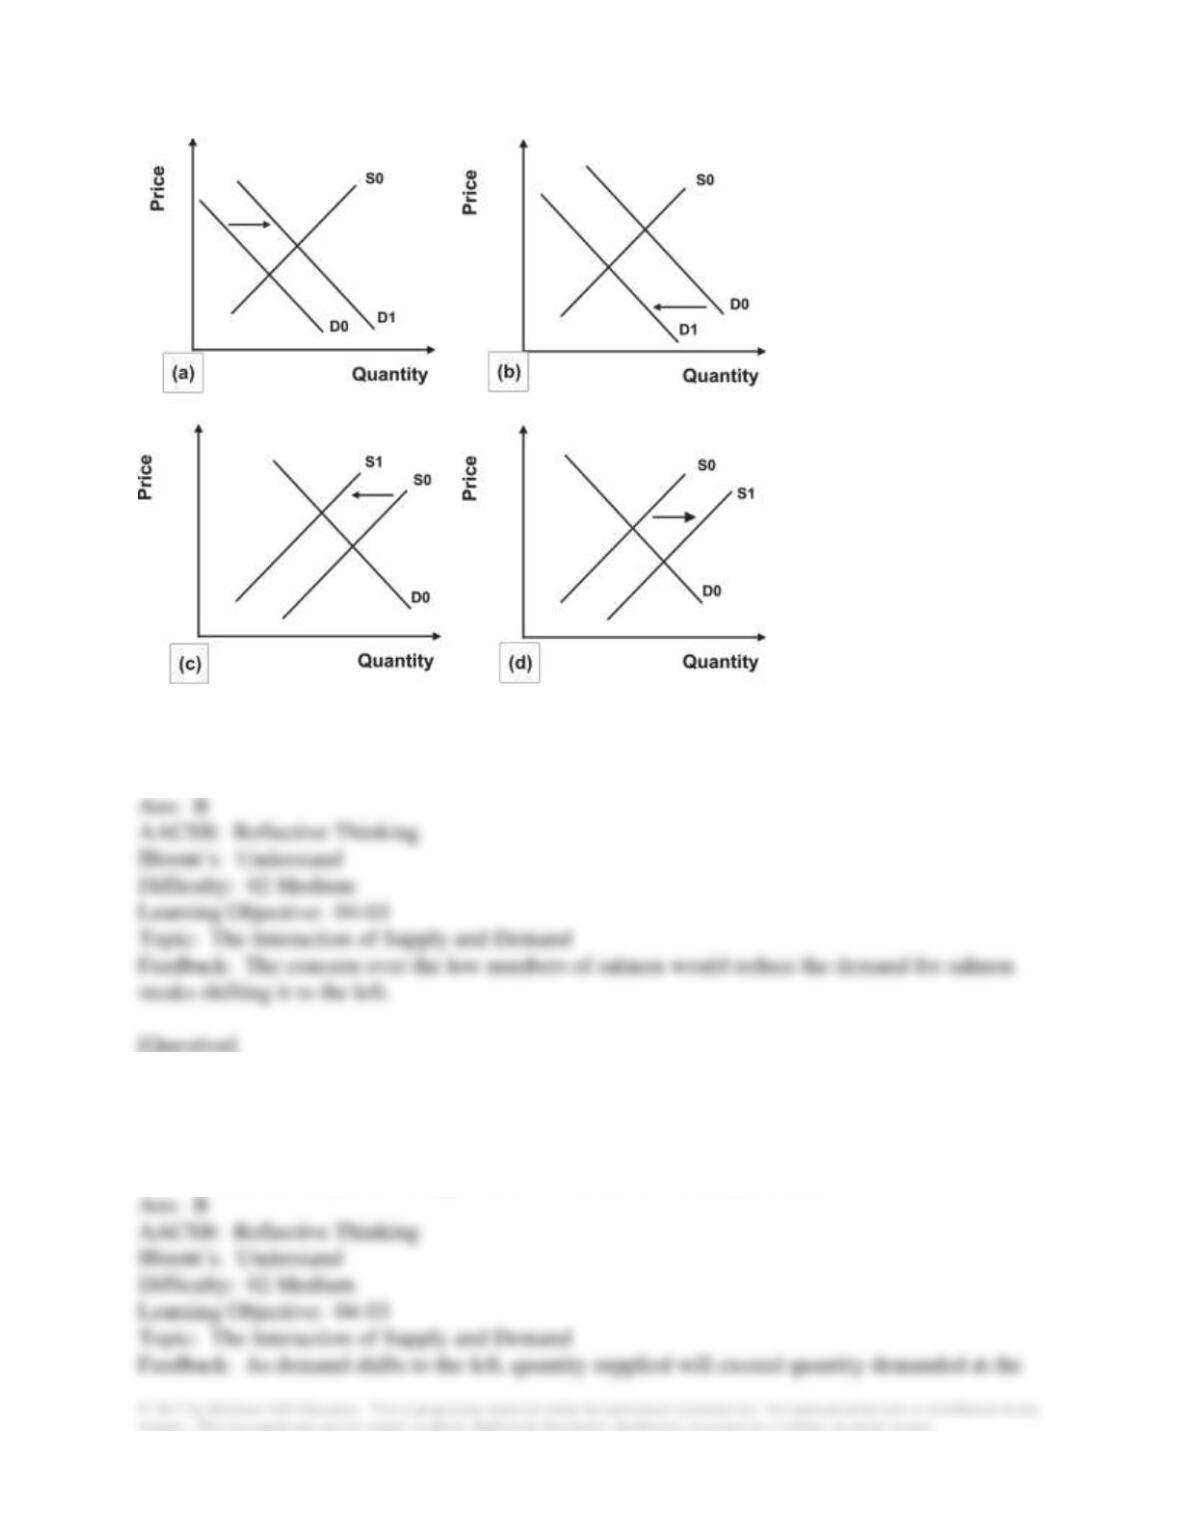
A. a
B. b
C. c
D. d
132. A decrease in the number of consumers in a market causes market demand to:
A. decrease, resulting in a surplus which will be eliminated as price rises.
B. decrease, resulting in a surplus which will be eliminated as price falls.
C. increase, resulting in a shortage which will be eliminated as price rises.
D. increase, resulting in a shortage which will be eliminated as price falls.
133. If supply and demand both shift to the right, equilibrium quantity:
A. rises, but the equilibrium price may rise, fall, or stay the same.
B. falls, but the equilibrium price may rise, fall, or stay the same.
C. may rise, fall, or stay the same, but equilibrium price will rise.
D. may rise, fall, or stay the same, but equilibrium price will fall.
134. If market supply increases, equilibrium price will:
A. fall and demand will shift to the right.
B. fall, causing a movement along the demand curve.
C. rise and demand will shift to the left.
D. rise, causing a movement along the demand curve.
135. An increase in equilibrium price and a decrease in equilibrium quantity is most likely the
result of:
A. an increase in demand.
B. a decrease in demand.
C. an increase in supply.
D. a decrease in supply.
136. If both buyers and sellers expect the price of a commodity to rise in the future, it is likely
that equilibrium:
A. price will fall with little change in equilibrium quantity.
B. price will rise with little change in equilibrium quantity.
C. quantity will fall with little change in equilibrium price.
D. quantity will rise with little change in equilibrium price.
137. Honey and jam are substitute products. If the price of honey increases, the demand for:
A. honey will increase.
B. honey will decrease, causing its price to fall.
C. jam will increase, causing the price of jam to increase as well.
D. jam will decrease, causing the price of jam to fall.
138. When workers are paid higher wages, production costs:
A. rise, supply shifts leftward, and product prices fall.
B. fall, supply shifts rightward, and product prices fall.
C. rise, supply shifts leftward, and product prices rise.
D. rise, supply shifts rightward, and product prices rise.
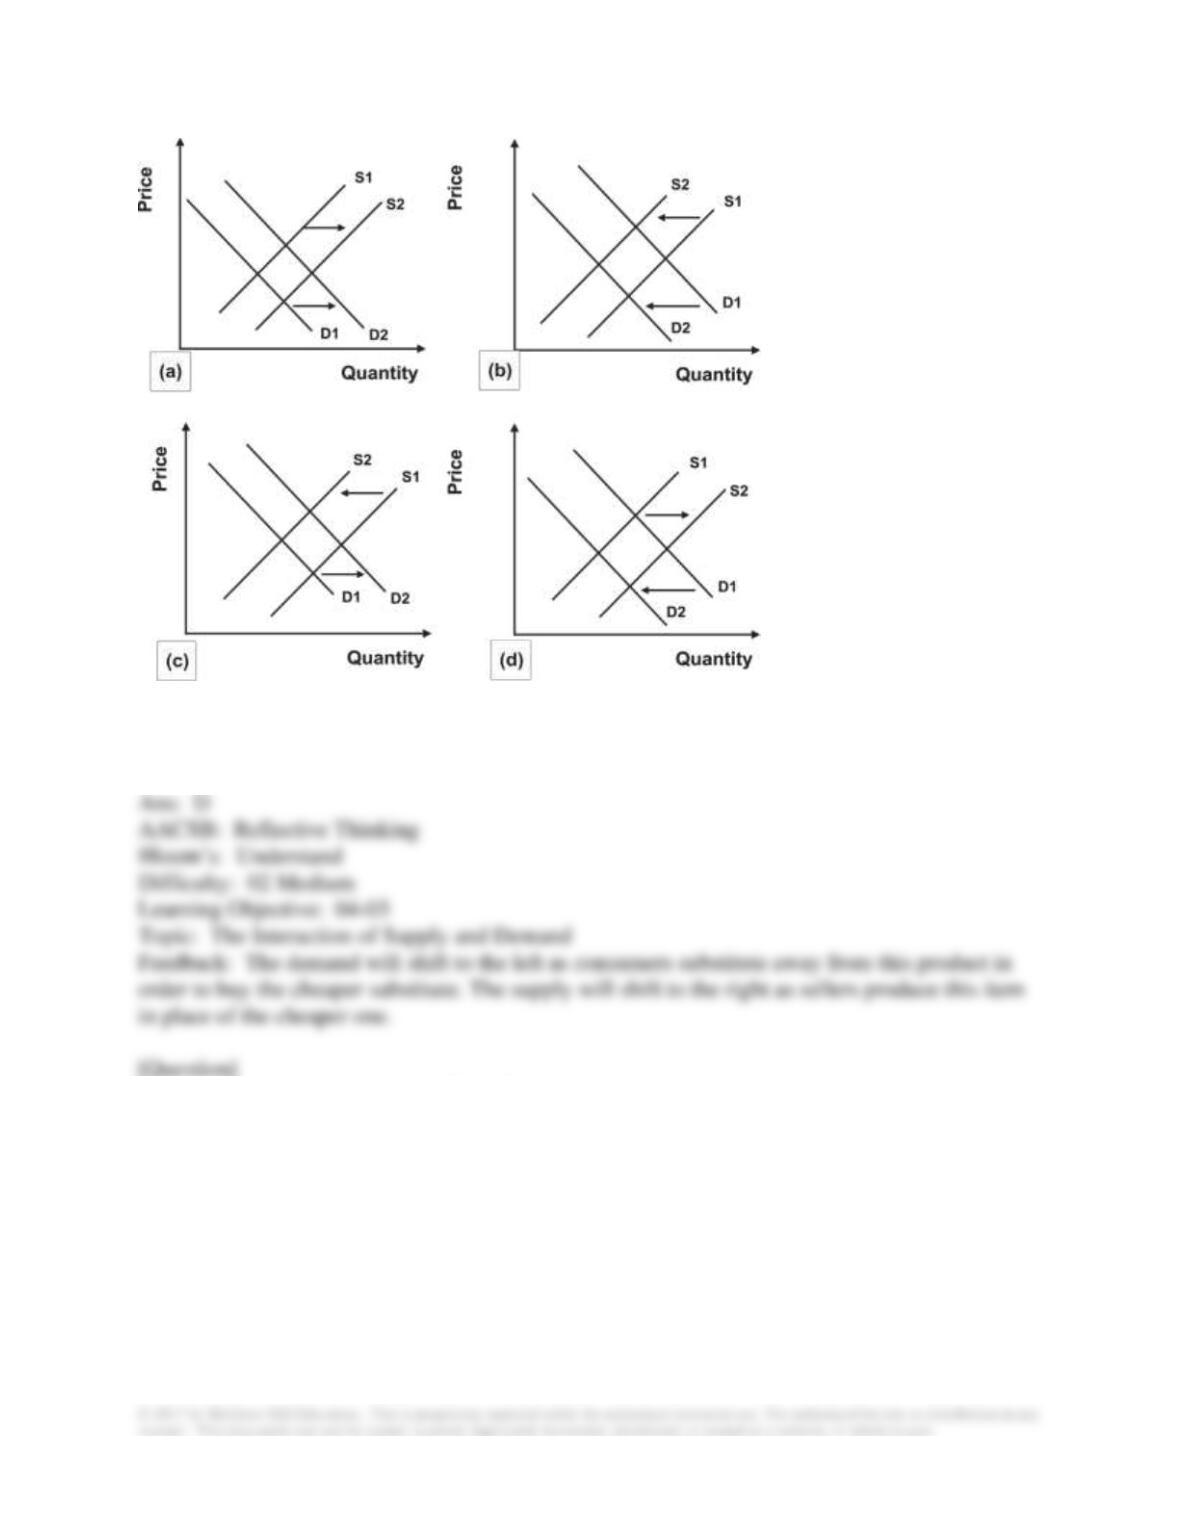
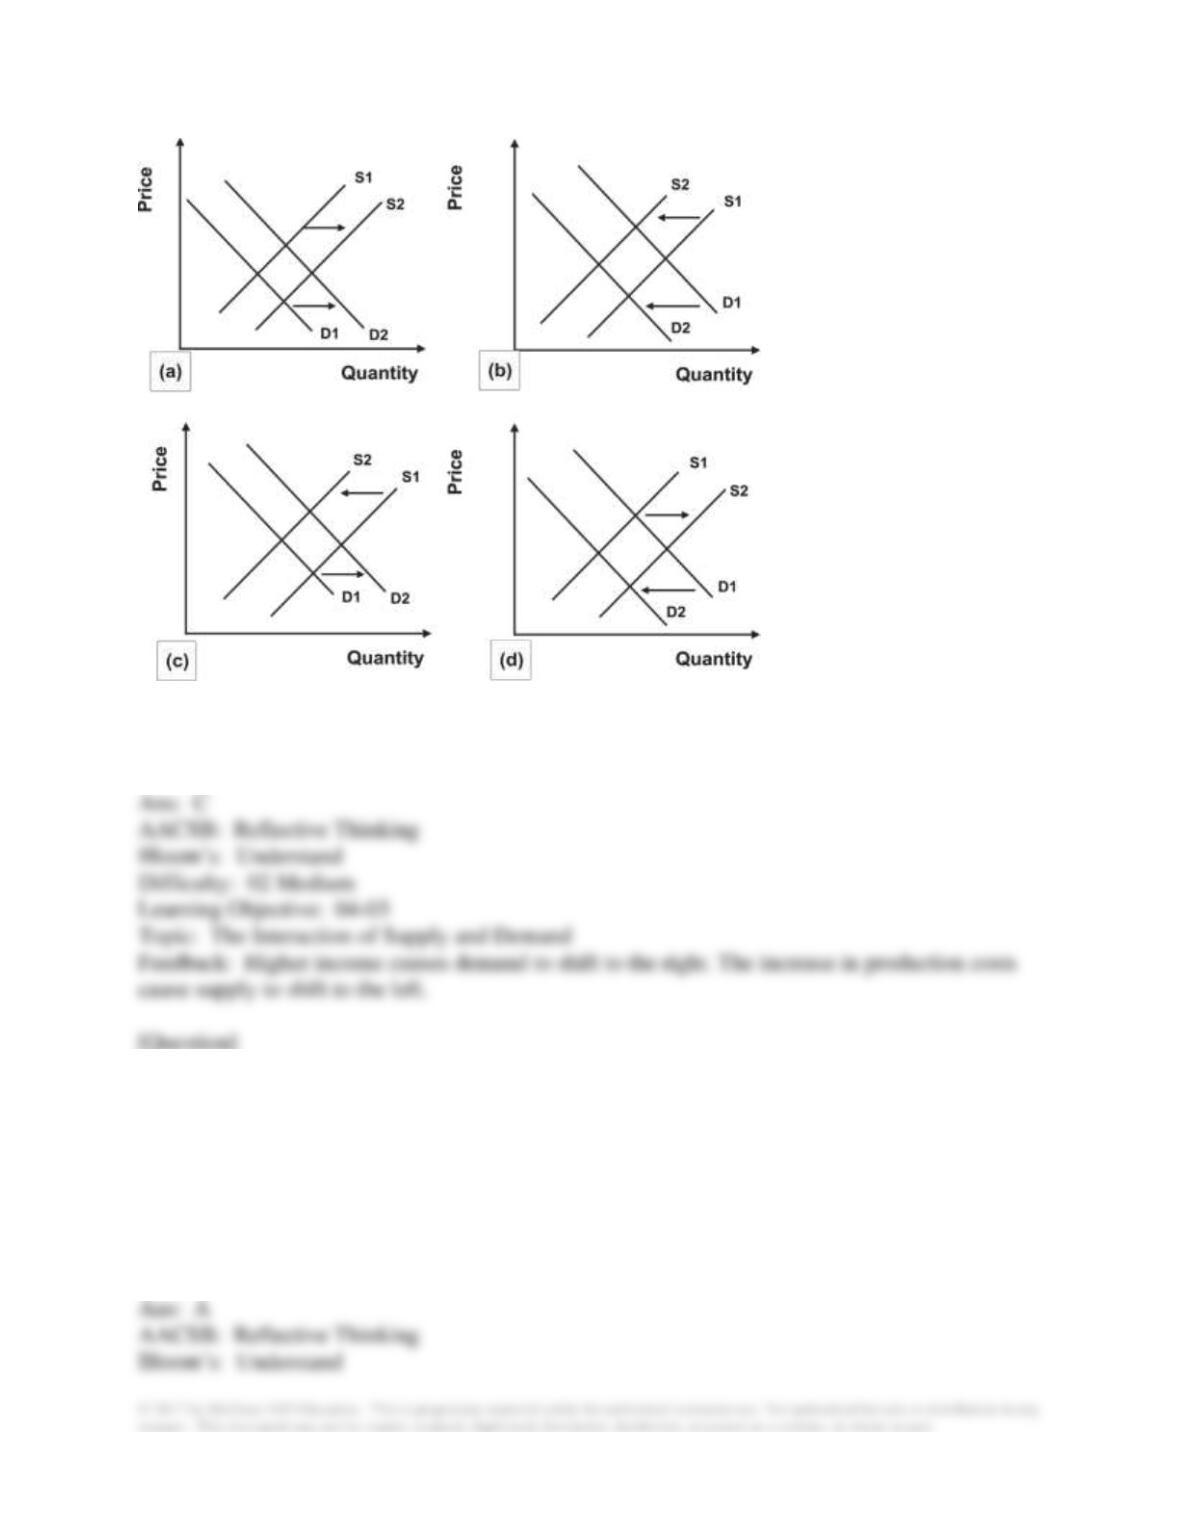
139. Refer to the graphs shown. The consequences of improved technology combined with an
increase in the number of consumers can best be illustrated by:
A. a.
B. b.
C. c.
D. d.
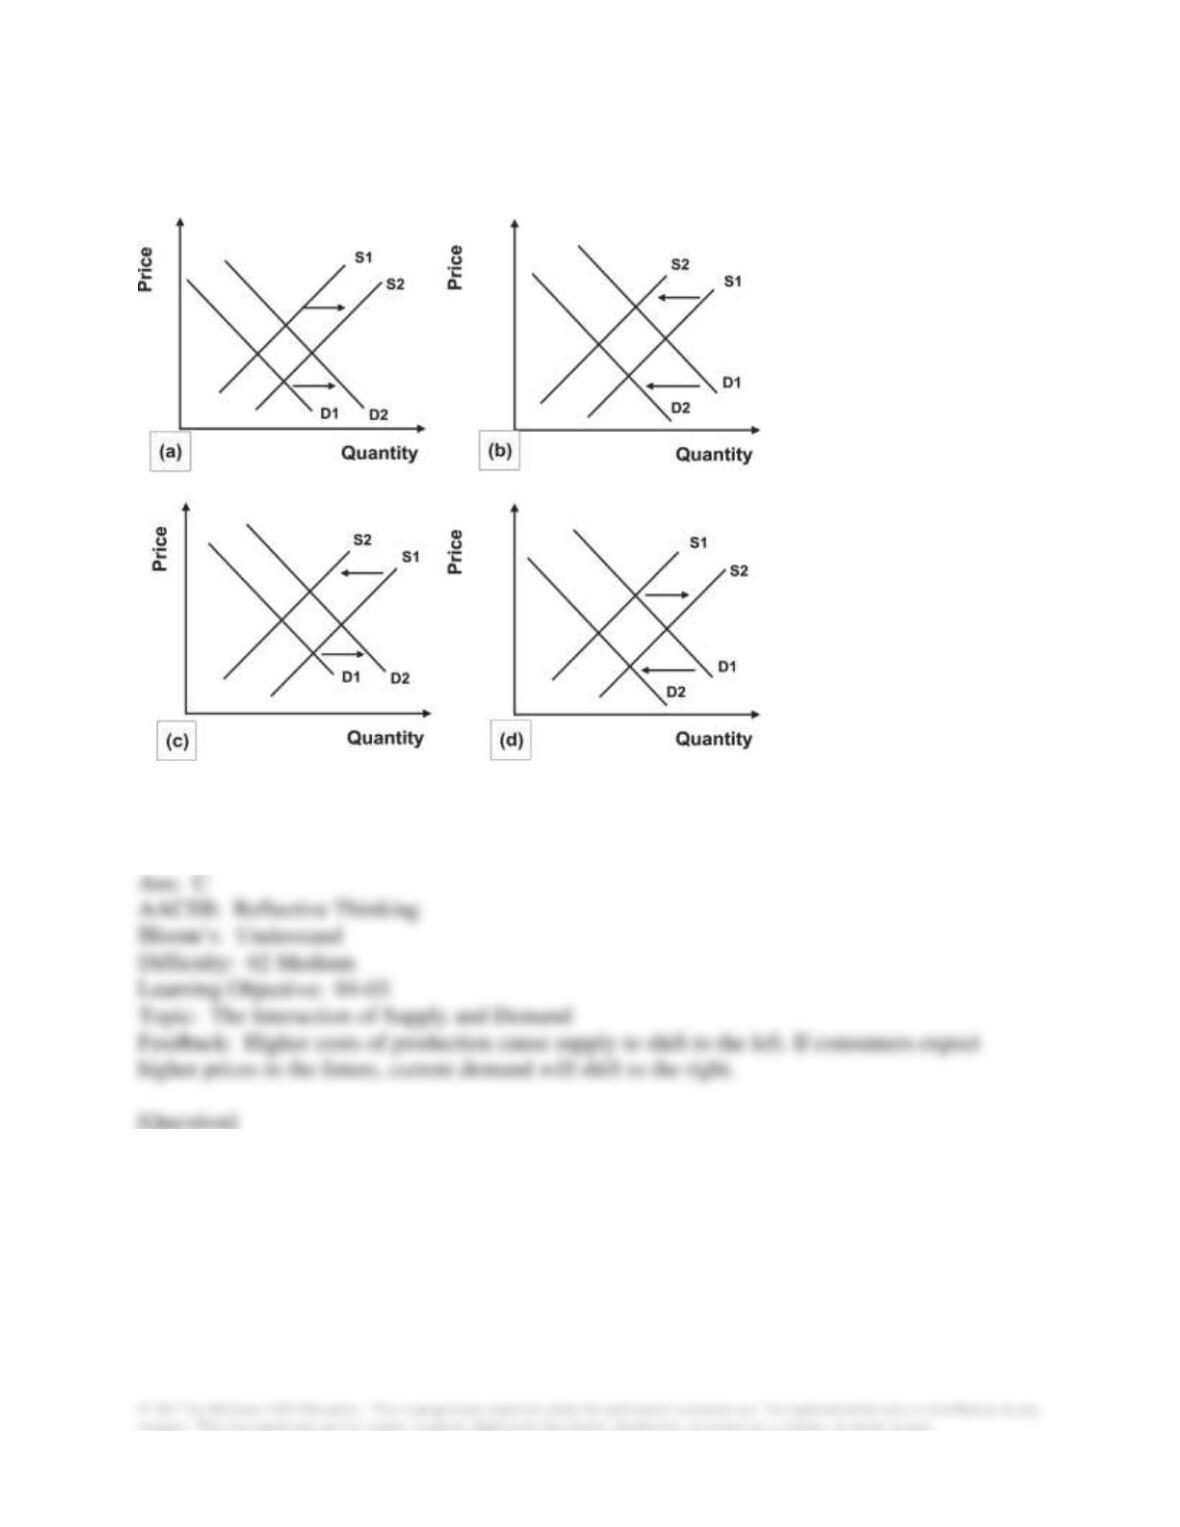
140. Refer to the graphs shown. Higher costs of production combined with an expectation on the
part of consumers of higher prices in the future would result in the shifts depicted in:
A. a.
B. b.
C. c.
D. d.
141. Refer to the graphs shown. Suppose the price of a good that is a substitute in both
consumption and production for the good depicted in the graph falls. The expected shifts in
supply and demand are shown in:
A. a.
B. b.
C. c.
D. d.
142. Refer to the graphs shown. The effect of increased consumer income and higher production
costs on a normal good is most likely shown in:
A. a.
B. b.
C. c.
D. d.
143. People have become more concerned about the negative health effects of eating
carbohydrates and fat. Considering these effects only, which of the following best describes the
likely effect of this trend on the market for high-carb, high-fat snacks?
A. Demand shifted to the left leading to a decline in equilibrium price and quantity.
B. Quantity demanded fell leading to a decline in equilibrium price and quantity.
C. Supply shifted to the left leading to a rise in equilibrium price and a decline in equilibrium
quantity.
D. Demand and supply both shifted to the left leading to a decline in equilibrium price and
quantity.
144. How would a decline in demand for imported commodities by the Chinese affect the
market for cargo transportation to China?
A. Supply of cargo transportation shifts to the right causing an increase in quantity demanded
and decline in equilibrium price.
B. Supply of cargo transportation shifts to the right causing an increase in demand and
equilibrium quantity and a decrease in equilibrium price.
C. Demand for cargo transportation shifts to the left causing a decline in quantity supplied and
price.
D. Demand for cargo transportation shifts to the left causing a decline in supply and equilibrium
quantity and price.
145. When airlines were deregulated, airfares declined by 30 percent. Deregulation is an
example of political forces:
A. letting the market move toward equilibrium, reducing excess supply.
B. letting the market move toward equilibrium, reducing excess demand.
C. making the market move away from equilibrium, creating excess supply.
D. making the market move away from equilibrium, creating excess demand.
146. The false assumption that what is true for a part will also be true for the whole is called the:
A. fallacy of composition.
B. paradox of thrift.
C. post hoc fallacy.
D. ceteris paribus assumption.
147. The fallacy of composition refers to the false assumption:
A. that if A happens before B, then A caused B.
B. that what is true for a part will also be true for the whole.
C. that what is true for the whole must also be true for a part.
D. of all other things held constant.
148. The statement, “Assuming that if it is rational for one person to stand at a football game to
get a better view then it is rational for everyone to stand at a football game to get a better view”
is an example of:
A. economic reasoning.
B. the fallacy of division.
C. the fallacy of composition.
D. the ceteris paribus assumption.
149. One reason economists distinguish between micro and macro is supply and demand are:
A. unrelated to one another.
B. more interdependent in the aggregate (macro).
C. more interdependent in individual markets (micro).
D. never interdependent.
150. For which of the following markets would the fallacy of composition most likely apply?
A. Labor market
B. Orange market in Florida
C. Gasoline market
D. Poultry market
151. For which of the following markets would the fallacy of composition least likely apply?
A. Labor market
B. Market for savings and investment
C. World market for oil
D. Poultry market