11. Refer to the accompanying table.
Price Quantity of Televisions
(Y = 20,000) Quantity of Televisions
(Y = 30,000)
$350 250 375
$450 200 325
$550 150 275
$650 100 225
$750 50 175
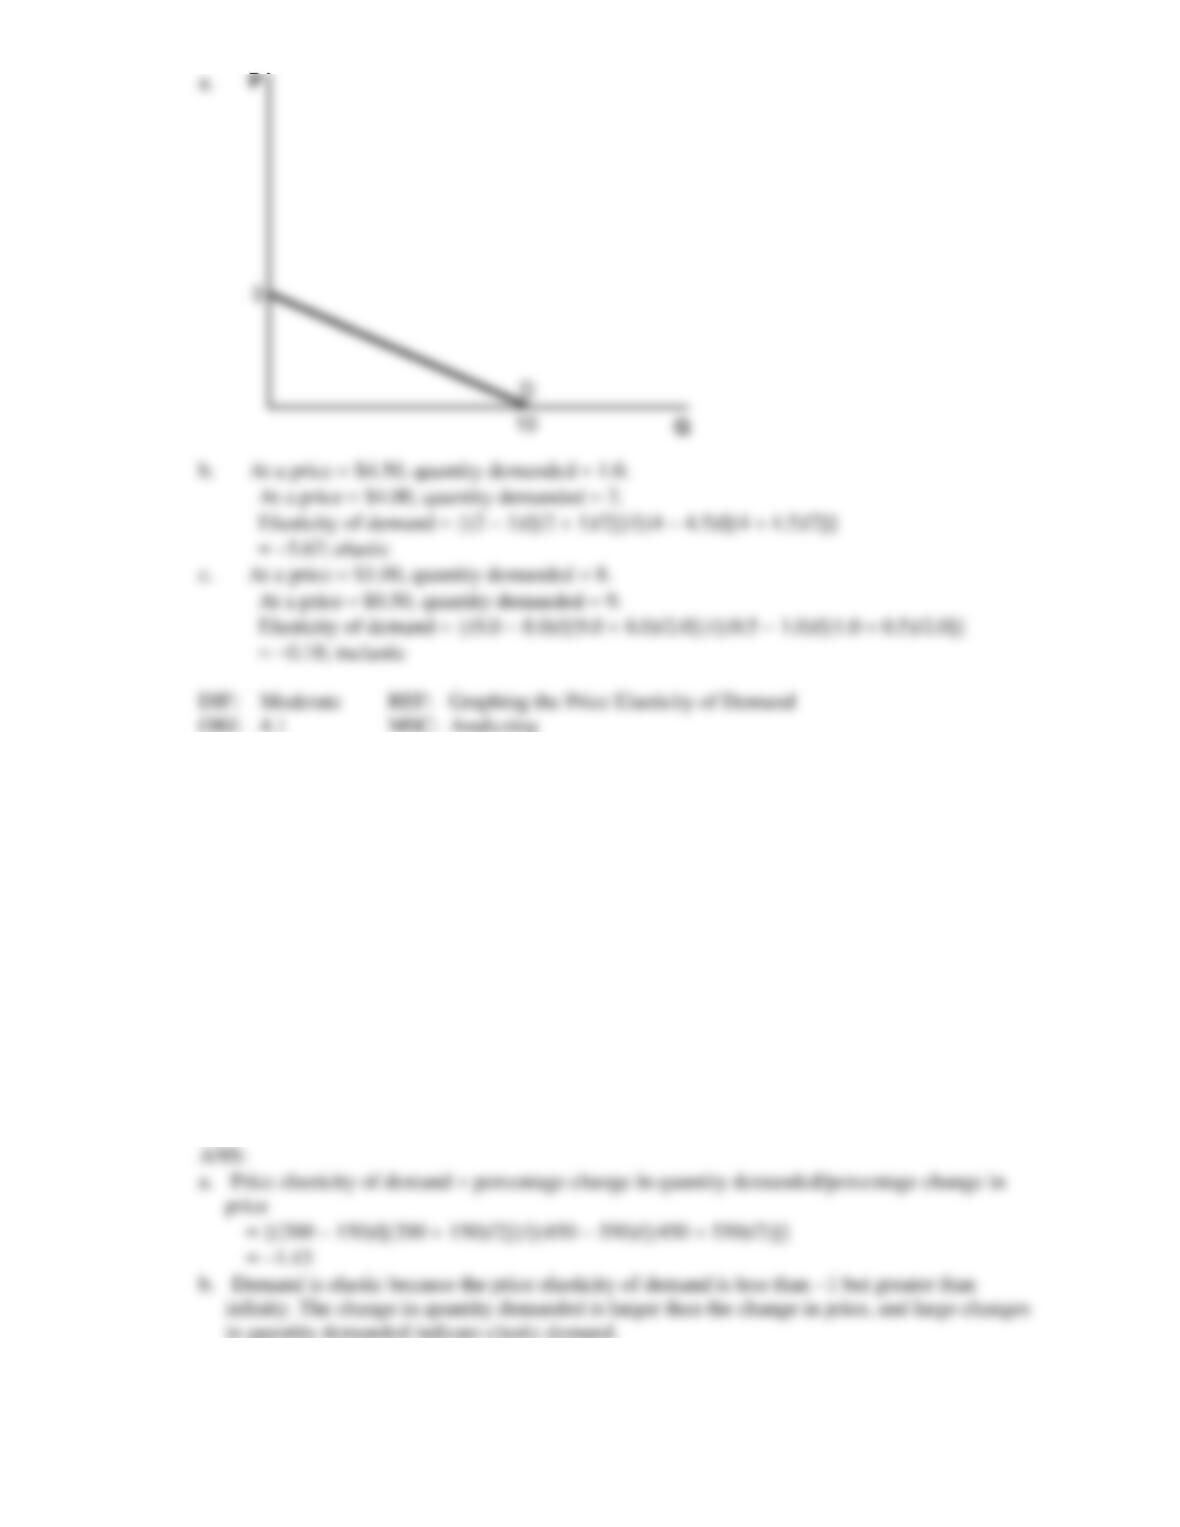
a. Calculate the price elasticity of demand when the price rises from $450 to $550 for an
individual income of $20,000.
b. Is demand elastic or inelastic? Explain your answer to the elasticity of demand you calculated
in part (a) and include the mathematical equation used to find it.
12. Graph the following situations:
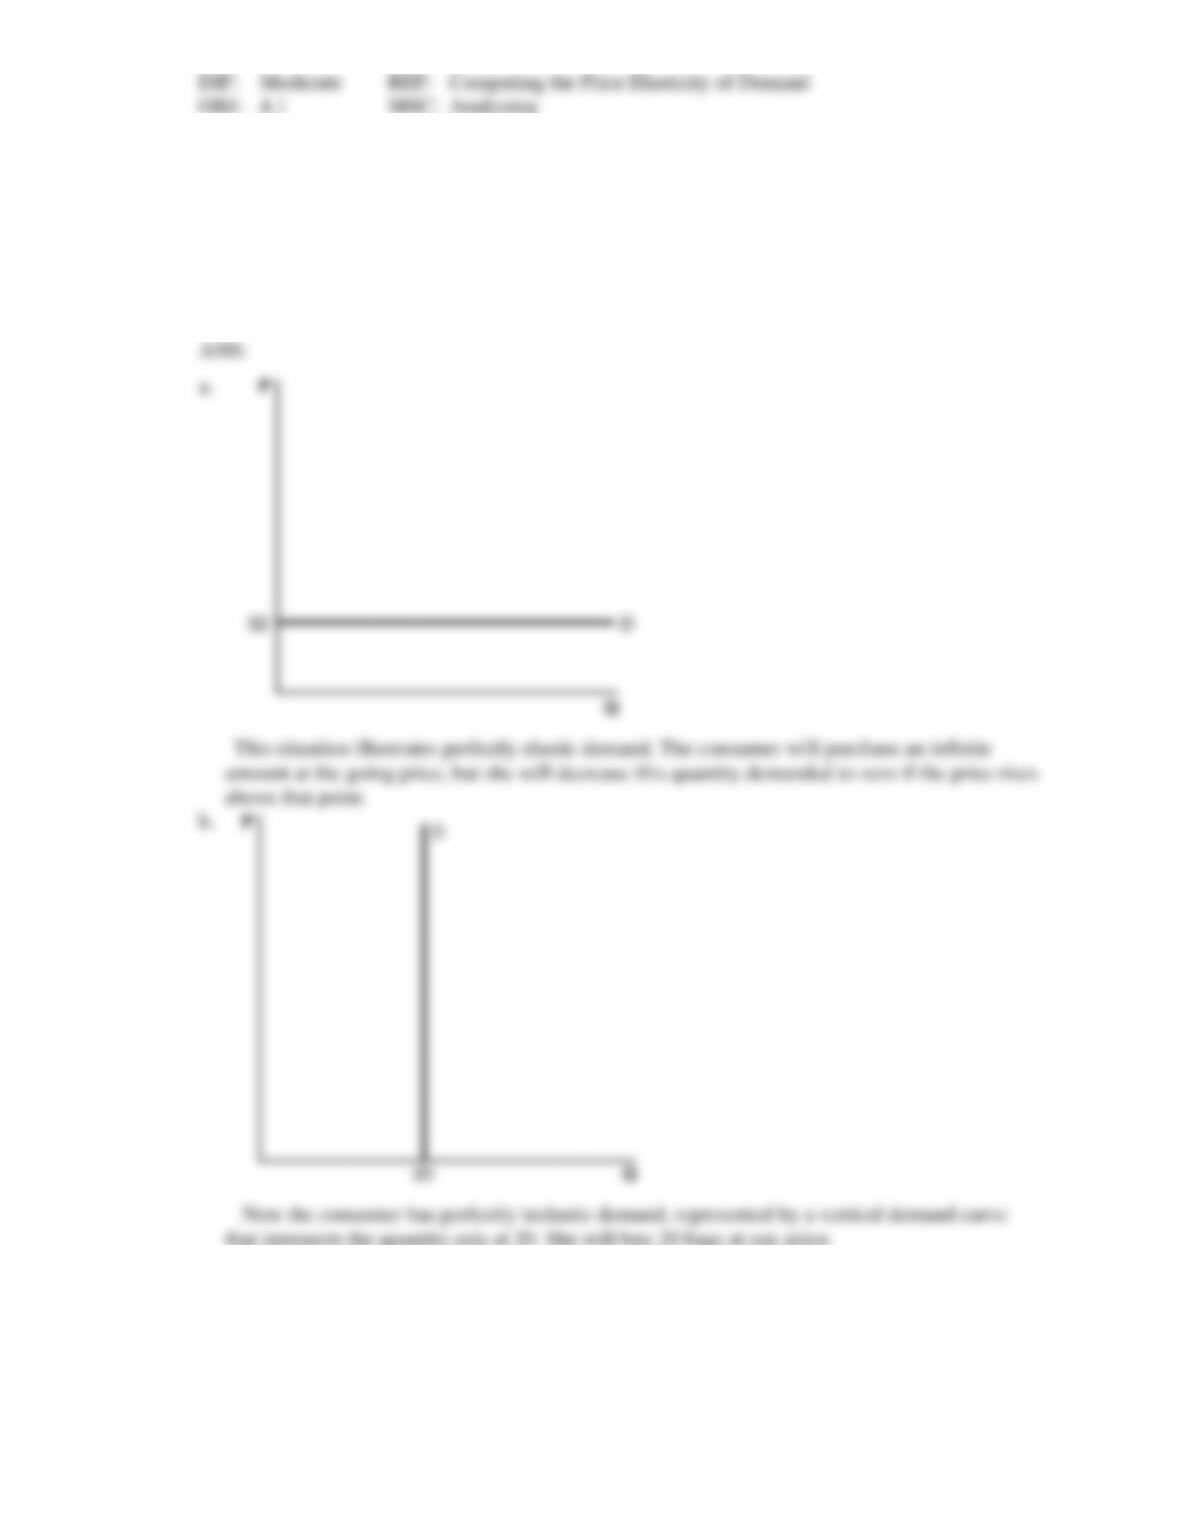
a. Brenda’s cats love Kitty Kat Treats, and she will buy as much as the store has at the current
price of $2. But when the price of Kitty Kat Treats increases by even 5 cents, she won’t buy
any!
b. Brenda will buy 20 bags of Kitty Kat Treats at any price.
c. If the price of Kitty Kat Treats rises by 5 percent, Brenda will decrease her quantity demanded
by 10 percent.
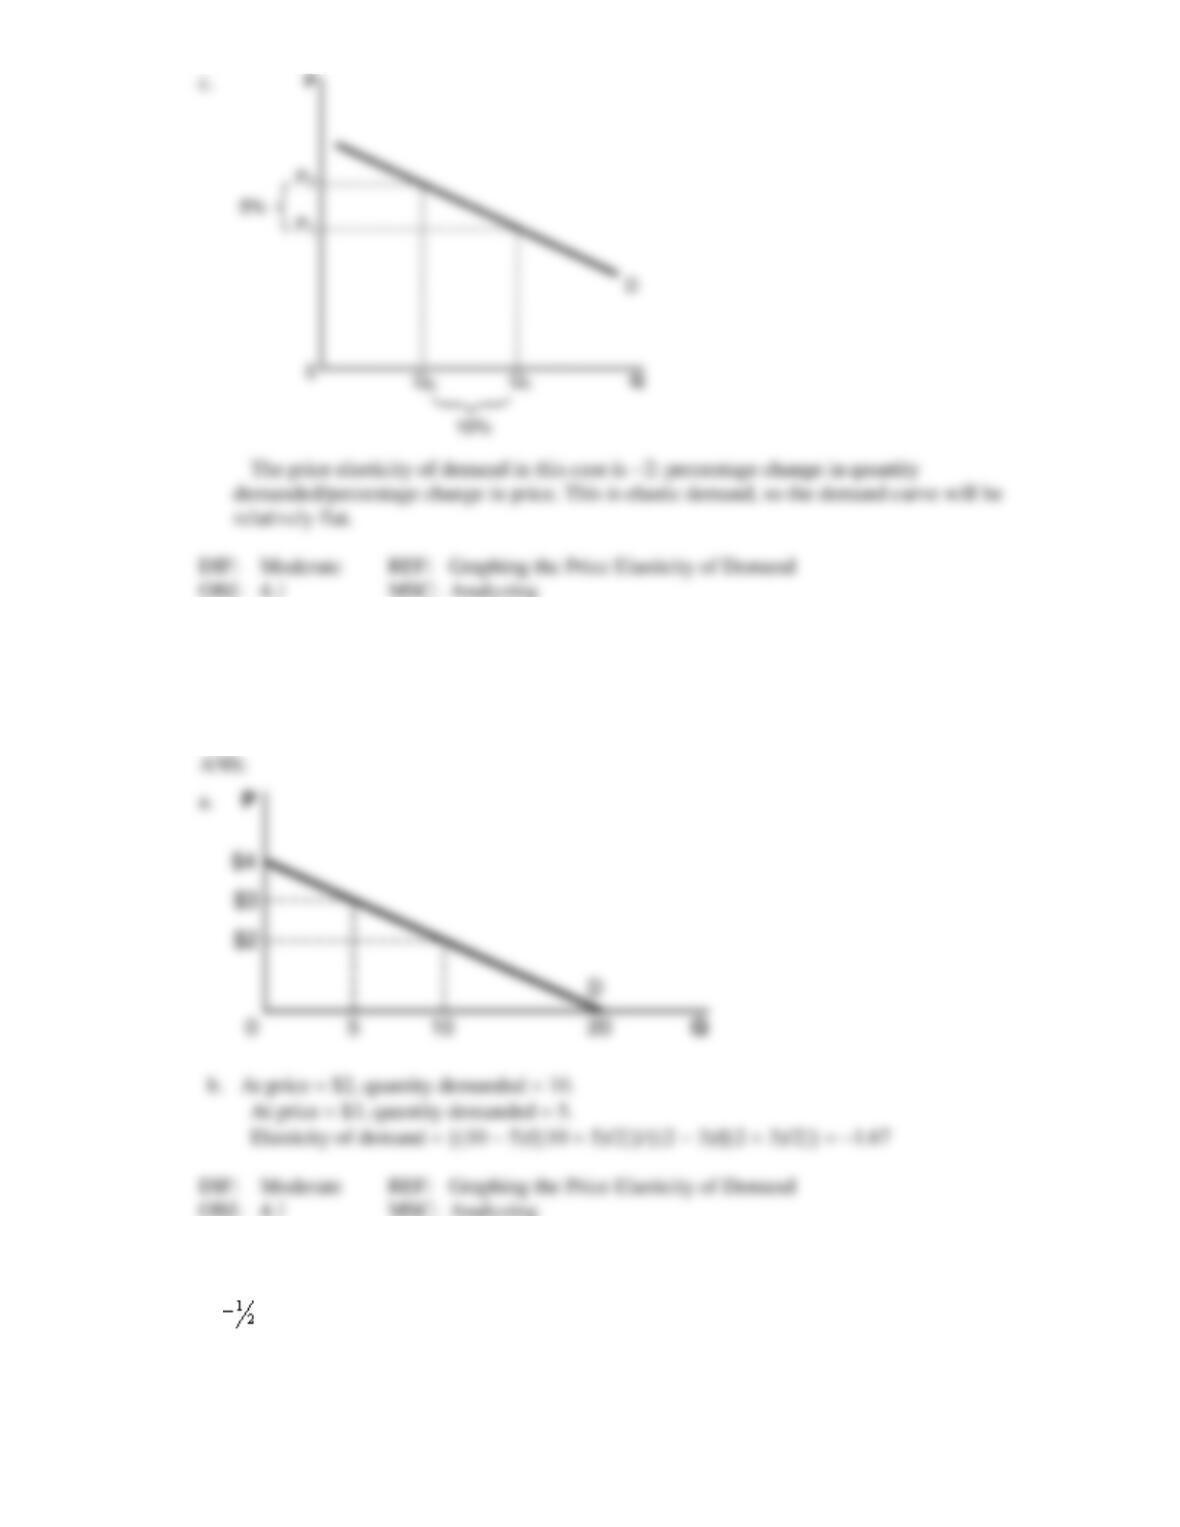
13. The government estimates that the demand curve for DVDs is represented by the equation Qd =
−5P + 20.
a. Graph the demand curve.
b. Using prices of $2 and $3, determine the price elasticity of demand.
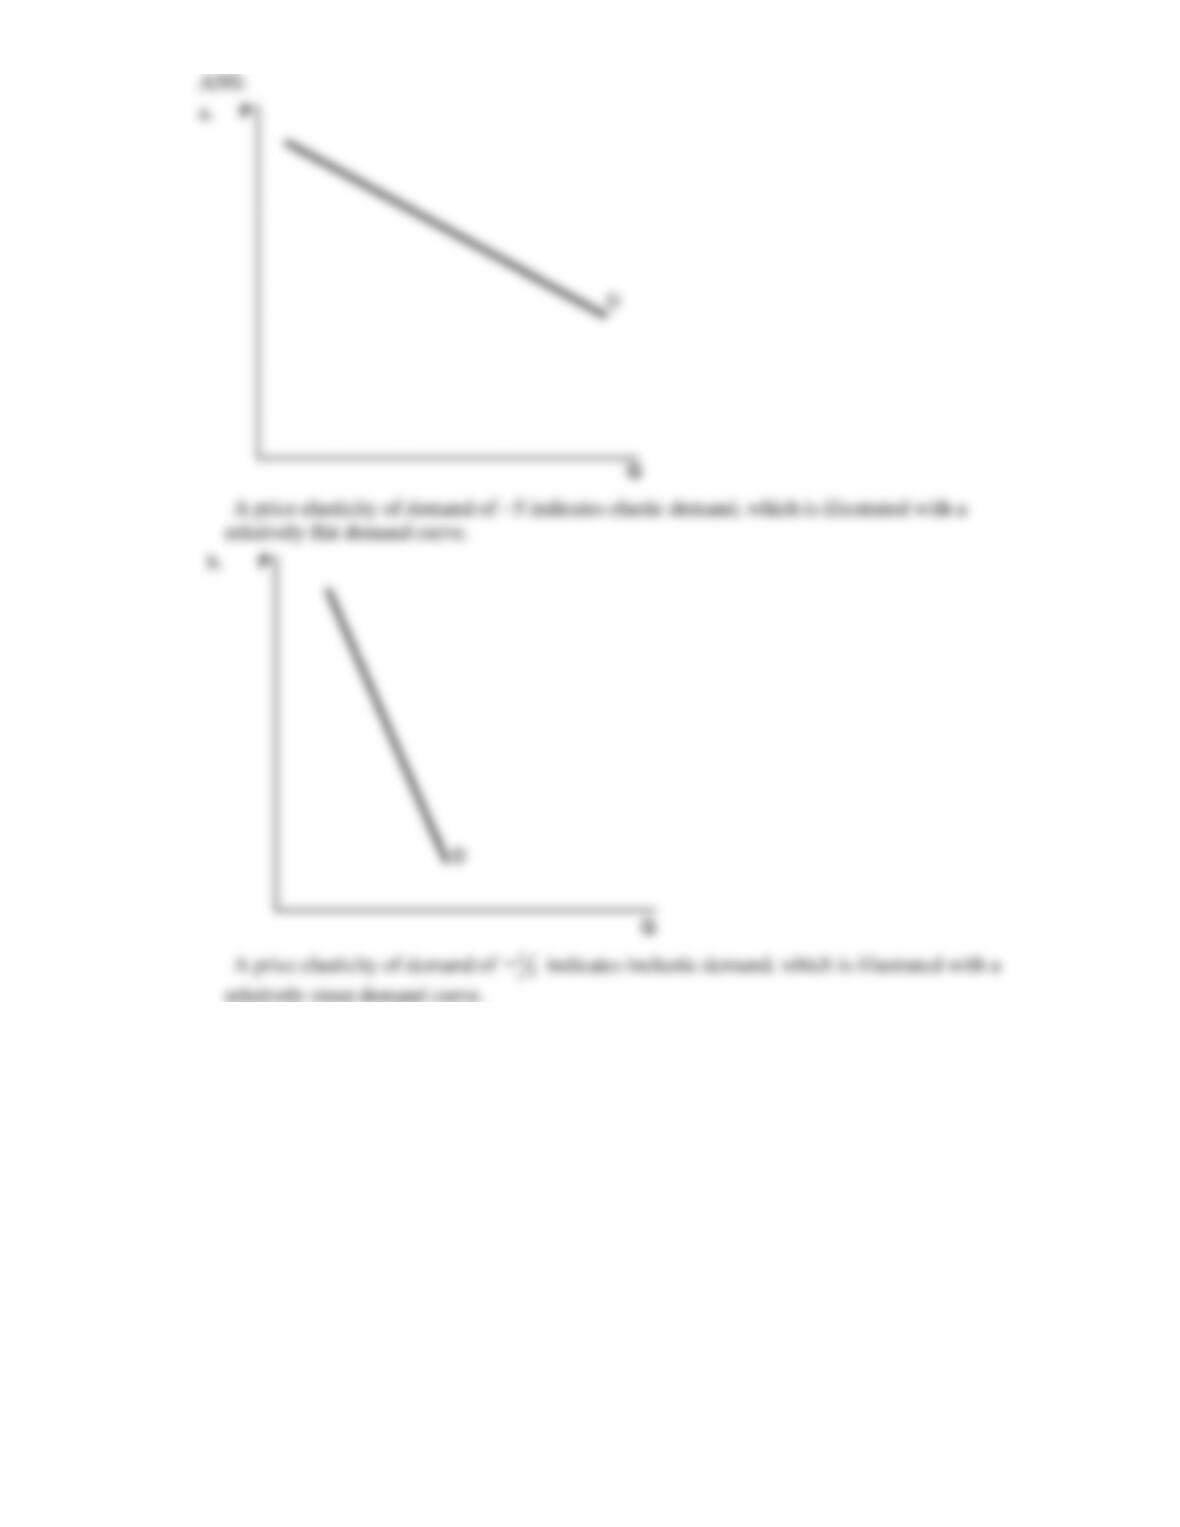
14. If we know that the price elasticity of demand is:
a. −5, graph the demand curve.
b. , graph the demand curve.
c. infinite, graph the demand curve.
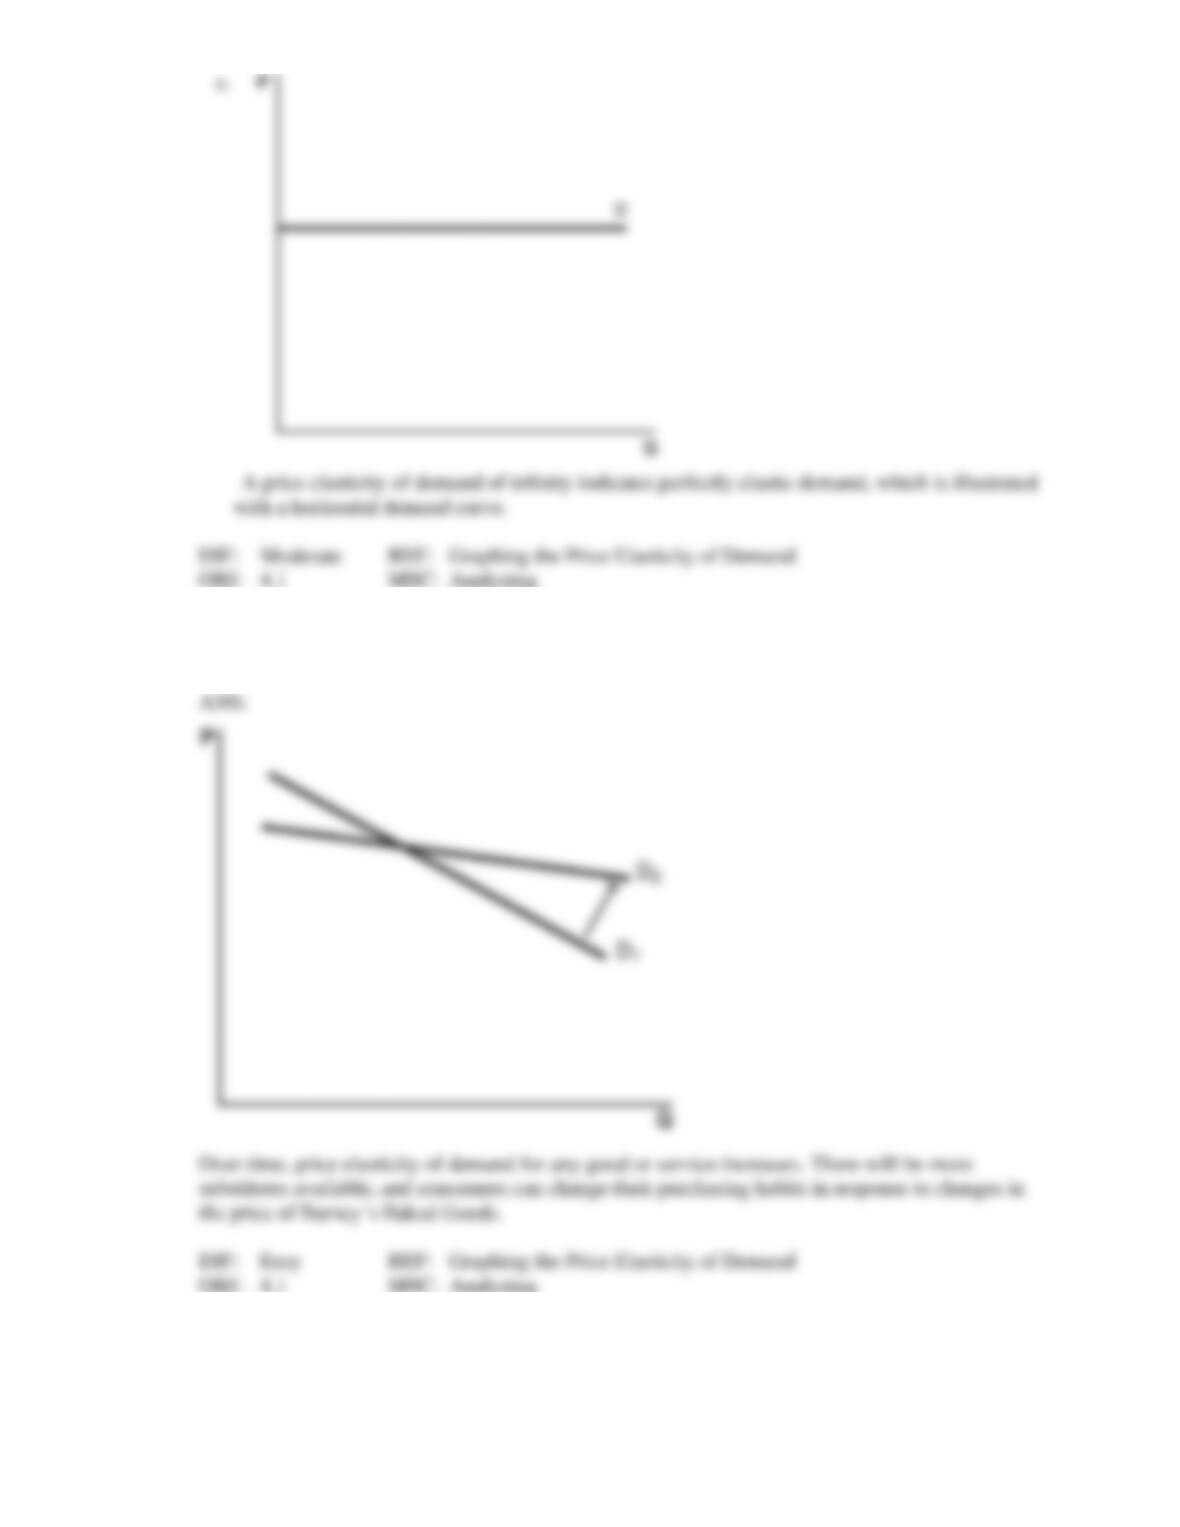
15. Graph and explain the impact that time has on the price elasticity of demand for Barney’s Baked
Goods.
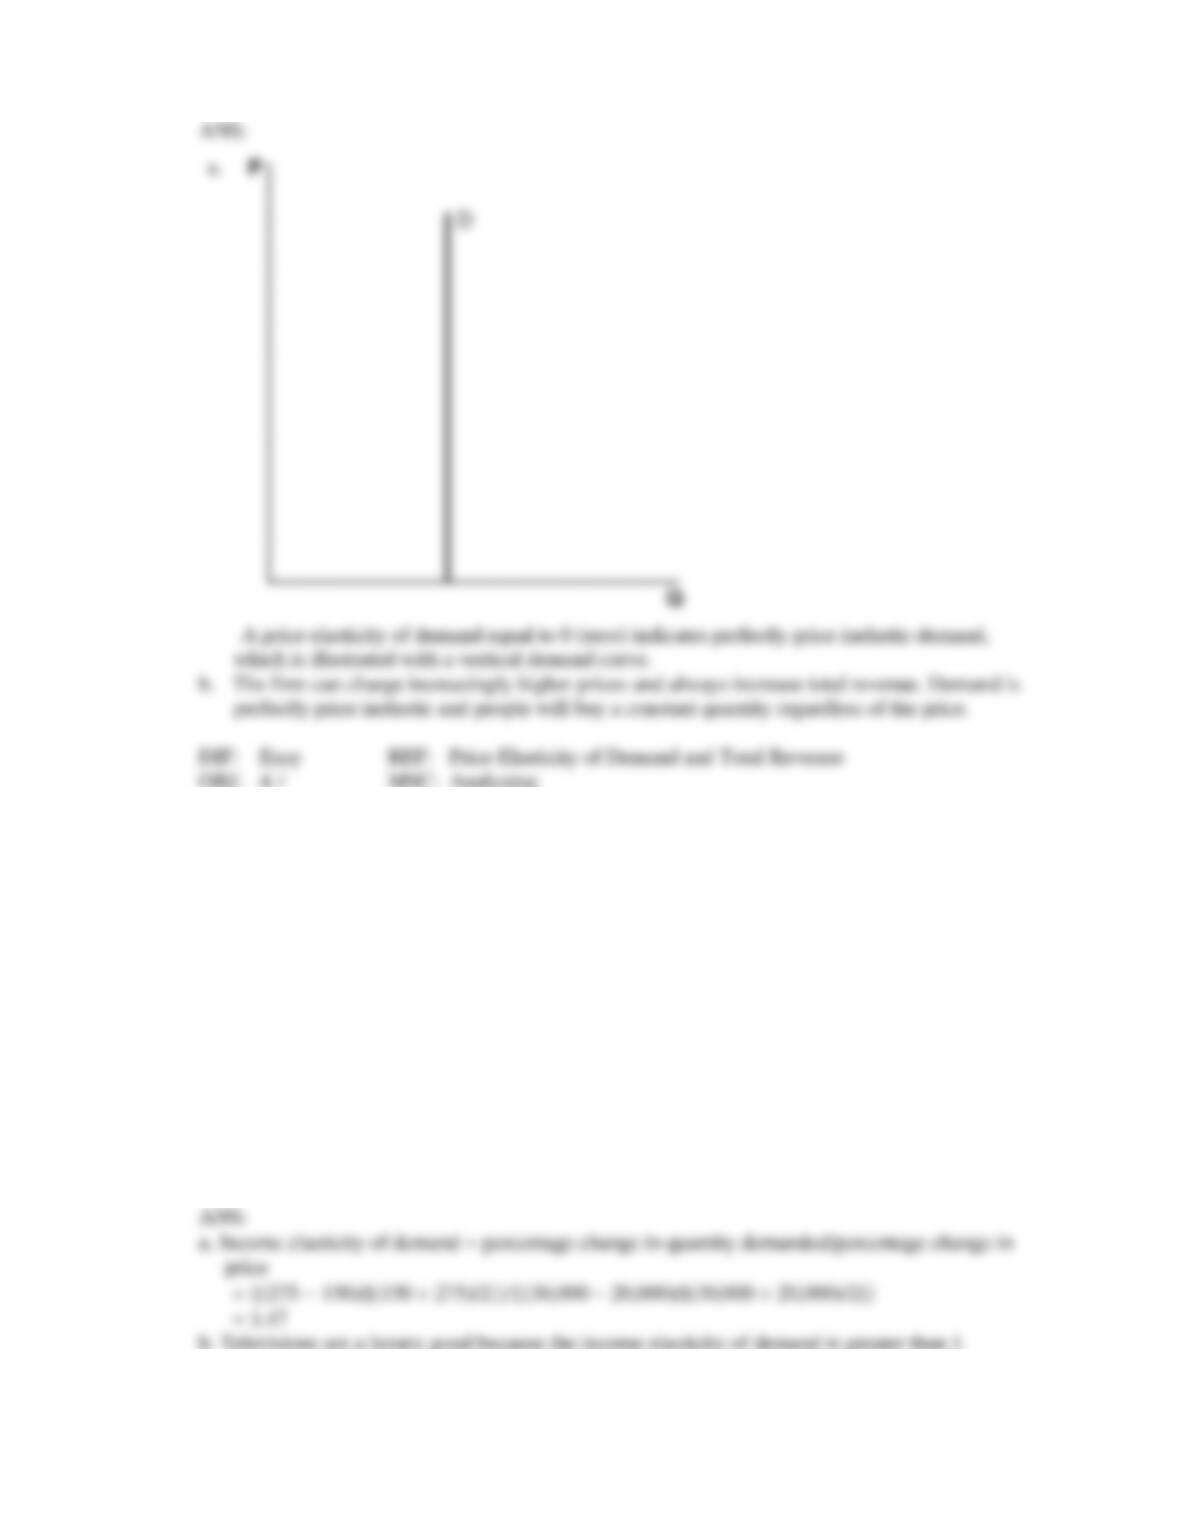
16. A firm knows that the price elasticity of demand for its service is 0 (zero).
a. Graph this demand curve.
b. What should the firm do to the price of its good to raise total revenue?
17. Refer to the accompanying graph.
Price Quantity of Televisions
(Y = 20,000) Quantity of Televisions
(Y = 30,000)
$350 250 375
$450 200 325
$550 150 275
$650 100 225
$750 50 175
a. Calculate the income elasticity of demand for televisions at a price of $550.
b. Are televisions a luxury good, necessity good, or inferior good? Explain.
c. Name a good for which consumption would likely fall when there is an increase in income
from $20,000 to $30,000. Explain your reasoning.
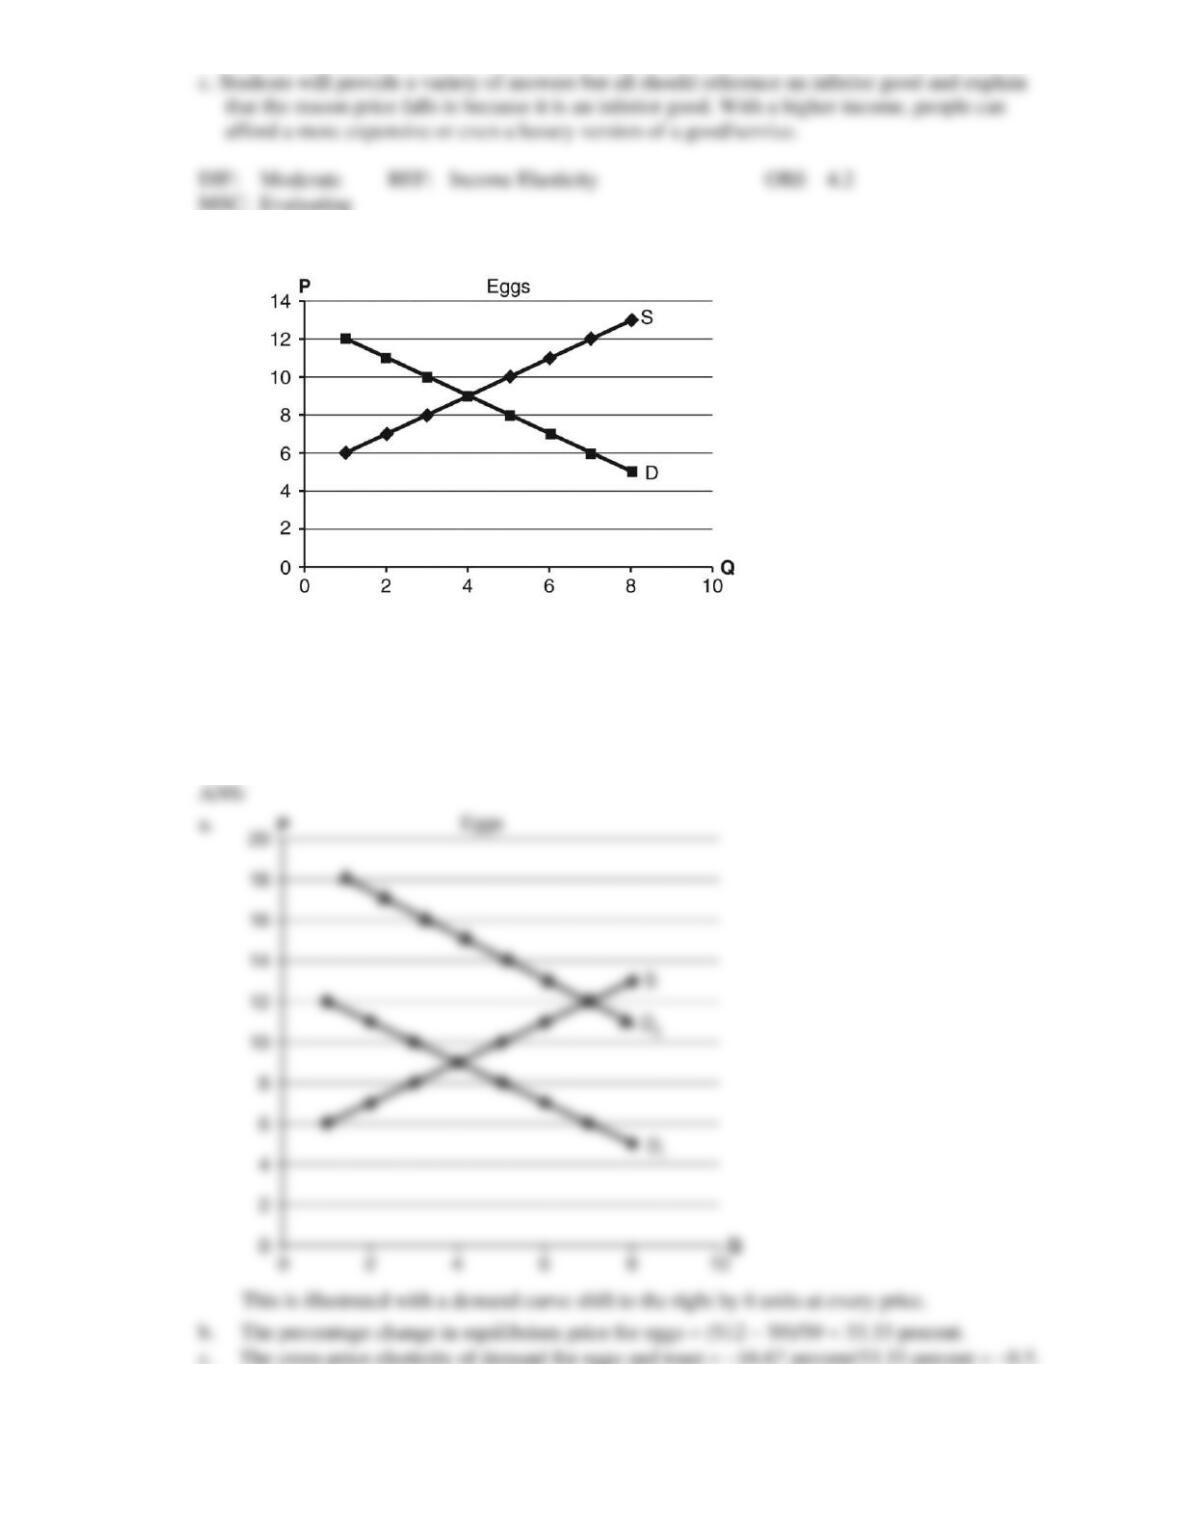
18. Use the accompanying graph to answer the following questions.
a. A study shows the many health benefits of eating eggs for breakfast. Demand rises by 6 units at
each price. Draw this on the graph.
b. What is the percentage change in equilibrium price for eggs?
c. If the percentage change in quantity demanded for toast decreased by 1/2 of what you found in
part (b) for eggs, what is the cross-price elasticity of demand for eggs and toast?
d. Will this be positive or negative? Are eggs and toast related to each other?
19. What would you expect the cross-price elasticity of demand to be for chips and salsa? Explain your
answer.
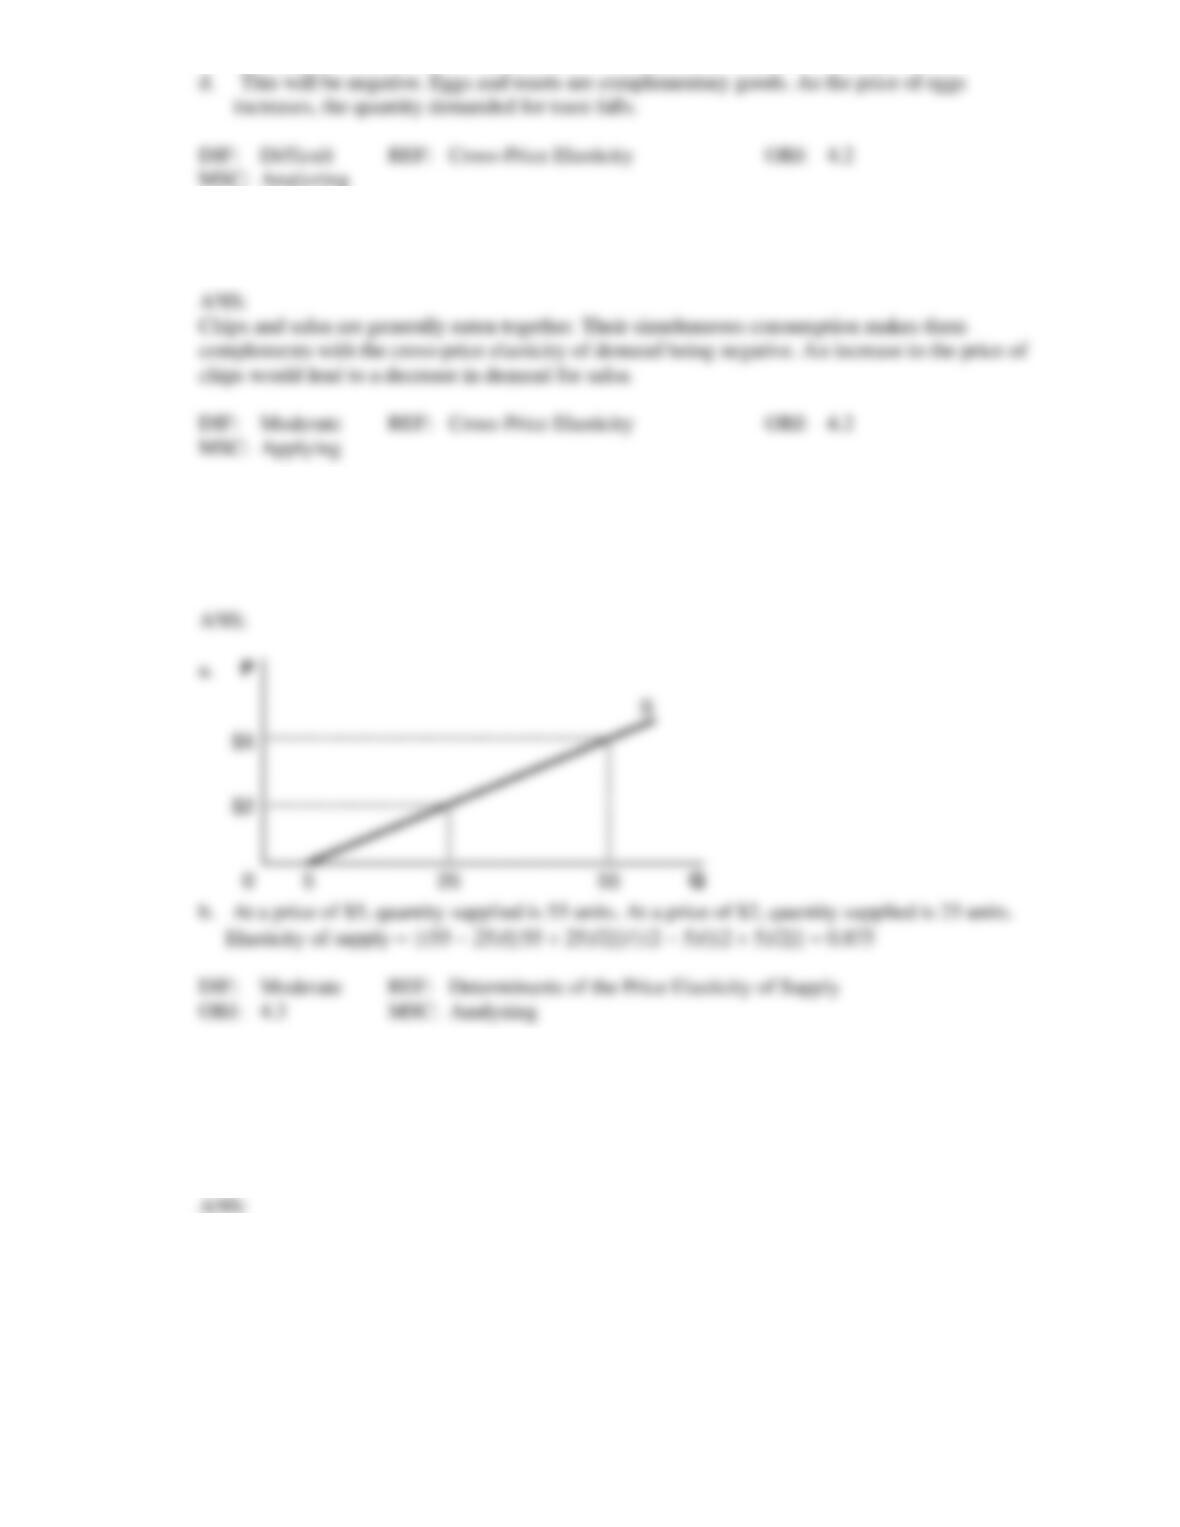
20. The supply curve for Fancy Flowers is represented by the equation Qs = 5 + 10P.
a. Graph the supply curve.
b. Using prices of $5 and $2, determine whether the price elasticity of supply is elastic or
inelastic.
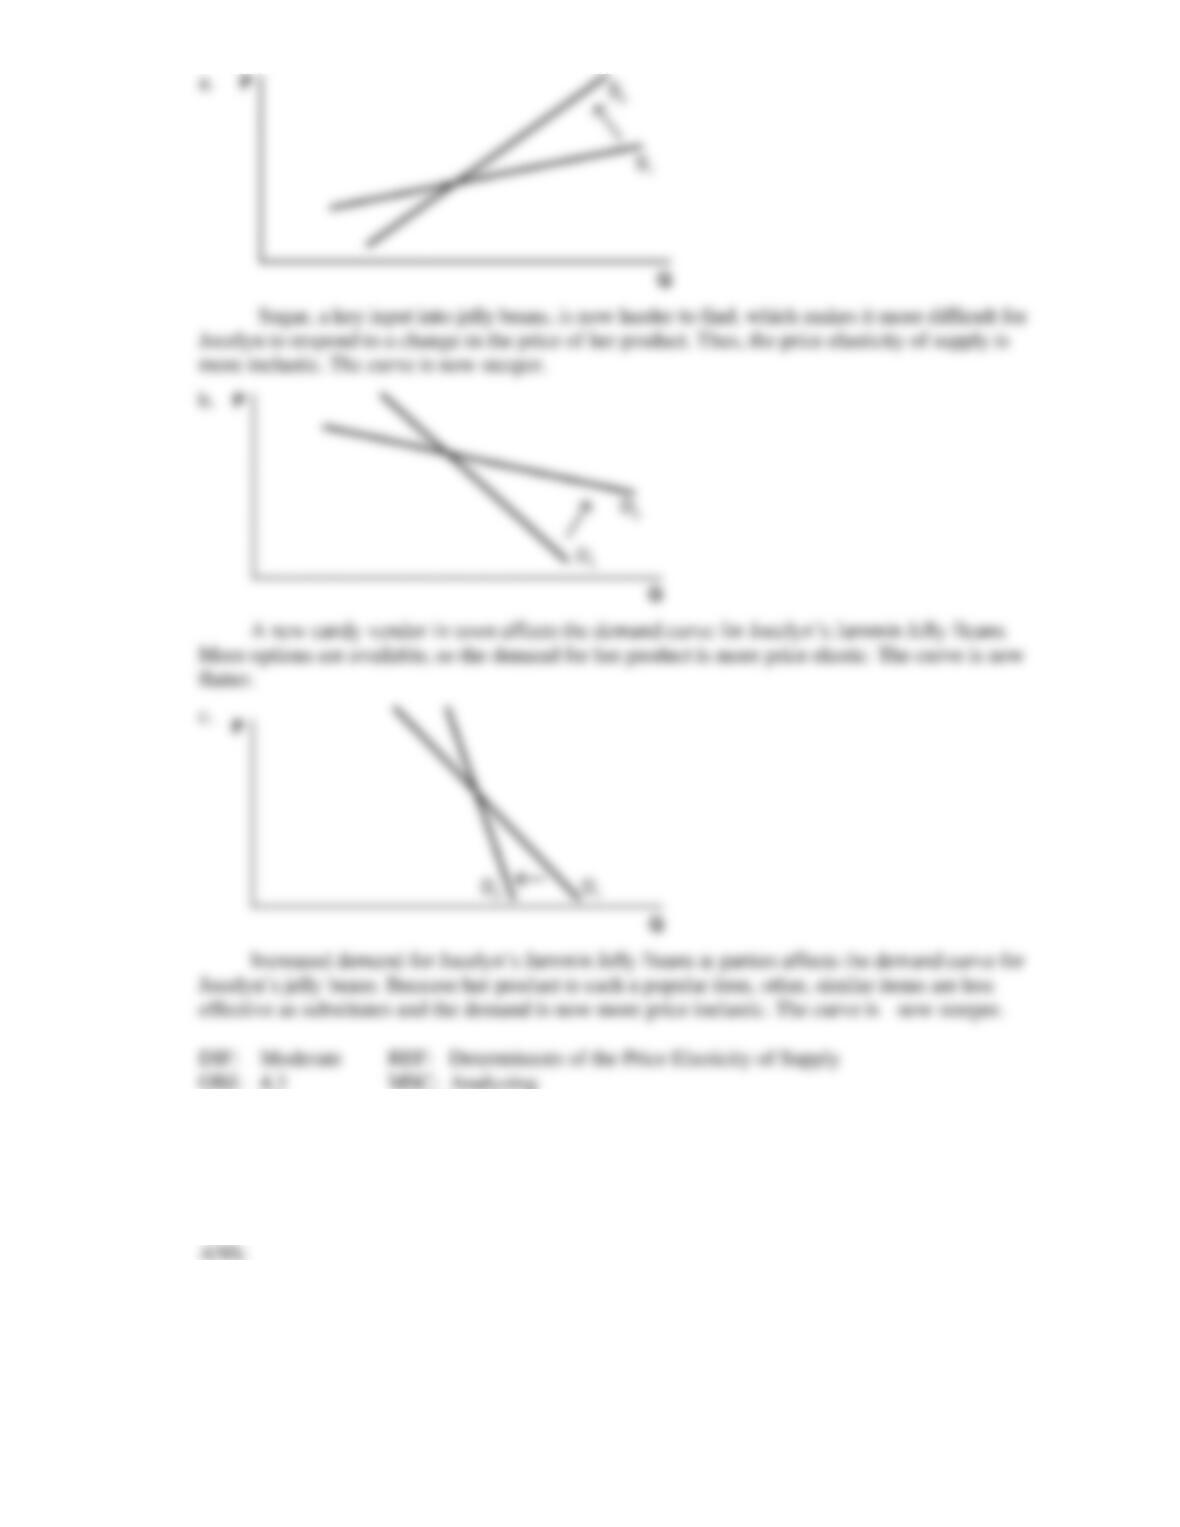
21. Graph and explain the appropriate shape of the supply or demand curve for Jocelyn’s Jammin Jelly
Beans when:
a. there is a hurricane that destroys most sugarcane fields.
b. a new candy vendor opens a shop in town.
c. Jocelyn’s Jammin Jelly Beans become the hottest item to have at parties.
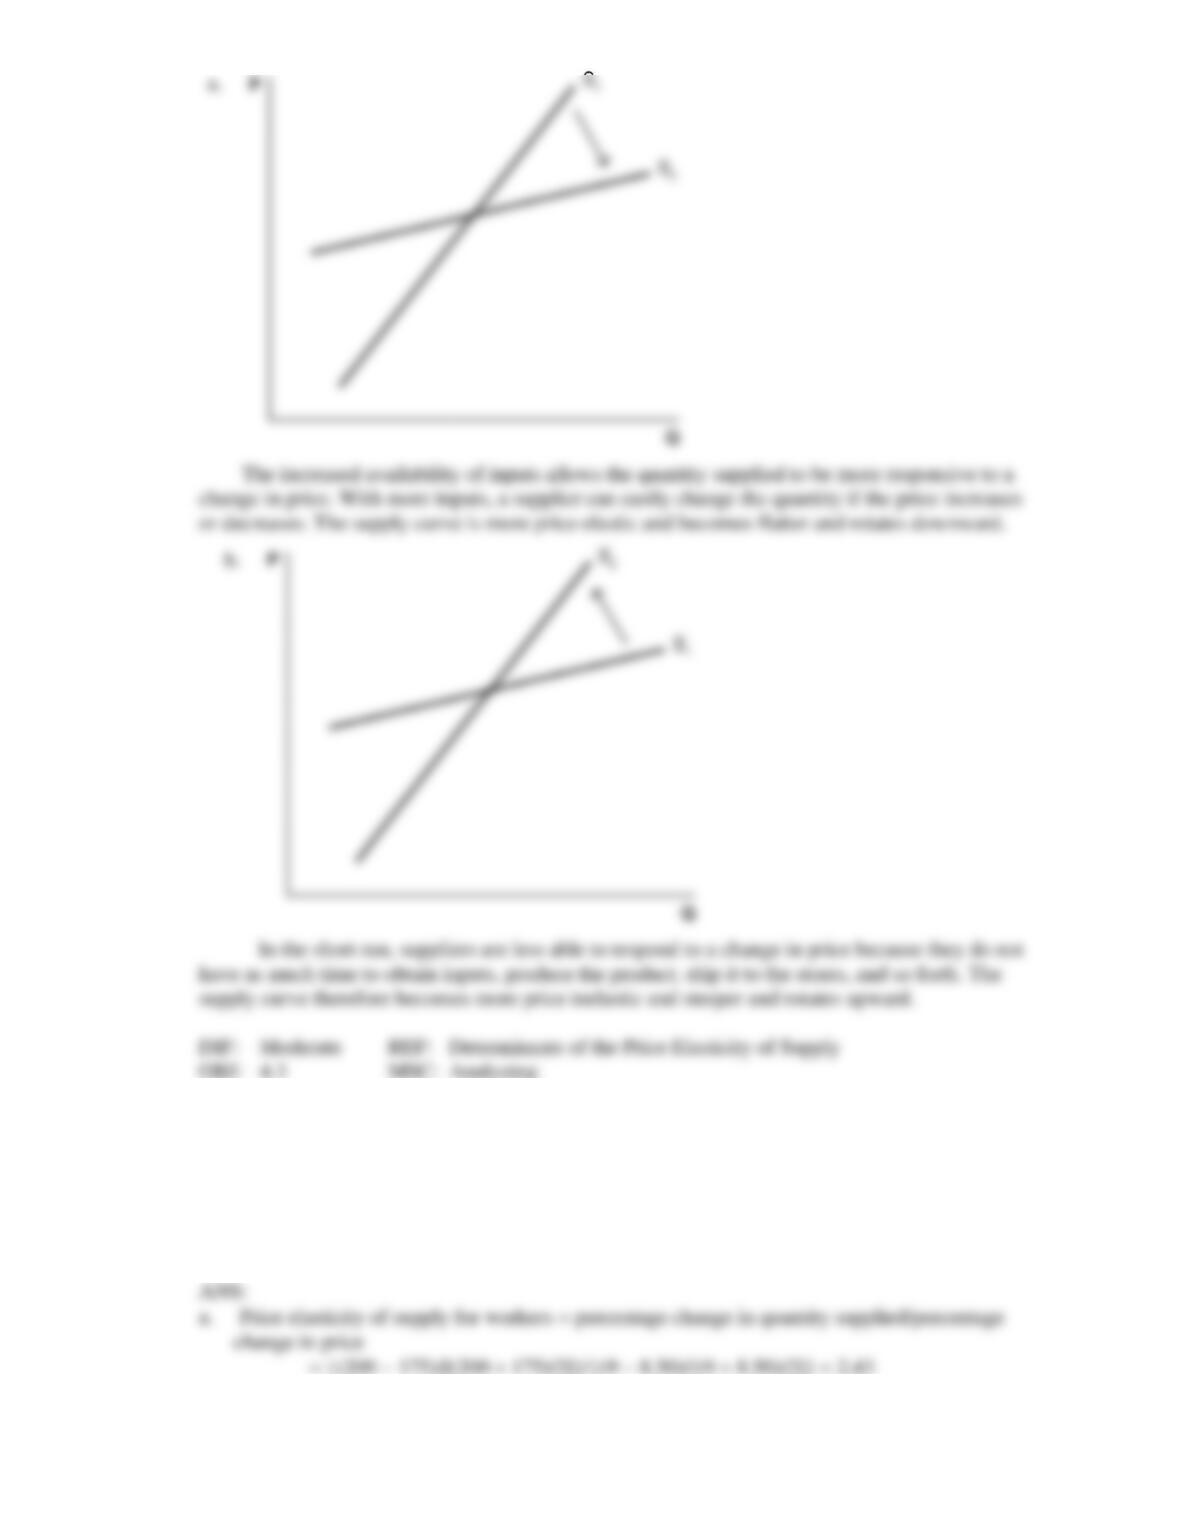
22. Suppose that the supply curve for televisions is linear and has a slope of 1. Graph the effect of the
following on the supply curve and explain each:
a. the availability of inputs (LED screens and wires) for increases for televisions.
b. the time period of supply under consideration shortens to the upcoming week.
23. In a recession, there are many unemployed workers. Employers find that when the price of labor is
$9.00, the quantity supplied is 200 workers. When they lower the wage to $8.50, 175 workers are
willing to work.
a. Calculate the price elasticity of supply for workers.
b. Over time, technology becomes more effective as a substitute for workers. What happens to the
firm’s demand for workers? Explain.
24. Toyota uses a just-in-time production method to respond to consumer demand for its vehicles. In
essence, it relies on various cues to signal when new vehicles should be made rather than stocking
inventory. This allows Toyota to respond very quickly to changes in consumer demand. Explain
whether this system makes elasticity of supply relatively price elastic or price inelastic.
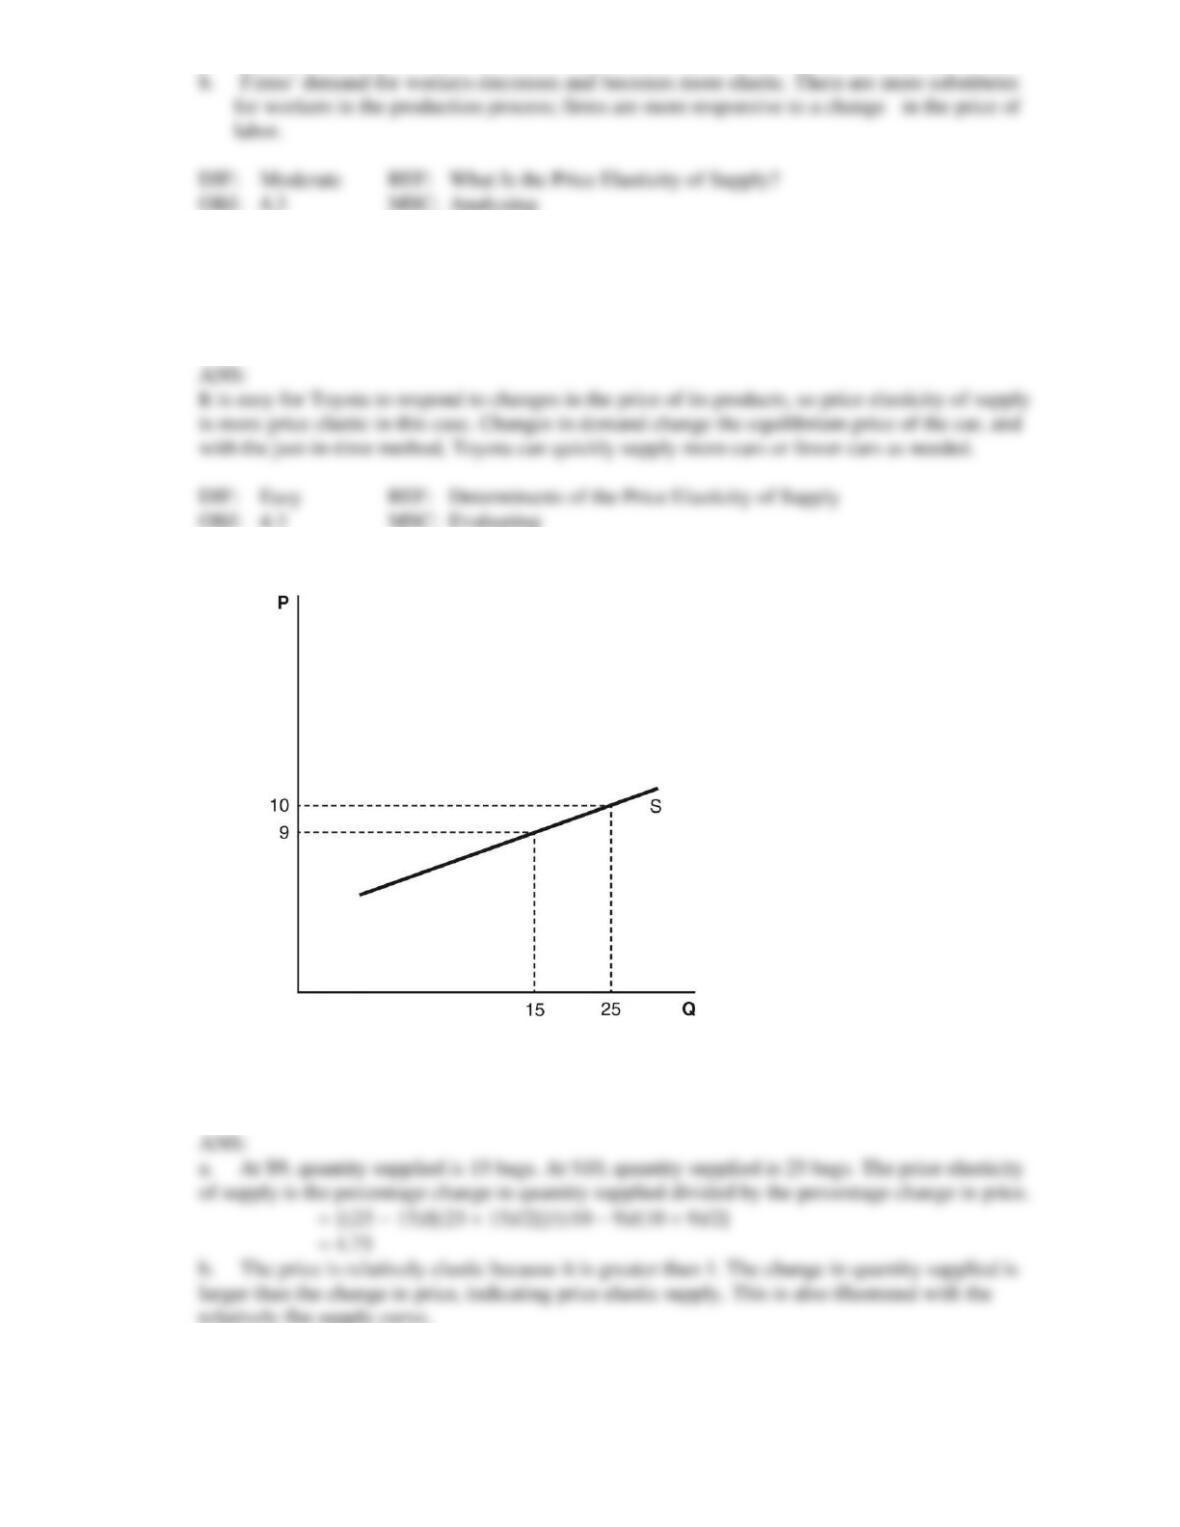
25. The supply curve for Mio’s Munchies is shown in the accompanying figure.
a. What is the price elasticity of supply between $9 and $10?
b. Is this price elasticity relatively elastic or inelastic? Explain.
c. What happens to this supply curve if Mio has difficulty finding workers to make his product?